|
|
REPORT RAPPORT |
|
|
REPORT RAPPORT |
|
DATE:
|
22 October 2012 |
|
TO/DEST:
|
Executive Director, Ottawa Police Services Board |
|
FROM/EXP:
|
Chief of Police, Ottawa Police Service |
|
SUBJECT/OBJET: |
COMPLAINTS REPORT – PART V, POLICE SERVICES ACT –THIRD QUARTER 2012 |
![]()
RECOMMENDATION
That the Ottawa Police Services Board receive this report for information.
BACKGROUND
The Ottawa Police Service (OPS) considers all complaints, public and chief’s, regarding policies, the delivery of service, and officer conduct as an opportunity to ensure its practices meet the highest standards and its service to the community meets all expectations. The process for dealing with complaints is outlined in Part V of the Ontario Police Services Act, entitled “Complaints and Disciplinary Proceedings” and is managed through the Office of the Chief Directorate and the Professional Standards Section.
The following report will provide comparisons in specific complaint types over those reported during the same time period for the previous year, and the five year average to add context. The comparisons are an important way to track any emerging trends and to provide a glimpse at what types of complaints are being received. The statistics are charted by category and include cumulative numbers from the same time period for the previous year to highlight increases and decreases.
DISCUSSION
Highlights
Valuable information is gleaned from the analysis of the reported statistics. Here are a few highlights:
· Overall complaints declined when compared to the same time period in 2011 (9.6%) and remained 17.1% lower than the five year average.
· Total public complaints were 19.2% lower than 2011, as well as 14.8% lower than the five year average
· Chief’s complaints increased by 3.1% when compared to the same time period in 2011; however they were 19.3% lower than the five year average.
Further details and statistical analysis are provided below with respect to specific categories. Note: All data are valid on the day extracted from the database and are subject to changes or updates as new information becomes available.
New Complaints
Complaints about policy, service or conduct are received from members of the public through the Office of the Independent Police Review Director (OIPRD) and may also be initiated internally as Chief’s complaints.
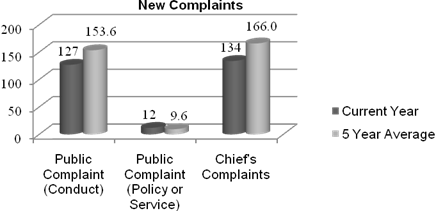
A total of 273 complaints were received by the end of the third quarter of 2012, a decrease of 29 complaints when compared to the same time period in 2011 and 56.2 fewer than the five year average.
There were 28 fewer complaints filed by members of the public in relation to officer conduct when compared to those received in 2011 and as well 26.6 fewer than the five year average.
Policy/service complaints filed by members of the public were 5 less than the 2011 total of 17, and were more in line with the five year average of 9.6.
Chief’s complaints showed a slight increase (4) over 2011, however they were 19.3% (32) lower than the five year average of 166.
The following table outlines the number of new complaints received in Q3 compared to the same time period last year.
|
Table 1 New Complaints |
||||||
|
Q3 2012 |
2011 YTD |
2012 YTD |
5 YR AVG YTD |
|||
|
Public Complaint (Conduct) |
57 |
155 |
127 |
153.6 |
||
|
Public Complaint (Policy or Service) |
9 |
3 |
12 |
9.6 |
||
|
Chief's Complaints |
42 |
35 |
130 |
166.0 |
||
|
TOTAL |
108 |
73 |
302 |
273 |
329.2 |
|
|
|
||||||
|
|
||||||
Classification of Complaints
Complaints received by the OPS are reported and tracked by complaint type to add value to analytical data. Tracking the data allows analysis on emerging trends, and identifies spikes and dips that can be further analysed to isolate the period impacted and other variables that may account for the change. It also provides an early opportunity to respond with methods to stabilize the trend such as revision to policy, training, or appropriate communication. The following tables provide the number of complaints received in Q3 in relation to the same time period in the previous year.
Conduct Complaints:
The category of ‘conduct complaints’ is broken down to reflect specific allegation types that are tracked.
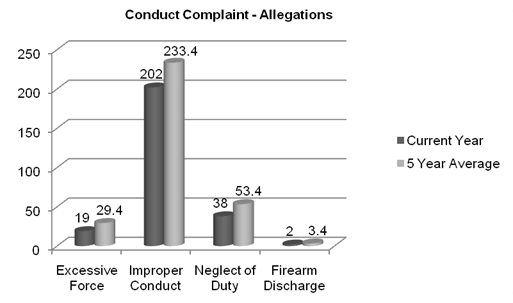
By the end of Q3 2012 a total of 261 conduct complaints were received (24 less than the 2011 total of 285 and 58.6 fewer than the five year average of 319.6).
Excessive force complaints totalled 19 by the end of Q3 2012, 9 less than the 2011 total of 28 and 10.4 fewer than the five year average of 29.4.
Improper conduct complaints totalled 202 by the end of Q3 2012, just one higher than those received in 2011 and 31.4 less than the five year average of 233.4.
Neglect of duty complaints totalled 38, 18 fewer than the 56 received in 2011 and 15.4 less than the five year average of 53.4.
A total of 2 firearms discharge were received in 2012, after zero in 2011; 1.4 less than the five year average of 3.4.
This table breaks down the conduct complaints by way of specific allegation.
|
Table 2 Conduct Complaints – Types of Allegations |
||||||
|
Q3 2011 |
Q3 2012 |
2011 YTD |
2012 YTD |
5 YR AVG YTD |
||
|
Excessive Force |
9 |
7 |
28 |
19 |
29.4 |
|
|
Improper Conduct |
68 |
55 |
201 |
202 |
233.4 |
|
|
Neglect of Duty |
22 |
7 |
56 |
38 |
53.4 |
|
|
Firearm Discharge |
0 |
1 |
0 |
2 |
3.4 |
|
|
TOTAL |
99 |
70 |
285 |
261 |
319.6 |
|
|
|
||||||
|
|
||||||
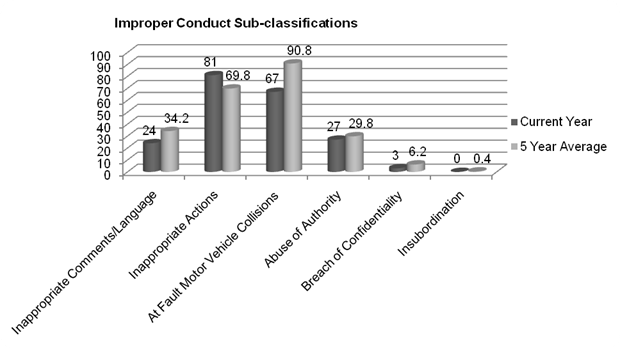
Improper conduct complaints form a significant portion of the complaints received. In 2008 this category was further divided into sub-classifications to better track what type of behaviour was generating the complaint, recognize trends and to address the concerns of the community.
Inappropriate comments/language decreased by 7 when compared to the Q3 2011 total; 10.2 less than the five year average.
There was an increase of 20 inappropriate actions allegations over the Q3 2011 total; 11.2 higher than the five year average.
Similar to the last quarter totals both at fault motor vehicle collisions (-14) and breach of confidentiality (-2) exhibited decreases when compared to Q3 2011 totals.
Insubordination allegations remained at zero, the same as in 2011 and slightly under the five year average of .4.
|
Table 3 Improper Conduct Sub-classifications |
||||||
|
Q3 2011 |
Q3 2012 |
2011 YTD |
2012 YTD |
5 YR AVG YTD |
||
|
Inappropriate Comments/Language |
17 |
8 |
31 |
24 |
34.2 |
|
|
Inappropriate Actions |
23 |
27 |
61 |
81 |
69.8 |
|
|
At Fault Motor Vehicle Collisions |
24 |
12 |
81 |
67 |
90.8 |
|
|
Abuse of Authority |
4 |
8 |
23 |
27 |
29.8 |
|
|
Breach of Confidentiality |
5 |
3 |
6.2 |
|||
|
Insubordination |
0.4 |
|||||
|
TOTAL |
68 |
55 |
201 |
202 |
231.2 |
|
|
|
||||||
|
|
||||||
Policy/Service Complaints:
A total of 12 policy/service complaints were received by the end of Q3 2012, 5 fewer than the 17 received during the same time period in 2011 and 2.4 more than the five year average of 9.6. The majority (91.6%) of these complaints relate to the service provided by the Police Service.
This table distinguishes between policy complaints and those relating to service.
|
Table 4 Policy/Service Complaints* |
|||||
|
Q3 2011 |
Q3 2012 |
2011 YTD |
2012 YTD |
5 YR AVG YTD |
|
|
Policy |
2 |
2 |
1 |
1.2 |
|
|
Service |
7 |
3 |
15 |
11 |
8.4 |
|
TOTAL |
9 |
3 |
17 |
12 |
9.6 |
|
*in light of the fact that the number of complaints is minimal no chart has been created. |
|||||
Complaint Status
All public complaints are processed through the OIPRD and are evaluated based on provincial criteria. The OIPRD may choose not to have the matters investigated after a review of their merit by determining them to be: frivolous, vexatious, etc.; over six months; not directly affected.
Chief’s complaints are investigated to determine officer misconduct and compliance with OPS policy.
Both public and chief’s complaints can be finalized as substantiated or unsubstantiated. Once substantiated, they can be resolved through informal resolution, informal discipline or formal discipline.
Conduct Complaint Status:
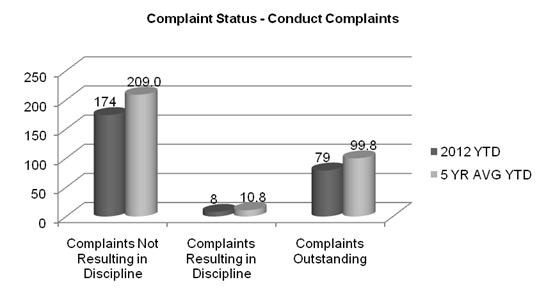
Of the 261 conduct complaints received in 2012, 182 were resolved by the end of Q3 2012, representing 69.7% of total conduct complaints received. Of the 182, 174 did not result in discipline and 8 resulted in informal discipline.
Included in the 174 which did not result in discipline are those that OIPRD deemed to be either frivolous, vexatious, etc. (14), over the six month statutory limitation (7), third party – not directly affected (1), or they did not identify any breach of the Police Services Act or its Code of Conduct (27).
A total of 21 complaints were resolved through informal resolution, 75% higher than the 2011 total of 12 and slightly higher than the five year average of 18.2.
A total of 26 complaints were withdrawn by the complainant, including 6 that were processed through the Voluntary Alternative Dispute Resolution Program (VADRP). While the number of complaints withdrawn by the complainant remained lower than the same time period in 2011 (37), they are similar to the five year average of 21.8.
This table outlines the manner in which complaints have been resolved. The shaded areas reflect subtotals and total number of complaints.
|
Table 5 Complaint Status – Conduct Complaints |
|||||||
|
RESOLUTION |
Q3 2011 |
Q3 2012 |
2011 YTD |
2012 YTD |
5 YR AVG YTD |
CARRYOVER PRIOR YEARS* |
|
|
Unsubstantiated |
2 |
26 |
12 |
28.4 |
18 |
||
|
Vexatious/Frivolous/Bad Faith |
9 |
4 |
33 |
14 |
27.4 |
||
|
Informal Resolution |
2 |
3 |
12 |
21 |
18.2 |
5 |
|
|
Informal Resolution – VADRP |
4.8 |
||||||
|
No Further Action |
18 |
17 |
77 |
93 |
91.2 |
22 |
|
|
Withdrawn by Complainant |
7 |
1 |
36 |
20 |
21.8 |
5 |
|
|
Withdrawn by Complainant - VADRP |
1 |
6 |
3.4 |
3 |
|||
|
Over Six Months |
4 |
15 |
7 |
10.8 |
2 |
||
|
Third Party - Not Directly Affected |
1 |
3.0 |
|||||
|
Complaints Not Resulting in Discipline |
42 |
25 |
200 |
174 |
209.0 |
55 |
|
|
Informal Discipline |
1 |
5 |
8 |
10.6 |
3 |
||
|
Disciplinary Hearing |
1 |
0.2 |
5 |
||||
|
Complaints Resulting in Discipline |
0 |
1 |
6 |
8 |
10.8 |
8 |
|
|
Complaints Outstanding |
57 |
44 |
80 |
79 |
99.8 |
17 |
|
|
TOTAL |
99 |
70 |
286 |
261 |
319.6 |
80 |
|
|
*This column represents investigations commenced in previous years which are being dealt with in the current year |
|||||||
|
|
|||||||
Policy/Service Complaint Status:
Table 6 below illustrates that of the 12 policy/service complaints received to the end of Q3 2012, three resulted in no action, OIPRD deemed one to be frivolous, the complainant chose to withdraw in eight cases.
This table outlines the complaints that have been resolved in Q3. The policy/service complaints completed in the quarter are attached to this report as Attachment 1.
|
Table 6 Complaint Status - Policy/Service Complaints* |
||||||
|
RESOLUTION |
Q3 2011 |
Q3 2012 |
2011 YTD |
2012 YTD |
5 YR AVG YTD |
CARRYOVER PRIOR YEARS** |
|
No Further Action |
1 |
1 |
3 |
2 |
2.8 |
1 |
|
Frivolous,Vexatious, etc. |
2 |
0 |
5 |
1 |
1.6 |
0 |
|
Withdrawn by Complainant |
1 |
2 |
3 |
8 |
2.4 |
2 |
|
Withdrawn by Complainant VADRP |
0 |
0 |
0 |
0 |
0.0 |
1 |
|
Third Party |
0 |
0 |
0 |
0 |
0.0 |
0 |
|
Action Taken |
0 |
0 |
1 |
0 |
0.6 |
1 |
|
Complaints Outstanding |
5 |
0 |
5 |
1 |
2.2 |
0 |
|
TOTAL |
9 |
3 |
17 |
12 |
9.6 |
5 |
|
*In light of the fact that the number of complaints is minimal no chart has been created. |
||||||
|
**This column represents investigations commenced in previous years which are being dealt with in the current year. |
||||||
Special Investigations Unit (SIU) Investigations:
The Police Services Act provides that the SIU shall conduct criminal investigations into circumstances involving police and civilians that have resulted in serious injury or death and allegations of sexual assault.
As illustrated below in Table 7 a total of 10 SIU files were received as of the end of Q3 2012, two more than in 2011, and similar to the five year average of 9.2. Eight cases have been resolved with no criminal wrongdoing identified by the SIU. Two cases remain under investigation by SIU.
This table outlines the SIU investigations for the year. The Police Services Board receives a separate report on each SIU case.
|
Table 7 Special Investigations Unit Investigations |
|||||
|
TYPES OF INVESTIGATIONS |
Q3 2011 |
Q3 2012 |
2011 YTD |
2012 YTD |
5 YR AVG YTD |
|
Death |
1 |
0.8 |
|||
|
Serious Injury |
5 |
3 |
8 |
8 |
8.2 |
|
Sexual Assault |
1 |
0.2 |
|||
|
TOTAL |
5 |
3 |
8 |
10 |
9.2 |
|
Investigations Resolved |
1 |
2 |
4 |
8 |
5.0 |
|
Investigations Ongoing |
4 |
1 |
4 |
2 |
4.2 |
|
TOTAL |
5 |
3 |
8 |
10 |
9.2 |
Public Complaint Reviews
The Police Services Act provides a process where complainants, dissatisfied or concerned with the outcome of an investigation, may seek a review of the Professional Standards Section decision on conduct complaints by the OIPRD.
Complainants dissatisfied with the resolution of a policy/service complaint may seek a review by the Police Services Board.
Conduct Complaint Reviews:
A total of five requests for review by OIPRD have been received. Of those OIPRD confirmed the decision of the OPS in three cases and two cases remain under review. The following table outlines the requests for review by OIPRD and how they were resolved. Please note that as OIPRD became the oversight body in October 2009, no reviews were requested until 2010. A three year average is all that is available at this time.
|
Table 8 Requests for Review by OIPRD |
|||||
|
RESOLUTION |
Q3 2011 |
Q3 2012 |
2011 YTD |
2012 YTD |
3 YR AVG YTD |
|
Confirmed Decision |
0 |
0 |
1 |
3 |
1.7 |
|
Specified Direction |
0 |
0 |
0 |
0 |
0.0 |
|
Assigned to Outside Police Service |
0 |
0 |
0 |
0 |
0.0 |
|
OIPRD to Investigate |
0 |
0 |
0 |
0 |
0.0 |
|
Action to be Taken |
0 |
0 |
0 |
0 |
0.0 |
|
Reviews Pending |
2 |
1 |
6 |
2 |
4.7 |
|
TOTAL |
2 |
1 |
7 |
5 |
6.3 |
Policy/Service Complaint Reviews:
No requests for policy/service complaint reviews by the Police Services Board have been received in 2012.
CONCLUSION
The Professional Standards Section continues to analyse and address issues that arise from complaints. The OPS uses innovative approaches to resolve complaints and ensure accountability. The Professional Standards Section remains committed to fair, objective investigations completed in a timely fashion.
(original signed by)
Charles Bordeleau
Chief of Police
Attach. (1)