|
|
REPORT RAPPORT |
|
|
REPORT RAPPORT |
|
DATE:
|
23 April 2012 |
|
TO/DEST:
|
Executive Director, Ottawa Police Services Board |
|
FROM/EXP:
|
Chief of Police, Ottawa Police Service |
|
SUBJECT/OBJET: |
COMPLAINTS REPORT – PART V, POLICE SERVICES ACT FIRST QUARTER 2012 |
![]()
RECOMMENDATION
That the Ottawa Police Services Board receive this report for information.
BACKGROUND
The process for dealing with police complaints (public and chief’s) regarding the Ottawa Police Service’s (OPS) policies, the delivery of service, and officer conduct is outlined in Part V of the Ontario Police Services Act, entitled “Complaints and Disciplinary Proceedings”.
The following report will provide comparisons in specific complaint types over those reported during the same time period for the previous year. The comparisons are an important tool used to track emerging trends and provide a glimpse at what types of complaints are being received. The statistics are charted by category and include cumulative numbers during the same time period for the previous year.
DISCUSSION
Highlights
The most valuable information is gleaned from the analysis of the reported statistics. As each category is provided it will include a statement with respect to the impact to the OPS.
Here are a few highlights:
· Overall complaints are slightly higher than the same time period in 2011 (6.7%), but are 6.2% lower than the five year average.
· Total public complaints decreased by 27.8% when compared to the same time period in 2011, and are 21% lower than the five year average.
· Excessive force complaints are 55% lower than the same time period last year.
Further details and statistical analysis are provided below under specific categories.
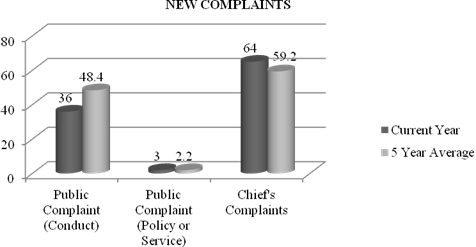
New Complaints
Complaints about policy, service or conduct are received from members of the public through the Office of the Independent Police Review Director (OIPRD) and may also be initiated internally as Chief’s complaints.
By the end of the first quarter of 2012, a total of 103 complaints were received representing an increase of 7 when compared to the same time period in 2011, and 6.8 fewer than the five year average.
There was a decline in both conduct (-14) and policy or service complaints (-1) filed by members of the public when compared to the first quarter of 2011; 23% lower than the five year average.
Chief’s complaints increased by 22 over 2011, however, when compared to the five year average there is only a slight increase of 4.8 complaints (8.1%). The increase in Chiefs complaints is due in part to motor vehicle collisions and red light infractions.
The following table outlines the number of new complaints received in Q1 compared to the same time period last year.
|
Table 1 New Complaints |
||||||
|
Q1 2012 |
2011 YTD |
2012 YTD |
5 YR AVG YTD |
|||
|
Public Complaint (Conduct) |
50 |
50 |
36 |
48.4 |
||
|
Public Complaint (Policy or Service) |
4 |
2 |
3 |
2.2 |
||
|
Chief's Complaints |
42 |
65 |
42 |
64 |
59.2 |
|
|
TOTAL |
96 |
103 |
96 |
103 |
109.8 |
|
|
|
||||||
Classification of Complaints
The Police Services Act provides the mechanism for dealing with complaints in relation to the conduct of an individual officer(s) and complaints related to the policies or services provided by the police service. The following tables provide the number of complaints received in Q1 in relation to the same time period in the previous year.
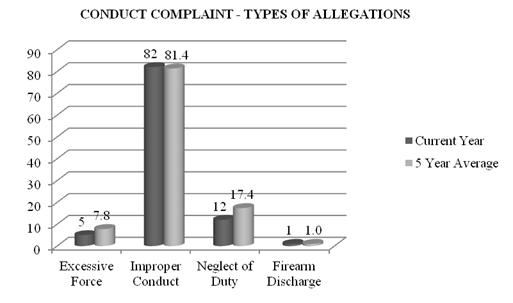
Conduct Complaints:
The category of ‘conduct complaints’ is broken down to reflect specific allegation types that are tracked.
As illustrated in Table 2 (below) Q1 2012 conduct complaints increased by 8 when compared to Q1 2011, however were 7.6 lower than the five year average of 107.6. Both excessive force and neglect of duty complaints decreased. While improper conduct complaints rose by 15 when compared to Q1 2011, they remain in line with the five year average. The review of these cases does not reveal an identifiable issue but will be followed closely over the next quarter. There was one firearm discharge which is consistent with the five year average.
|
Table 2 Conduct Complaints – Types of Allegations |
||||||
|
Q1 2011 |
Q1 2012 |
2011 YTD |
2012 YTD |
5 YR AVG YTD |
||
|
Excessive Force |
11 |
5 |
11 |
5 |
7.8 |
|
|
Improper Conduct |
67 |
82 |
67 |
82 |
81.4 |
|
|
Neglect of Duty |
14 |
12 |
14 |
12 |
17.4 |
|
|
Firearm Discharge |
0 |
1 |
0 |
1 |
1.0 |
|
|
TOTAL |
92 |
100 |
92 |
100 |
107.6 |
|
|
|
||||||
|
|
||||||
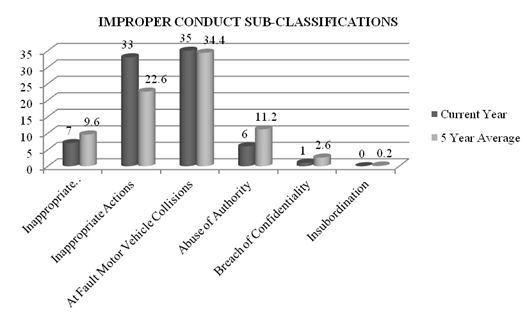
Improper conduct complaints form a significant portion of the complaints received. In 2008 this category was further divided into sub-classifications to better track what type of behaviour was generating complaints to assist in identifying trends, mitigating risk and responding fully to the concerns of the community.
Inappropriate comments/language (-2) and abuse of authority (-3) allegations declined slightly when compared to Q1 2011 and were lower than the five year averages. Two improper conduct sub-classifications increased when compared to Q1 2011 - inappropriate actions (12) and at fault motor vehicle collisions (8). Breach of confidentiality and insubordination allegations did not change from 2011 and remained somewhat lower than the five year averages.
|
Table 3 Improper Conduct Sub-classifications |
||||||
|
Q1 2011 |
Q1 2012 |
2011 YTD |
2012 YTD |
5 YR AVG YTD |
||
|
Inappropriate Comments/Language |
9 |
7 |
9 |
7 |
9.6 |
|
|
Inappropriate Actions |
21 |
33 |
21 |
33 |
22.6 |
|
|
At Fault Motor Vehicle Collisions |
27 |
35 |
27 |
35 |
34.4 |
|
|
Abuse of Authority |
9 |
6 |
9 |
6 |
11.2 |
|
|
Breach of Confidentiality |
1 |
1 |
1 |
1 |
2.6 |
|
|
Insubordination |
0.2 |
|||||
|
TOTAL |
67 |
82 |
67 |
82 |
80.6 |
|
|
|
||||||
Policy/Service Complaints:
There was one less policy/service complaints received in Q1 2012 when compared to Q1 2011, which is in line with the five year average.
This table distinguishes between policy complaints and those relating to service.
|
Table 4 Policy/Service Complaints* |
|||||
|
Q1 2011 |
Q1 2012 |
2011 YTD |
2012 YTD |
5 YR AVG YTD |
|
|
Policy |
1 |
1 |
0.2 |
||
|
Service |
4 |
1 |
4 |
2 |
2.0 |
|
TOTAL |
4 |
2 |
4 |
3 |
2.2 |
|
*in light of the fact that the number of complaints is minimal no chart has been created. |
|||||
Complaint Status
All public complaints are processed through the OIPRD and are evaluated based on provincial criteria. The OIPRD may choose not to have the matters investigated after a review of their merit by determining them to be: frivolous, vexatious, etc.; over six months; not directly affected.
Chief’s complaints are investigated to determine officer misconduct and compliance with OPS policy.
Both public and chief’s complaints can be finalized as substantiated or unsubstantiated. Once substantiated, they can be resolved through informal resolution, informal discipline or formal discipline.
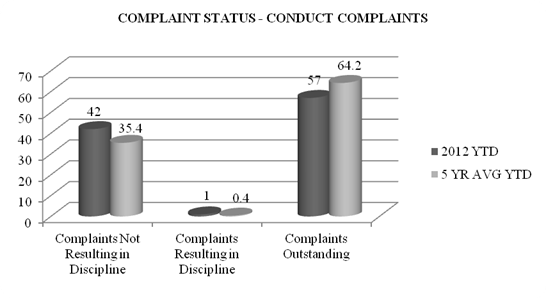
Conduct Complaint Status:
Of the 100 conduct complaints received in Q1 2012, 43 have been completed. Of those, 42 did not result in discipline including a total of 16 public complaints determined to be either frivolous, vexatious, etc. (4), over six months (1), or they did not identify any breach of the Police Services Act or its Code of Conduct (11) by OIPRD. Investigations remain ongoing in 57 complaints. One case resulted in informal discipline.
It should be noted that there were also two complaints received in previous years that resulted in informal discipline in Q1 2012.
There were three cases carried over from 2011 which were successfully resolved through the Voluntary Alternative Dispute Resolution Program (VADRP) in Q1 2012.
This table outlines the manner in which complaints have been resolved. The shaded areas reflect subtotals and total number of complaints.
|
Table 5 Complaint Status – Conduct Complaints |
|||||||
|
RESOLUTION |
Q1 2011 |
Q1 2012 |
2011 YTD |
2012 YTD |
5 YR AVG YTD |
CARRYOVER PRIOR YEARS* |
|
|
Unsubstantiated |
1 |
1 |
1.2 |
13 |
|||
|
Vexatious/Frivolous/Bad Faith |
16 |
4 |
16 |
4 |
9.6 |
||
|
Informal Resolution |
1 |
3 |
1 |
3 |
3.0 |
4 |
|
|
Informal Resolution – VADRP |
0.0 |
||||||
|
No Further Action |
20 |
32 |
20 |
32 |
21.4 |
14 |
|
|
Withdrawn by Complainant |
7 |
2 |
7 |
2 |
4.4 |
5 |
|
|
Withdrawn by Complainant - VADRP |
0.5 |
3 |
|||||
|
Over Six Months |
4 |
1 |
4 |
1 |
2.4 |
2 |
|
|
Third Party - Not Directly Affected |
1.0 |
||||||
|
Complaints Not Resulting in Discipline |
49 |
42 |
49 |
42 |
35.4 |
41 |
|
|
Informal Discipline |
1 |
1 |
0.4 |
2 |
|||
|
Disciplinary Hearing |
0.0 |
||||||
|
Complaints Resulting in Discipline |
0 |
1 |
0 |
1 |
0.4 |
2 |
|
|
Complaints Outstanding |
43 |
57 |
43 |
57 |
64.2 |
31 |
|
|
TOTAL |
92 |
100 |
92 |
100 |
100.0 |
74 |
|
|
*This column represents investigations commenced in previous years which are being dealt with in the current year |
|||||||
|
|
|||||||
|
2012 YTD |
|||||||
Policy/Service Complaint Status:
Of the three policy/service complaints received in Q1 one has been finalized with no action required and the remaining two are still under investigation.
This table outlines the complaints that have been resolved in Q1. The policy/service complaints completed in the quarter are attached to this report as Annex A.
|
Table 6 Complaint Status – Policy/Service Complaints |
||||||
|
RESOLUTION |
Q1 2011 |
Q1 2012 |
2011 YTD |
5 YR AVG YTD |
CARRYOVER PRIOR YEARS** |
|
|
No Further Action |
1 |
1 |
1 |
1 |
1.0 |
1 |
|
Frivolous, Vexatious, etc. |
2 |
0 |
2 |
0 |
0.4 |
0 |
|
Withdrawn by Complainant |
0 |
0 |
0 |
0 |
0.0 |
2 |
|
Withdrawn by Complainant VADRP |
0 |
0 |
0 |
0 |
0.0 |
1 |
|
Third Party |
0 |
0 |
0 |
0 |
0.0 |
0 |
|
Action Taken |
0 |
0 |
0 |
0 |
0.0 |
1 |
|
Complaints Outstanding |
1 |
1 |
1 |
2 |
0.8 |
0 |
|
TOTAL |
4 |
2 |
4 |
3 |
2.2 |
5 |
|
*In light of the fact that the number of complaints is minimal no chart has been created. |
||||||
|
**This column represents investigations commenced in previous years which are being dealt with in the current year. |
||||||
Special Investigations Unit (SIU) Investigations:
The Police Services Act provides that the SIU shall conduct criminal investigations into circumstances involving police and civilians that have resulted in serious injury or death and allegations of sexual assault.
While the number of SIU investigations received in Q1 2012 increased by two over the same time period in 2011, they are in line with the five year average of 2.6.
This table outlines the SIU investigations for the year. The Police Services Board receives a separate report on each SIU case.
|
Table 7 Special Investigations Unit Investigations |
|
TYPES OF INVESTIGATIONS |
Q1 2011 |
Q1 2012 |
2011 YTD |
2012 YTD |
5 YR AVG YTD |
|
Death |
1 |
1 |
0.6 |
||
|
Serious Bodily Injury |
1 |
2 |
1 |
2 |
2.0 |
|
Sexual Assault |
0.0 |
||||
|
TOTAL |
1 |
3 |
1 |
3 |
2.6 |
|
Investigations Resolved |
0 |
0 |
0 |
0 |
0.2 |
|
Investigations Ongoing |
1 |
3 |
1 |
3 |
2.4 |
|
TOTAL |
1 |
3 |
1 |
3 |
2.6 |
Public Complaint Reviews
The Police Services Act provides that complainants may seek a review of the Professional Standards Section decision on a conduct complaint by the OIPRD.
Complainants dissatisfied with the resolution of a policy/service complaint may seek a review by the Police Services Board.
Conduct Complaint Reviews:
During Q1 2012 three requests for review by OIPRD were received, one more than Q1 2011. All three remain under review by OIPRD.
The following table outlines the requests for review by OIPRD and how they were resolved. Please note that as OIPRD became the complaints oversight body in October 2009, no reviews were requested until 2010. A three year average is all that is available at this time.
|
Table 8 Requests for Review by OIPRD |
|||||
|
RESOLUTION |
Q1 2011 |
Q1 2012 |
2011 YTD |
2012 YTD |
3 YR AVG YTD |
|
Confirmed Decision |
0 |
0 |
0 |
0 |
0.0 |
|
Specified Direction |
0 |
0 |
0 |
0 |
0.0 |
|
Assigned to Outside Police Service |
0 |
0 |
0 |
0 |
0.0 |
|
OIPRD to Investigate |
0 |
0 |
0 |
0 |
0.0 |
|
Action to be Taken |
0 |
0 |
0 |
0 |
0.0 |
|
Reviews Pending |
2 |
3 |
2 |
3 |
1.7 |
|
TOTAL |
2 |
3 |
2 |
3 |
1.7 |
Policy/Service Complaint Reviews:
No requests for review of policy/service complaints were received by the Police Services Board in Q1.
CONCLUSION
The Professional Standards Section matters that require discipline are considered within the context of similar cases in the province and within the OPS. Formal Hearings held for serious misconduct, are conducted in accordance with ‘best practices’ in the province. The OPS supports the standardization of procedural hearing rules and has participated alongside other Ontario police agencies, defence and prosecutors to develop these guidelines.
Consideration of new legislation and its impact on OPS members, and conduct complaints remains a priority for OPS PSS and Legal as they work toward increasing public confidence through comprehensive complaint resolution. Voluntary alternative dispute resolution is offered in appropriate matters to better engage the complainant and the subject officer in a positive conversation to resolve differences.
Consistency and transparency in the investigation of public and Chief’s complaints will ensure a respectful relationship with the Ottawa Police Association and will support the ethical framework confirmed recently by the OPS.
(Original signed by)
Charles Bordeleau
Chief of Police
Attach. (1)