Document
2

Document
2
Transit Ridership Growth Plan
Prepared by the City of Ottawa

with
assistance from
Noxon Associates Limited

January 2006
1.2.1 Conventional and specialized transit
1.2.2 Initiatives and strategies
1.2.3 Action plan time horizons
1.3 Maintaining and updating the plan
Chapter 2: Present and future
context
2.2 Growth management strategy
2.3 Transit and transportation
2.3.4 Funding and implementing transit ridership growth initiatives
Chapter 3: Conventional transit
3.1 Initiative A — Growth management
3.1.1 Strategy A.1 — Official Plan
3.1.2 Strategy A.2 — Transportation Master Plan
3.2 Initiative B — Urban design and
site planning
3.2.1 Strategy B.1 — Community Design Plans
3.2.2 Strategy B.2 — Zoning by-law
3.2.3 Strategy B.3 — Development approval process
3.2.4 Strategy B.4 — Development around rapid transit stations
3.3 Initiative C — System capacity
3.3.1 Strategy C.1 — Bus rapid transit
3.3.2 Strategy C.2 — Light rail
3.3.3 Strategy C.3 — Park & Ride
3.3.4 Strategy C.4 — Fleet expansion
3.4 Initiative D — Service design and
delivery
3.4.1 Strategy D.1 — Service quality
3.4.2 Strategy D.2 — Route network
3.4.3 Strategy D.3 — Operations management
3.4.4 Strategy D.4 — Transit priority
3.4.5 Strategy D.5 — Interprovincial service
3.4.6 Strategy D.6 — Accessible service
3.4.7 Strategy D.7 — Intermodal connections
3.4.8 Strategy D.8 — Safety & security
3.4.9 Strategy D.9 — Fare technology
3.4.10 Strategy D.10 — Fare structures & levels
3.5 Initiative E — Marketing and
education
3.5.1 Strategy E.1 — Customer service, information & amenities
3.5.2 Strategy E.2 — Marketing programs & partnerships
3.5.3 Strategy E.3 — Promotion, outreach & education
3.5.4 Strategy E.4 — Market research
3.6 Performance measurement for
conventional transit
Chapter 4: Specialized transit
4.1 Initiative F — Specialized
transit
4.1.2 Strategy F.2 — Service standards
4.1.3 Strategy F.3 — Booking, scheduling & dispatching
4.2 Performance measurement for
specialized transit
Annex A. Details of strategies
Annex B. Official Plan –
Section 2.3.1, Transportation
Annex C. Transportation Master
Plan – Chapter 7, Public Transit
Introduction
This plan has been prepared for submission to the Province of Ontario’s
Ministry of Transportation, as a condition of the transfer of gas tax revenues
to the City of Ottawa for the purpose of expanding transit infrastructure and
services. It presents the various initiatives and strategies that the City will
implement to increase transit ridership over time, and is a summary of existing
plans, policies, programs and projects.
The major initiatives discussed in this plan, each of which is composed
of several distinct strategies, are:
An important feature of this plan is that while Initiatives A through E
nominally address conventional transit services, they include several strategies
that support the important role of conventional transit in serving the growing
demands of customers with disabilities. Readers interested in services for
customers with disabilities must therefore read the plan in its entirety.
Further to the Province of Ontario’s Guide
to Preparing a Transit Ridership Growth Plan, this plan presents
initiatives in the context of three distinct time frames, namely short term
(2009), medium term (about 2016) and long term (about 2021).
Present and future context
The City of Ottawa is home to about 850,000
people, the great majority of whom live in the urban area and are served by
public transit. The city’s transportation system is multimodal, with different
elements under local, provincial and federal government jurisdiction. Ottawa’s
conventional transit service (OC Transpo) operates an extensive rapid transit
system and surface route network with over 900 buses and three light rail
vehicles. Its specialized transit service (Para Transpo) uses a dedicated fleet
of 92 wheelchair-accessible vans and 37 full-size sedans, as well as 30 taxis,
to serve persons with disabilities.
Over the period from 2001 to 2021, Ottawa expects
population growth of almost 50% and employment growth of 56%. In response to
this dramatic predicted expansion, the City has developed a comprehensive
growth management strategy including an Official Plan to guide the community’s
physical development, and a Transportation Master Plan to guide the
implementation of multimodal transportation facilities and services.
Ottawa enjoys higher levels of conventional
transit usage than any North American city of its size, with a per-capita
ridership (almost 120 trips annually) greater than any Canadian city except
Toronto and Montreal. Ridership, service levels and fleet capacity have all
risen steadily since the mid-1990s. Over the same period, specialized transit
ridership has fluctuated around relatively constant levels.
In 2001, transit carried about 17% of motorized
person-trips in the weekday afternoon peak hour. A key objective of Ottawa’s
growth management strategy is to increase that figure to 30% by 2021, a level
which is more typical of European cities and implies that afternoon peak hour
transit passenger volumes would almost triple. Equivalent growth in annual
transit usage would yield about 240 million trips per year (about 210 trips per
capita) — requiring annual compounded growth of 6% from 2004 levels. This
transit ridership growth would not be spread evenly across the city, and some
transit corridors would experience relatively greater increases in ridership.
To achieve these ambitious goals, Ottawa’s
Transportation Master Plan identifies several “keys to success” — progressive
approaches to land use planning, comprehensive transportation demand management
(TDM) measures, optimization of operations to make the best possible use of
current infrastructure, and the timely addition of new infrastructure and
services. However, the City faces a considerable “funding gap” in its ability
to pay for these and other transit-related needs. Additional funding sources
will be required to enable the successful implementation of the measures
identified in this plan.
Conventional transit
Ottawa’s plan to increase conventional transit
ridership is described in five major initiatives, each of which includes
several strategies that are detailed in Annex A of this report.
Initiative A — Growth management includes
implementation and updating of the City’s Official Plan and Transportation
Master Plan policies including those that encourage compact and mixed-use
development throughout developing areas, and a stronger series of urban centres
to anchor the transit system.
Initiative B — Urban design & site planning includes efforts
to make new development or redevelopment projects more supportive of public
transit, such as:
Initiative C — System capacity includes efforts
to increase the ability of transit operations to carry substantial increases in
passenger volumes over time, such as:
Initiative D — Service design & delivery includes efforts
to make conventional transit services more effective, efficient, accessible,
safe and secure, such as:
Initiative E — Marketing & education includes efforts to
influence transit demand by understanding and engaging different segments of
the transit customer market, such as:
A comprehensive framework of performance measures
is proposed for monitoring the implementation and success of these conventional
transit initiatives.
Specialized transit
Ottawa’s plan to increase transit ridership by
customers with disabilities is partly described within the above Initiatives A
through E, and also within Initiative F
— Specialized transit. That initiative includes efforts to provide Para
Transpo service in response to the needs of customers with disabilities who,
for whatever reason, are unable to take advantage of the increasing
accessibility of conventional transit service. These efforts include:
A comprehensive framework of performance measures
is proposed for monitoring the implementation and success of these specialized
transit initiatives.
Summary
of key short-term actions recommended in this plan
§
Create a new zoning by-law that
reduces minimum parking requirements for some types of developments, sets
maximum parking limits near rapid transit
stations, and provides for mixed-use development in the vicinity of transit
stations
§
Build the West
Transitway from Pinecrest to Bayshore
§
Build the
North-South light rail corridor from downtown to Woodroffe Avenue
§
Build new Park
& Ride lots at Berrigan on the Southwest Transitway, and at Leitrim, River
Road and Woodroffe on the North-South light rail corridor
§
Restructure bus
routes to accompany new light rail and Transitway links
§
Install global
positioning systems (GPS) on buses to enable operational efficiencies and
improved customer service
§
Implement
transit priority measures in a number of key corridors
§
Undertake the
Interprovincial Transit Integration Environmental Assessment Study
§
Strengthen
safety and security programs
§
Implement a
smart card system for fare payment, including enhanced integration with STO
fares
§
Promote new and
expanded rapid transit services, and reach out through employers and schools to
build key transit markets
The contents of this
chapter are summarized briefly below:
§ Section 1.1 explains the plan’s rationale and objectives.
§ Section 1.2 provides an overview of the plan’s structure and contents.
§ Section 1.3 discusses how the plan will be maintained and updated in future.
In October 2004, the
Province of Ontario announced its intention to invest a portion of provincial
gas tax revenues (two cents a litre) in public transit. The goal of this
investment is to ensure that local public transportation ridership increases
through expansion of public transportation capital infrastructure and service
levels.
In order to continue
receiving gas tax funding, municipalities must develop a transit ridership
growth plan and have it approved by Council then submitted to the Ministry of
Transportation by March 31, 2006. Municipalities receiving gas tax funding are
also required to report annually to the province on how dedicated gas tax funds
are being used to build transit ridership.
The principal objectives
of this plan are to:
§
Identify and
explain the initiatives, strategies and actions that will support ridership
growth by improving the attractiveness, effectiveness and efficiency of transit
§
Demonstrate the
relationships and dependencies among different areas of activity
§
Summarize policies,
programs and projects to support transit ridership growth that have been
proposed previously (e.g. Official Plan, Transportation Master Plan, Ottawa
Rapid Transit Expansion Program, Transit Service and Fare Policy Manual)
§
Identify
performance measures that will provide a basis for future progress reports and
updates to this plan
In June 2005, the Ministry of Transportation of
Ontario (MTO) prepared a Guide to
Preparing a Transit Ridership Growth Plan, with the assistance of a working
group of representatives from federal, provincial and local governments as well
as non-governmental organizations. This plan has been developed with regard to
the Ministry’s valuable guidance, including the advice that transit ridership
growth plans should reflect the unique circumstances, needs and approaches of
each municipality. The following sub-sections discuss several structural
aspects of this plan.
This plan addresses both
conventional and specialized transit operations in the City of Ottawa, which
are provided respectively under the banners of OC Transpo and Para Transpo. The
bulk of this plan focuses on conventional transit services, a fact that
reflects the greatly different magnitudes of the two operations as well as the
reality that conventional services are expected to be the primary venue for
ridership growth by persons with disabilities. In combination with fare-based
incentives, improvements to the accessibility of conventional fleet, facilities
and services are expected to make OC Transpo the first choice of a growing
number of transit customers who would have relied previously on Para Transpo
services. Therefore, ridership growth per
se is not an inherent objective of Para Transpo operations, and success of
this plan would result in growth in the number of passenger trips taken by
customers with disabilities on the entire transit system.
For this reason, readers
interested in services for customers with disabilities must read the plan in
its entirety. Many issues related to accessible conventional transit service
are addressed within Chapter 3, and Para Transpo is addressed specifically
in Chapter 4.
The MTO’s Guide to Preparing a Transit Ridership
Growth Plan suggests a number of major initiatives that can support transit
ridership growth. Those suggestions have been adapted in this plan, which
addresses the following six major initiatives:
§
Initiative A — Growth management
§
Initiative B — Urban design & site planning
§
Initiative C — System capacity
§
Initiative D — Service design & delivery
§
Initiative E — Marketing & education
§
Initiative F — Specialized transit
Note: Pricing and
fare media, which were the subjects of a separate initiative suggested by the
Province’s Guide, are addressed in this plan within Initiative D — Service
design and delivery.
The following table lists the component strategies within each
initiative. Initiatives A through E relate to conventional transit and are
discussed in Chapter 3 of this plan, while Initiative F focuses on
specialized transit and is discussed in Chapter 4. Additional details of all
strategies are provided in Annex A.
Initiatives A through E are closely linked, and the figure below shows
that some initiatives are essential to the success of others. These
relationships, where applicable, are documented with other details of
individual strategies in Annex A.
|
Transit
ridership growth initiatives and strategies |
|||||
|
Initiative A — Growth management A.1 Official Plan A.2 Transportation Master Plan Initiative B — Urban design & site planning B.1 Community design plans B.2 Zoning by-law B.3 Development approval process B.4 Development around rapid transit stations Initiative C — System capacity C.1 Bus rapid transit C.2 Light rail C.3 Park & Ride
|
Initiative D — Service design & delivery D.1 Service quality D.2 Route network D.3 Operations management D.4 Transit priority D.5 Interprovincial service D.6 Accessible service D.7 Intermodal connections D.8 Safety & security D.9 Fare technology D.10 Fare structures & levels Initiative E — Marketing & education E.1 Customer service, information & amenities E.2 Marketing programs & partnerships E.3 Promotion, outreach & education E.4 Market research Initiative F — Specialized transit F.1 Fleet F.2 Service standards F.3 Booking, scheduling & dispatching F.4 Fares |
||||
|
Supportive relationships among conventional transit
initiatives |
|||||
MTO’s Guide to Preparing a Transit Ridership
Growth Plan suggests the application of three time frames (short, medium
and long) for setting transit ridership targets. This plan uses the following
time frames to identifying the actions and milestones associated with ridership
growth initiatives and strategies, using 2006 as a starting point:
§
Short term — 2009
(3 years)
§
Medium term — 2016
(or about 10 years), which coincides with the horizon of the City’s Long Range
Financial Plan (update under development, to be submitted to Council in 2006)
§
Long term — 2021
(or about 15 years), which coincides with the horizon of the City’s Official
Plan and Transportation Master Plan (although those plans rely primarily on
population thresholds to define time frames, rather than specific years)
It is envisioned that
future updates of this plan would continue to use a rolling three-year
short-term timeframe, and that the medium-term and long-term time frames would
continue to reflect the actual horizon years of the City’s Long Range Financial
Plan (which is typically updated every three years) and Official Plan (which is
typically updated every five years), respectively.
This Transit Ridership
Growth Plan will be updated on a regular basis. Updates may be required by the
Ministry of Transportation, or they may be initiated by the City to accurately
reflect changing circumstances and/or the future development of transit-related
plans, policies, programs and projects.
The contents of this
chapter are summarized briefly below:
§
Section 2.1 provides a brief overview of Ottawa and its transportation system.
§
Section 2.2 outlines the City’s long-term approach to managing the growth of the
community, and summarizes projections of future conditions that are relevant to
increasing transit ridership.
§
Section 2.3 summarizes key transit and transportation trends, related future
objectives, keys to success, and important implementation and funding
considerations.
The City of Ottawa is
home to about 850,000 people and covers about 2,760 square kilometres, of which
10% is urban land and the rest is rural. Across the Ottawa River in the
Province of Quebec, the City of Gatineau has a population of about 235,000
people. Ottawa-Gatineau is the fourth-largest metropolitan area in Canada after
Toronto, Montreal and Vancouver.
Three different levels
of government plan, design, build, operate and maintain transportation
facilities within Ottawa. The City owns and maintains the rapid transit system
and most of the road network, while major intercity Highways 416, 417 and 7 are
the responsibility of the Province of Ontario. Some of Ottawa’s transportation
infrastructure is under federal jurisdiction, including five interprovincial
road bridges as well as roads and multi-use pathways belonging to the National
Capital Commission. Within the city limits are found one international and
three general aviation airports, two passenger railway stations, an intercity
bus terminal, two ferries and a freight yard.
Ottawa’s extensive,
multimodal transportation system includes transit service and facilities
(on-road bus services, Transitway, O-Train, Park & Ride lots), walking and
cycling facilities (on-road cycling facilities, 1,500 km of sidewalks, and 300
km of multi-use pathways), roads (6,000 km of freeways, arterials, collector
and local roads), and parking facilities (with the City operating 15 off-street
public lots with 1,600 spaces, and 3,750 on-street parking meters, mostly in
and near downtown.)
The City of Ottawa’s
transit service, known as OC Transpo, has more than 910 standard and
articulated buses in active service. In addition to regular on-road bus
services, the City has an extensive rapid transit system including 30
kilometres of exclusive busways known as the Transitway, 12 kilometres of
freeway shoulder bus lanes, an eight-kilometre O-Train light rail line, and
eight urban Park & Ride lots with over 4,400 parking spaces. The City
operates a specialized transit service for persons with disabilities, known as
Para Transpo, that uses a fleet of 92 dedicated wheelchair-accessible vans, 37
dedicated full-size sedans, and 30 taxis. In 2005, 58% of OC Transpo’s
conventional transit fleet was comprised of fully accessible low-floor buses.
In 2001, City Council
initiated the Ottawa 20/20 initiative, a two-year process to help prepare for
growth over the coming decades. It strove to balance social, environmental and
economic issues in a way that will serve current residents while being
responsible to future generations. It incorporated several new growth
management plans (Official Plan, Economic Strategy, Human Services Plan, Arts
and Heritage Plan, Environmental Strategy, Corporate Strategic Plan) that
identify the City's long-term strategic directions and form a comprehensive
blueprint for the future of Ottawa.
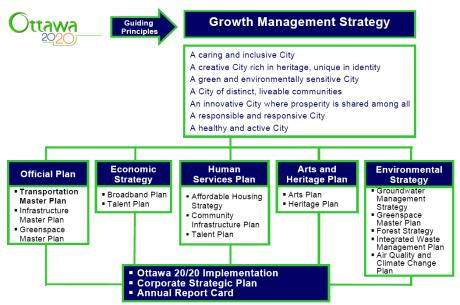
The
Official Plan directs Ottawa’s physical development through land use, community
design, transportation and infrastructure policies. It is supported by the
strategies, policies, programs and infrastructure elements recommended in three
master plans, namely the Transportation Master Plan (for multimodal
transportation services and facilities), Infrastructure Master Plan (for water,
wastewater and stormwater services) and Greenspace Master Plan (for the
protection, acquisition and management of greenspace). The figure below shows
how these plans relate to the other elements of the City’s growth management strategy.
The Transportation
Master Plan will help the City of Ottawa manage growing transportation demands
over the next two decades. It identifies transportation facilities and services
that the City intends to put in place by 2021 to support the development
pattern identified in the Official Plan, and to meet the travel needs of
residents and businesses. Its policies guide the operation of the City’s
day-to-day transportation programs, and provide a basis for capital and
operating budgets.
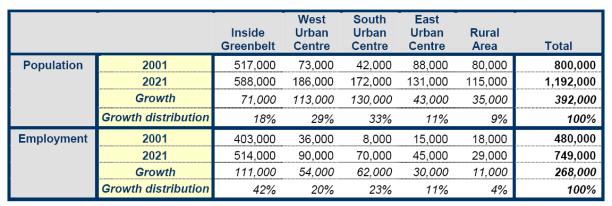
The City of Ottawa expects to see substantial
population and employment growth by 2021, with new residents and workers
placing considerable pressure on its transportation system.
The following figure shows that the city’s
population is projected to grow almost 50% from 2001 to 2021. Of the almost
400,000 new residents, 18% will live inside the Greenbelt while 73% will live
in urban areas outside the Greenbelt, and 9% will live in rural areas. The
number of jobs is projected to grow by about 270,000 or 56% from 2001 to 2021,
with 42% of new jobs located inside the Greenbelt, 54% in urban areas outside
the Greenbelt and 4% in rural areas.
Because of the aging population and a declining
number of people in the average Ottawa household, the number of households in
Ottawa is projected to increase by up to 60% between 2001 and 2021, including
many more seniors' households. This means that almost 190,000 new homes will
needed. About two-thirds of them will be outside the city's Greenbelt, where
fewer than half (about 40%) will be townhouses or apartments. About one-third
of new homes will be inside the Greenbelt, where most will be apartments.
Following are some key points that describe
recent transit and transportation trends in Ottawa. Many of these
characteristics are portrayed visually in nine charts on the three subsequent
pages.
§
Conventional transit service provided in 2004 was about 2.3 million service hours,
representing a ten-year increase of 9%. Actual service capacity has increased
by a greater margin, because the proportion of articulated buses in the fleet
has increased.
§
Conventional transit fleet size in 2005 was 685 standard and 227 articulated
buses, compared to 682 standard and 108 articulated buses in 1995. Fleet
carrying capacity (as measured in standard equivalents, where an articulated
bus represents 1.5 SE compared to 1.0 SE for a standard bus) was 1,026 SE in
2005, up 22% from 844 SE in 1995.
§
The average transit fare paid by riders was $1.235 in 2005, up 13% since 1995.
In real terms (i.e. accounting for inflation), over these ten years the average
fare actually declined by about 8%.
§
Total conventional transit ridership in 2005 was about 90 million linked trips or 25%
greater than in 1995, when ridership reached its lowest point in 20 years.
§
Per-capita conventional transit ridership in 2005 was about 118 trips per resident served —
more than all Canadian cities except Montreal and Toronto, and more than all
North American cities of a comparable size. This represents an increase of 4.4%
over the 1995 figure of 113 trips per resident served.
§
Conventional transit operating costs and revenues have both generally increased over the last 15
years, increasing 62% and 46% since 1990, respectively. The relatively greater
growth in costs has led to a falling revenue-cost ratio, from 58% in 1990 to
51% in 2004.
§
Specialized transit ridership in 2004 was just over 750,000 trips, which is
60% higher than it was in 1990. However, ridership levels have been relatively
unchanged since 1994 with the exception of 2001, when there was a lengthy
labour disruption.
§
Specialized transit operating costs and revenues have increased by 19% and 12%, respectively,
since 1995.
§
Person-trips by mode during weekday afternoon peak hours in 2001
totalled 250,000, and were divided among auto (74%), transit (15%), walking
(just under 10%) and cycling (just under 2%). Among all motorized person-trips,
the “modal splits” were 83% for auto and 17% for transit.


2.3.2 Future Objectives
In order to reflect its
growth management principles and support for the Official Plan’s desired land
use patterns, the City of Ottawa is planning to achieve the highest reasonable
level of future transit usage. During the Transportation Master Plan process a
30% transit modal split objective was set for the 2021 afternoon peak hour,
meaning that 30% of all motorized person-trips (i.e. those made by transit or
automobile) would be by transit and 70% would be by automobile.
A 30% transit modal split
target represents a real challenge — it almost doubles the estimated 2001 value
of 17%, likely exceeds current transit usage levels in virtually all large
metropolitan areas in Canada and the United States, and is comparable to the
levels realized in many transit-focused European cities. However, it can be
achieved if the required service strategies, transit priority measures, rapid
transit lines and a variety of essential supporting actions are implemented in
a comprehensive and coordinated fashion.
Achievement of the
transit modal split target would have a remarkable effect on total transit
ridership. Afternoon peak hour person-trips by transit would almost triple,
rising from 37,000 to 104,000. At the same time, afternoon peak-hour person
trips by auto would increase by just 30%.
These peak hour increases, if translated into equivalent growth in annual transit ridership, would yield 2021 targets of about 240 million linked transit trips per year (versus 85 million in 2001) and about 210 trips per capita annually (versus 119 in 2001). While these figures are speculative (since the growth in peak hour transit usage may well be greater than the growth in overall daily or annual usage) they do illustrate the magnitude of the additional transit service that is required. The required growth in annual transit ridership to meet the target of 240 million trips, starting from the 2004 ridership of 88.8 million trips, represents a compounded growth rate of 6% per year, as illustrated in the following figure.
The
dramatic targeted increase in transit modal split across Ottawa (i.e. from 17%
to 30%) would actually be exceeded by the increases required in some major
travel corridors. The following figure compares actual 2002 modal splits to
required 2021 modal splits at key screenlines, as determined through the
Transportation Master Plan process. (Note that screenlines are imaginary lines
drawn across major transportation facilities in a corridor, and typically
follow a feature that has limited crossing points, such as a river or railway.
A screenline or group of screenlines that effectively contain an area of
interest may also be referred to as a cordon.) It is notable that transit will be required to carry 50% of motorized
person-trips to and from Ottawa's Inner Urban Area (up from 29% in 2002), and
34% of trips across the Greenbelt (up from 17%) during the afternoon peak hour,
in the peak direction. The 2021 screenline values generally exceed the 30%
city-wide objective because screenlines tend to capture radial travel demands —
that is, trips from the urban core to outlying areas — and higher-quality
transit service can be provided for these trips than for those that move
peripherally (i.e. from suburb to suburb).
|
Screenline* |
Transit Modal Split |
|
|
2002 |
2021 |
|
|
Rideau River |
28% |
50% |
|
CPR |
30% |
49% |
|
Total: Inner Area Cordon |
29% |
50% |
|
Green’s Creek |
33% |
41% |
|
417 East (2000) |
0% |
0% |
|
Leitrim |
1% |
32% |
|
Fallowfield |
9% |
31% |
|
Eagleson |
15% |
38% |
|
Total: Greenbelt Cordon |
17% |
34% |
|
Interprovincial** |
16% |
36% |
|
CNR West |
15% |
36% |
|
CNR East |
18% |
41% |
|
Western Parkway (1996) |
15% |
41% |
|
Terry Fox (1996) |
3% |
34% |
|
Rideau South |
6% |
25% |
|
Bilberry Creek (1996) |
20% |
35% |
|
Smyth / Hydro
(2001) |
29% |
43% |
|
|
||
* All 2002 data shown correspond to actual 2002 counts
unless otherwise noted
** Interprovincial screenline projections are preliminary
estimates subject to refinement through future work with the City of Gatineau
and the National Capital Commission
Ottawa’s Transportation Master Plan outlines four key strategic
directions in which the City must take deliberate and timely action if it is to
achieve its transportation objectives:
§
Land use planning. Ottawa’s Official Plan recognizes the fact that
urban land use and transportation systems strongly influence each other. It
emphasizes compact, integrated land uses to encourage a shift from automobile
travel to public transit, walking and cycling. Land use strategies that support
transit use can be applied at several planning levels, from the city as a whole
to smaller communities and individual sites. Achieving a 30% peak hour transit
modal split by 2021 will require careful coordination of land use and
transportation initiatives, and the adoption of appropriate and complementary
strategies at each level. Mixed-use development nodes, increased densities, and
pedestrian-supportive neighbourhood and streetscape design can make transit a
more attractive choice for peak period travel.
§
Transportation demand management (TDM). TDM is essential to reducing automobile
dependence and the need for new or wider roads. It can help to reduce
congestion and pollution, while improving access to opportunity and community
livability. A main focus of TDM is on minimizing peak hour automobile travel by
encouraging individuals to reduce the number of trips they make, to travel more
often by non-driving alternatives, to travel outside peak periods, and to
reduce the length of their trips. TDM measures work by making alternatives to
driving more attractive, building a positive public attitude towards those
alternatives, and providing information and incentives that encourage
responsible travel behaviours. The City will implement a comprehensive TDM
program, leading by example as well as implementing outreach strategies that
encourage action by others.
§
Transportation supply management. The City will implement a wide range of
strategies to make the best use of its facilities, networks and services, in
order to maximize their people-moving capacity and to reduce operating costs.
The financial resources required to add extensive new facilities may not be
available when required, so transportation systems must be carefully managed to
prevent unacceptable and unpredictable trends in congestion, safety and
individual travel choices. Relatively minor actions that resolve localized
barriers and bottlenecks can have a large benefit for the overall system.
Transit priority measures are one example of the kind of proactive effort that
can extract the greatest possible efficiency from today’s system, helping to
achieve modal shift objectives, minimize the costs of congestion, and preserve
public health.
§
New infrastructure and services. The provision of new infrastructure and services
is a vital step toward the City’s transportation objectives. Transportation
system expansion can be costly, time-consuming and disruptive, but it is a
necessary complement to land use planning, transportation demand management and
transportation supply management efforts. The timely addition of infrastructure
and services as the City grows can encourage desired modal shifts and prevent
unacceptable levels of congestion.
The initiatives and strategies contained in this Transit Ridership Growth
Plan will be implemented over time with funds allocated through the City of
Ottawa’s capital and operating budgets. Many of the long-term measures called
for in this plan are reflected in the City’s Transportation Master Plan, which
also contains estimated costs for major transit capital works (e.g. rapid
transit facilities, fleet) and transit operations, as summarized in the
following table.
|
Future public transit costs
estimated in Transportation Master Plan (2003-2021, $ millions) |
||
|
Cost element |
Total cost (revenue) |
Average annual cost |
|
Operating costs |
|
|
|
Operating and maintenance costs |
5,572 |
|
|
Fare revenues |
(3,390) |
|
|
Net operating and maintenance costs |
2,182 |
121 |
|
Capital costs |
|
|
|
Transitway and light rail construction |
2,555 |
|
|
Fleet expansion — Light rail |
630 |
|
|
Fleet expansion — Buses |
810 |
|
|
Light rail maintenance and control
facilities |
100 |
|
|
Bus maintenance facilities |
280 |
|
|
Park & Ride lots |
50 |
|
|
Total capital costs |
4,425 |
246 |
It
is also important to note that the 2021 long-term time horizon envisioned in
this plan represents only an estimate of the actual time when the population
and employment growth estimates of the City’s Official Plan may be realized.
Growth that is slower than expected would mean a general deferral of services
and facilities needed to support the long-term horizon — and similarly, growth
that is faster than expected would mean those needs arrive sooner than 2021.
The Transportation
Master Plan confirmed a substantial "funding gap" in the City's
future ability to pay for capital projects, including the transportation
projects recommended in that plan. It also confirmed that the City's ability to
pay for different projects will influence their relative priorities and rate of
implementation. While federal and provincial gas tax transfers and
infrastructure grants will help to partly overcome the funding gap for
transportation capital projects, they are unlikely to eliminate it completely.
On the operating side, even with the provincial gas tax transfer being eligible
to contribute to the cost of service expansions, it is uncertain whether the
property tax base will be sufficient to pay for the dramatic increase in
transit service levels that is required.
Failure to locate
resources that overcome this funding gap, such as from federal and provincial
governments, will require the consideration of measures including program
cutbacks, adjustments in standards and service levels, deferral of
infrastructure, constraints on growth, user fees or tax rate increases. The
annual budget process will remain the City's principal forum for deciding how
to spend available capital and operating funds.
The contents of this
chapter are summarized briefly below:
§
Section 3.1 provides an overview of Initiative A — Growth management.
§
Section 3.2 provides an overview of Initiative B — Urban design & site planning.
§
Section 3.3 provides an overview of Initiative C — System capacity.
§
Section 3.4 provides an overview of Initiative D — Service design & delivery.
§
Section 3.5 provides an overview of Initiative E — Marketing & education.
§
Section 3.6 outlines a performance measurement strategy for conventional transit.
The text in this chapter
provides a brief overview of the component strategies within each of the above
initiatives. Readers seeking more information may refer to Annex A where
additional details for each strategy are given in tabular format, using the
following headings:
§
Rationale
§
Description
§
Supporting
references
§
Actions for short
term, medium term and long term horizons
§
Milestones
§
Resources (where
information is available and transit-specific)
§
Supporting
strategies
§
Performance
indicators
 This initiative represents the policy framework
discussed earlier in Section 2.2, with a specific focus on the City’s Official
Plan and Transportation Master Plan. Those two plans set key goals related to
transit ridership growth, and outline the land use and transportation measures
required to achieve those goals. As illustrated in the figure on the right,
this initiative also supports and enhances Initiative B — Urban design &
site planning, Initiative C — System capacity, and Initiative D — Service
design & delivery.
This initiative represents the policy framework
discussed earlier in Section 2.2, with a specific focus on the City’s Official
Plan and Transportation Master Plan. Those two plans set key goals related to
transit ridership growth, and outline the land use and transportation measures
required to achieve those goals. As illustrated in the figure on the right,
this initiative also supports and enhances Initiative B — Urban design &
site planning, Initiative C — System capacity, and Initiative D — Service
design & delivery.
This
initiative includes two component strategies, which are summarized in the
following paragraphs. Readers may refer to Annex A for additional details.
As discussed in Section
2.2.1, Ottawa’s Official Plan directs Ottawa’s physical development through
land use, community design, transportation and infrastructure policies. It is
one of the growth management plans that identify the City's long-term strategic
directions, and is supported by the Transportation Master Plan. The Official
Plan identifies the growth boundary within which all urban development will be
contained through 2021, the location of major types of development within the
urban area, and the desired characteristics of that development. It identifies
the locations of future rapid transit and transit priority corridors to enable
the protection of required rights-of-way. It also sets a 30% afternoon peak
hour transit modal split target for 2021, and specifies the need for other
transit-supportive actions like pedestrian facility improvements and
transportation demand management measures.
The action plan for this strategy includes
updating the Official Plan to define and protect future rapid transit corridors
upon completion of Environmental Assessment projects, reviewing the urban land
requirement by 2008 based on an assumption of greater intensification in the urban
area, and reviewing the need to update the Official Plan by 2008. The plan will
continue to have substantial influence on transit ridership growth through the
ongoing implementation of its policies that guide the location and nature of
urban development to be as transit-supportive as possible, set a long-term 30%
peak hour transit modal split target, and define the location of rapid transit
and transit priority corridors.
As discussed in Section 2.2.1, Ottawa’s Transportation
Master Plan identifies transportation facilities and services that the City
intends to put in place by 2021 to support the development pattern identified
in the Official Plan, and to meet the travel needs of residents and businesses.
Its policies guide the operation of the City’s day-to-day transportation
programs, and provide a basis for capital and operating budgets.
The action plan for this strategy includes
updating transit infrastructure requirements based on results of the 2005
Origin-Destination Survey, and reviewing the need to update the Transportation
Master Plan by 2008 in conjunction with a similar review of the Official Plan.
The Transportation Master Plan will continue to have substantial influence on
transit ridership growth through the ongoing implementation of its recommended
policies, programs and projects including long-range targets for increasing
transit ridership, the identification of an overall transit service strategy,
and guidance regarding rapid transit and transit priority facilities, Park
& Ride lots, service for customers with disabilities, fleet expansion,
safety and security, and transportation demand management.
 Initiative
B — Urban
design and site planning
Initiative
B — Urban
design and site planningThis initiative represents efforts to make new development or
redevelopment projects more supportive of public transit. These efforts include
the development of area plans, the application of regulatory instruments, the
conduct of approval processes, and broader efforts to shape or reshape
development around key rapid transit nodes. As illustrated in the figure on the
right, this initiative also supports and enhances Initiative C — System
capacity, and Initiative D — Service design & delivery.
This initiative includes four component strategies, which are summarized
below. Readers may refer to Annex A for additional details on each strategy.
The Official Plan requires that Community Design
Plans be conducted as integrated and comprehensive design exercises to ensure
the optimal implementation of Official Plan policies and principles (e.g.
intensification, transit-friendly design) at the community scale in urban areas
where change is either actively occurring or desired (e.g. zones of greenfield
development or urban redevelopment). Community Design Plans may be adopted by
Official Plan amendment and identified in an annex of that plan, or may be
approved by City Council as policy documents. They will be undertaken over time
for designated areas including Town Centres and Mixed-Use Centres (where a
large potential for change exists), Mainstreets and Developing Communities.
The action plan for this strategy includes the
completion of several Community Design Plans each year to encourage
transit-supportive development in key areas, focusing
on greenfield areas, locations along rapid transit corridors (e.g. Nepean Town
Centre, Carling to Bayview along
North-South light rail corridor), and mainstreets.
Many important Official
Plan policies and principles are ultimately applied through the City’s zoning
by-law, which regulates physical development using both prescriptive and
permissive language. Since amalgamation in 2001, there have been 36 zoning
by-laws in force within Ottawa. Some of these existing zoning by-laws have
transit supportive provisions (e.g. parking supply caps near rapid transit
stations), while others do not. The City intends to create a new, unified
zoning by-law that incorporates transit-supportive elements of existing by-laws
and complements them with new provisions for important land use features.
The action plan for this strategy includes the
creation of a new zoning by-law for the City of Ottawa, and its submission to
Council for approval in 2006. The by-law will reduce minimum parking requirements
for some types of developments, set maximum parking limits near rapid transit
stations, and provide for mixed-use development in the vicinity of transit
stations.
Through subdivision and
site plan approval processes, the City is able to enforce policy and by-law
requirements affecting new development characteristics that impact on the
convenience, comfort and security of transit riders. The City can also
negotiate with developers to influence development characteristics that are not
explicitly addressed by policies or regulations. For example, through
subdivision approvals the City can ensure the application of Official Plan and
community design plan requirements such as overall net residential densities of
at least 29 units per hectare in new developing urban communities, and the
inclusion of road and pathway networks that ensure all development is within
400 metres of a transit stop. Through site plan approvals the City can ensure
the application of zoning by-law and other requirements such as direct
pedestrian routes from transit stops to the main door of developments. For
developments expected to have significant transportation impacts, a
Transportation Impact Study is required and must include transit elements.
The action plan for this strategy includes the
creation of development design guidelines to support transit and other
sustainable transportation modes, for application throughout the development
planning process.
Developments generate higher levels of transit
ridership when they are within convenient walking distance of rapid transit
service. Encouraging appropriate levels and forms of development around rapid
transit stations (and around entire corridors where rapid transit services run
in a shared road right-of-way) can be an effective ridership tool. Where
development does occur around rapid transit stations, the Official Plan
and community design plans require higher-density development to be nearest the
station, and direct and convenient
pedestrian access links to the station. They also allow parking requirements to
be reduced within 600 metres of stations. However, because several existing and
proposed Transitway and light rail stations are somewhat remote from existing
development, deliberate efforts may be required to attract development in those
areas.
The action plan for this strategy includes:
§
Development of
transit-oriented development (TOD) guidelines that identify appropriate land
use types, densities, arrangements,
features and amenities for new development nodes as well as infill development
near rapid transit service
§
Examination of site-specific
planning opportunities for development to support ridership transit through desirable land use types,
densities and other features once future
rapid transit station and corridor locations have been defined
 Initiative
C — System
capacity
Initiative
C — System
capacityThis initiative represents efforts to increase
the ability of Ottawa’s transit operations to carry the greatly increased
passenger volumes that would result from achievement of the transit objectives
discussed in Section 2.3.2. These efforts include major capital programs to
construct rapid transit facilities and acquire transit vehicles. As illustrated
in the figure on the right, this initiative also supports and enhances
Initiative D — Service design & delivery, and is in turn supported by that
initiative as well as several others.
This initiative includes four component strategies, which are summarized
below. Readers may refer to Annex A for additional details on each strategy.
Successful implementation of an expanded rapid transit network will be a
critical step toward achievement of
the City’s transit ridership objectives. The Transitway bus rapid transit system has
been the backbone of transit service in Ottawa for two decades, and now
comprises 30 km of exclusive
busways, 12 km of freeway shoulder lanes, 4.5 km of arterial bus lanes, 35
stations (including four major downtown bus stops) and eight Park & Ride
lots with over 4,400 parking spaces. Ottawa’s bus rapid transit system has spawned numerous
similar successes in major cities around the world, and will continue to be a major contributor to ridership
growth in the future.
The action plan for this strategy includes:
§
Development of 42 km of new exclusive or
semi-exclusive bus rapid transit corridors by 2021 (note that these facilities
are identified on Map 5 in Annex C of this report, and their staging across three
time horizons is addressed in detail in Annex A)
§
Improvements to capacity and service along the Central Area
Transitway in Ottawa’s downtown through operational changes to intersections,
modified station locations, upgraded amenities at stations and integration of
stations with adjacent buildings
§
Enhanced customer
comfort, security and convenience in bus rapid transit stations through
enhanced signage, seating and
heating, better accessibility for disabled persons, more convenience retail and
service uses, and improved taxi loading areas, passenger drop-off and pick-up
facilities, bicycle parking facilities, and pedestrian walkways
Note that the Interprovincial Transit
Integration Environmental Assessment Study (discussed under Strategy D.5 —
Interprovincial service) will also consider ways to better integrate rapid
transit services in Ottawa with those in Gatineau.
Successful
implementation of an expanded rapid transit network will be a critical step
toward achievement of the City’s transit ridership objectives. Ottawa’s light
rail transit strategy will complement the city’s bus rapid transit system. Some
light rail facilities will take advantage of existing rail infrastructure in
several key corridors, while others will require the use of new dedicated rail
rights-of-way or shared roadway rights-of-way. Future light rail facilities
will replace and greatly expand upon the current O-Train operation that has
successfully demonstrated the feasibility and attractiveness of rail transit in
the Ottawa context.
The action plan for this strategy includes:
§
Development of 110 km of new electrified light
rail lines by 2021 within existing rail corridors, exclusive rail rights-of
way, and shared road rights-of-way (note that these facilities are identified
on Map 5 in Annex C of this report, and their staging across three time
horizons is addressed in detail in Annex A)
§
Enhanced customer
comfort, security and convenience in light rail stations through enhanced signage, seating and heating, better
accessibility for disabled persons, more convenience retail and service uses,
and improved taxi loading areas, passenger drop-off and pick-up facilities,
bicycle parking facilities, and pedestrian walkways
Note that the Interprovincial Transit Integration
Environmental Assessment Study (discussed under Strategy D.5 — Interprovincial
service) will also consider ways to better integrate rapid transit services in
Ottawa with those in Gatineau.
Park & Ride lots allow travellers to reach transit service (typically
rapid transit) using their automobiles. It is principally intended for use by
residents of rural Ottawa or neighbouring municipalities, but is also used by
suburban residents for whom Park & Ride is more convenient than reaching
transit feeder or express routes on foot. There are eight existing park &
Ride lots (Baseline, Place d’Orleans, Greenboro, Eagleson, Fallowfield, Trim
Road, Telesat Court and Terry Fox) with over 4,400 spaces in total. Use of
these lots is free and on a first-come-first-served basis except at Baseline
station where a permit is required for use before 11:00 a.m. on weekday
mornings, and at Telesat Court where users must hold a Gold parking permit.
Gold parking permits are also sold to users of other Park & Ride lots
(except Terry Fox) to guarantee them a preferred parking space close to the
station platform.
The action plan for this strategy includes the
development of 14 new Park & Ride
lots adjacent to future rapid transit corridors (note that these facilities and their staging across three time horizons
are addressed in detail in Annex A).
In 2005, the City’s conventional transit fleet
included about 685 standard buses, 227 articulated buses, one small bus and
three diesel multiple-unit rail vehicles. Over time, the need to make a substantial
investment in an expanded fleet of buses and light rail vehicles will be driven
by service improvements including
expanded route networks and service frequencies, the development of an
electrified light rail system, and growing ridership demands. Expansion of the
transit fleet will be integrated with necessary fleet renewal activities, since current buses have an
expected lifespan of 18 years and virtually all will be replaced prior to 2021.
The action plan for this strategy
includes:
§
Acquisition of
sufficient new buses and light rail vehicles to provide desired service levels
to a growing number of transit passengers by 2021 (note that staging of these acquisitions across
three time horizons is addressed in detail in Annex A)
§
Commensurate
expansion of garage and maintenance facilities, including four new bus garages
as well as light rail storage and maintenance facilities for 110 light rail
vehicles by 2021
 Initiative
D — Service
design and delivery
Initiative
D — Service
design and deliveryThis initiative represents efforts to enhance the efficient and effective
delivery of transit service, given the basic elements of system capacity
discussed in Section 3.3, above. These wide-ranging efforts include the
distribution of service in time and space to meet demand, efficiency
improvements through technology, the integration of transit service with
neighbouring Gatineau, the optimization of access for customers with
disabilities and those transferring to or from other modes, the pursuit of
improved safety and security, and the management of fare systems through
technology and fiscal policy. As illustrated in the figure on the right,
this initiative also supports and enhances Initiative C — System capacity, and
is in turn supported by that initiative as well as several others.
This initiative includes
ten component strategies, which are summarized below. Readers may refer to
Annex A for additional details on each strategy.
The quality of
transit service, including characteristics such as service frequency, vehicle
loading levels, and the hours and areas in which service is offered, plays a
large role in the ability to attract new ridership. These aspects of transit
service are guided by the City of Ottawa’s Transit
Service and Fare Policy Manual, which identifies system management policies, financial performance
standards for service improvements or reductions, all‑day base route
network service standards and expansion policies, route design guidelines,
service hours and minimum frequencies for different route types, service
capacity standards governing passenger loading levels, and principles governing
services for festivals and major events. The manual also outlines the City’s
approach to consultation and approval as part of various service planning
activities, including the annual
transit operating budget and Transplan processes, quarterly schedule changes
and bi-weekly operations reviews.
The action plan for this strategy
includes:
§
Increasing service
frequency or vehicle capacity on routes with growing ridership in order to
sustain desired service levels, allow room for growth, and attract new users
§
Exploring
alternative delivery methods in areas where conventional services cannot
cost-effectively meet minimum ridership targets
The “spine” of current
OC Transpo service is the all-day base route network, including routes on rapid
transit facilities and major arterial roads, on which service is provided seven
days a week within an 800-metre walk of 95% of urban households. The overall system
includes Transitway and O‑Train
routes, main line routes, local routes, express routes, employment area routes,
and rural routes. The future addition of new rapid transit lines will offer the
opportunity to relocate services now operating in congested traffic
environments, and to have new stations act as service hubs where (in some
cases) none exist today. The annual Transplan consultation process gathers
public input on proposed major route changes through discussions with
Councillors, advertising, open houses, evaluation of comments, and
presentations to Transportation Committee.
The action plan for this strategy includes:
§
Expanding the
transit route network to serve ridership growth as the population expands and
the transit modal split rises, and to extend service to developing areas as
early as possible
§
Restructuring
routes in the downtown core to significantly reduce bus volumes on Albert and
Slater Streets by 2009 (for Phase 1 of the North-South LRT project) by
implementing a limited hub and spoke system, rerouting some 90-series rapid
transit routes to bypass downtown, and relocating some routes through downtown
§
Adjusting the
future route network by replacing some main line routes by rapid transit
services in adjacent corridors, focusing more local routes on light rail or
Transitway stations, and replacing some express routes with local routes
feeding light rail stations
Operations management is
an umbrella term for measures that make the most of OC Transpo resources (e.g.
vehicles, operators, fuel). More efficient transit operations can support ridership
growth in several ways. They can reduce
travel times for individual riders, enable constant headways with fewer
vehicles thus freeing up resources to improve or extend other services, and reduce operating costs thus permitting funds to be
reallocated. It is possible to improve the reliability of transit service through new
technologies such as vehicle location using global positioning systems for
service control and monitoring, as well as through other measures including
enhanced operator training and additional time points.
The action plan for this strategy
includes:
§
The installation of
GPS units on buses by 2006 to enable improved schedule adherence, more
efficient use of spare vehicles, faster response to schedule and headway
control issues, faster and more reliable data communications between transit
vehicles and central control, real-time route arrival information for waiting
customers outside downtown, improved scheduling, support for smartcard fare
systems, and automatic updating of electronic transfer-issuing machines
§
The installation of
transponders on all buses (except those nearing retirement) beginning in 2006
to enable greater expansion of transit signal priority measures and real-time
route arrival information for waiting customers at downtown Transitway stops
Over 85% of Ottawa’s transit
service is delivered on roads, where traffic congestion increases delay and
reduces reliability. Transit priority measures can make transit operations
faster and more reliable, and free up resources to save money or improve
service elsewhere. They can enable improved on‑time performance on wider
headway routes, and constant headways on high-frequency services with fewer
vehicles. Physical or operational measures that are used in Ottawa to give transit
vehicles priority over others include: curb-side bus lanes on arterial roads, shoulder bus lanes on freeways,
traffic signal priority, transit priority signal indicators, advance stop bars,
transit-only left turns from curb lanes, bus-only interchange connections, and
remote “demand for service” indicators.
The action plan for this strategy
includes:
§
Implementing a
transit priority network by 2021, both where transit priority measures will
remain indefinitely and where they represent an interim measure in the
development of rapid transit lines (note
that these facilities are identified on Map 4 in Annex C of this report, and
their staging across three time horizons is addressed in detail in Annex A)
§
Undertaking three
operational studies in major transit priority corridors by 2009, followed by
implementation of recommended measures
§
Implementing
transit priority measures as part of roadway or intersection modifications,
over time and as appropriate, but especially on or near the Transitway
§
Undertaking
enabling measures including the installation of transponders on all buses (to
begin in 2006), the modification of traffic controller and traffic system
software, and the installation of remote traffic cameras at several key
locations
Ottawa and Gatineau have independent transit systems, but strive to optimize their collective services and
maximize transit ridership across the Ottawa River. OC Transpo and STO
serve major downtown destinations in the other’s territory, and maintain an ongoing dialogue to raise and resolve
issues. Their fare structures, levels and media are distinct but integrated,
and transfers from one service to the other are either low-cost or free. There are no
dedicated rapid transit links between Ottawa and Gatineau, although there are
reserved bus lanes on the Portage Bridge.
The action plan for this strategy includes:
§
Undertaking the
Interprovincial Transit Integration Environmental Assessment Study, in
partnership with the National Capital Commission, City of Gatineau and others,
to examine ways of improving transit integration between Gatineau and Ottawa
§
Implementing a
smart card fare system (see Strategy D.9 — Fare technology) that will enable
transit riders to use STO and OC Transpo smart cards on both systems, making
transit use on both sides of the Ottawa River easier for all users
§
Enhancing the
automated OC Transpo Travel Planner by incorporating STO route data, to help
customers plan interprovincial trips on both systems
Removing barriers to the use of conventional
transit services by persons with disabilities will enhance their lives, and is
more cost-efficient than providing specialized transit to meet growing demands
as Ottawa’s
population ages. The Accessibility for
Ontarians with Disabilities Act also requires municipalities and transit
systems to identify, remove and
prevent barriers to persons with disabilities. Ottawa’s Transitway and O-Train stations are
accessible to persons with disabilities, 58% of its bus fleet is composed of low-floor accessible buses, and 83% of passenger
shelters are accessible. The City employs
an Accessible Transit Specialist, works with an Accessibility Advisory
Committee, provides travel training to seniors and persons with disabilities,
promotes customer and operator awareness and sensitivity, and offers customer
information in accessible formats. In 2006, a one-year pilot project will
offer a reduced-cost monthly pass (the Community Pass) to people receiving
income support from the Ontario Disability Support Program (ODSP), coincident
with the termination of free conventional transit fares for customers who use a
wheelchair, scooter or walker.
The action plan for this strategy includes:
§
Acquiring only
low-floor buses and light rail vehicles, so that by 2015 all vehicles in
operation will be low-floor
§
Assigning low-floor
buses to routes and trips where they will be of greatest use to disabled
passengers, until the fleet is 100% accessible
§
Expanding travel
training and community outreach for seniors and persons with disabilities
§
Implementing
automated next-stop announcements and displays on transit vehicles by 2009
§
Upgrading
inaccessible passenger shelters by 2009 so that they are all accessible except
where precluded by property or utility constraints
§
Offering
voice-based automated travel planning after 2009
Many transit users transfer to and from other modes as part of their trips. They benefit from convenient and
comfortable intermodal connections including pathways and sidewalks that link
communities to bus stops, bike parking at rapid transit stations and bike racks
on buses (Rack & Roll), Park & Ride lots and passenger drop-off/pick-up
zones at rapid transit stations, taxi loading zones at rapid transit stations,
and a communication service to arrange night-time taxi pick-ups at rapid
transit stations. Transitway services offer convenient access to two intercity
rail stations and Ottawa’s international airport, and the main intercity bus
terminal receives frequent service on the base route network. Intercity and
intermunicipal bus operators enjoy permission to use Transitway facilities, and
shared fare agreements with private intermunicipal carriers provide their
customers with inexpensive access to OC Transpo.
The action plan for this strategy includes:
§
Improving
pedestrian access routes to rapid transit stations
§
Selectively
expanding the Rack & Roll program to additional bus routes
§
Initiating a
Greyhound stop at the new Terry Fox Transitway station, for routes between
Ottawa and points west
§
Building a light rail
link to the Ottawa International Airport by 2016 (see Strategy C.2 — Light
rail)
The individual perception of safety or security risks can be a critical factor in individual travel decisions. OC Transpo
has an excellent safety record, and has a comprehensive approach to maximizing the safety and security of transit
passengers and other members of the public. Current activities include patrols
by Transit Law Enforcement Officers, enforcement blitzes, operator training in
conflict avoidance and resolution, attendance at community forums and public
meetings, visits to local schools, rapid transit station design reviews and
safety audits, video monitoring at some stations, planning for expanded video
monitoring on buses, and public awareness campaigns. Other customer
information and services include security
phones and direct-call payphone buttons in all rapid transit stations, a Night
Stop program at Transitway stations and flexible night-time stop locations on
other routes, the TranSecure program through which OC Transpo staff is
encouraged to provide assistance to any member of the public in need, extensive
safety and security information on the OC Transpo website, and a reward program
for crime tips leading to convictions.
The action plan for this strategy includes:
§
Developing an
enhanced community-oriented approach to transit law enforcement
§
Equipping patrol
cars with wireless laptop technology to enhance communication
§
Expanding patrol
staff to extend foot patrols and enable zone coverage away from the rapid
transit system by 2009
§
Expanding video
monitoring and public address systems in rapid transit stations, starting
before 2009
§
Introducing
incident-based video camera coverage inside vehicles by 2009
Fare payment is an
integral part of each transit customer’s experience. Advanced technologies can
fundamentally change how users pay fares — minimizing uncertainty, maximizing
convenience and offering ways to make transit more affordable for certain users — with positive effects on
ridership. While OC Transpo relies largely on conventional fare media including paper
passes, tickets and cash, it has contemplated a smart card-based fare system
since the mid-1990s and plans are underway to implement a smart card fare
payment system by 2008. STO already
uses smart cards, and there are numerous benefits to having the fare systems of
both STO and OC Transpo on a common smart card platform. New fare categories
such as a “personal Ecopass” would be enabled without introducing significant
revenue protection risks, and electronic fare validation would reduce fraud, enable
convenient and economic fare collection on the light rail service, and improve
working conditions for operators. Concurrent implementation of a smart card
fare system and the “smart bus” system (see Strategy D.3 — Operations
management) would offer substantial economies through the shared use of
on-board computer processors.
The action plan for this strategy includes:
§
Implementing a
smart card fare system for monthly passes as well as employer and personal
Ecopasses in 2007, and for stored value cards (cash/ticket equivalent) in 2008
Fares primarily
serve to generate revenues that pay for transit operations, although fare
structures and levels can also be set to help attract and maintain riders. The
challenge in setting fare levels is to balance the need to generate revenue
against the desire to encourage greater ridership. While fares generated about
51% of OC Transpo operating costs in 2005, the City’s policy is to raise fares
above the rate of inflation until they generate at least 55% of costs. Fare
structures make pre-purchased fares more affordable: buying tickets is better
than cash, buying a pass is better
still, and buying an annual pass or holding an Ecopass is even better. In 2005,
cash fares (child or adult) generated almost 10% of revenues, tickets (child or
adult) generated almost 29% of revenues, and passes (several types for adults,
students and seniors) generated almost 62%. Imminent plans for 2006 are to
offer two
new pass categories, namely an annual adult pass and a student semester pass.
The action plan for this strategy includes:
§
Implementing new
pass categories in 2006, namely an annual adult pass and a semester pass for
post-secondary students
§
Investigating new
fare categories such as weekly passes and rolling 30-day passes after 2008,
once the initial phases of smart card implementation are complete
§
Holding average
fare increases to the rate of inflation once a 55% operating cost‑recovery
rate is achieved in 2008
 This initiative represents efforts to influence
transit demand through customer-oriented measures that complement and promote
the use of transit operations and facilities. These efforts include support and
information for customers, the enhancement of customer experiences through
programs and partnerships, the delivery of educational and promotional
campaigns, and research into the nature of transit markets. As illustrated in
the figure to the right, this initiative also supports and enhances Initiative
C — System capacity, and Initiative D — Service design & delivery.
This initiative represents efforts to influence
transit demand through customer-oriented measures that complement and promote
the use of transit operations and facilities. These efforts include support and
information for customers, the enhancement of customer experiences through
programs and partnerships, the delivery of educational and promotional
campaigns, and research into the nature of transit markets. As illustrated in
the figure to the right, this initiative also supports and enhances Initiative
C — System capacity, and Initiative D — Service design & delivery.
This initiative includes four component strategies, which are summarized
below. Readers may refer to Annex A for additional details on each strategy.
Quality customer service
is vital to public transit in Ottawa, due to the substantial proportion of
“choice” riders who have other travel options. Effective customer service and
information can help maximize ridership by meeting the needs of various
segments within the broader transit market, and offering riders quick, easy
access to relevant information at critical decision points. Primary transit markets (e.g. commuters, students,
seniors) can be divided into niche markets according to travel time (e.g. peak,
off-peak), travel frequency (e.g. regular, occasional) and trip origin
(e.g. neighbourhood) and destination (e.g. workplace, campus, special
event).
The current customer
service program includes: four major sales and information centres; telephone
and Internet access to staff for information, suggestions, compliments and
complaints; and operator training on courtesy and dealing with conflicts.
Elements of the customer information program that are either current or
imminent include: the OC Transpo website (3.5 million visits in 2004);
customized travel planning via telephone, automated Travel Planner website
(4,000 daily users in 2004), email and wireless devices (imminent);
customer-care email advisories; automated bus schedules via the "560"
interactive voice response telephone system (12.1 million calls a year);
location-specific and customized information displays; and publications
including a system map, route maps and timetables, brochures, and other
publications specific to neighbourhoods, destinations, special events and
customer programs such as Park & Ride or accessibility.
The action plan for this strategy
includes:
§
Identifying additional niche
markets and developing targeted services or information products to increase
ridership.
§
Offering kiosks in public locations that give
access to the automated Travel Planner website, after 2009.
Marketing programs
help to identify, understand, engage and influence individuals within various
transit markets. Partnerships help to leverage additional value from marketing
expenditures by extending reach, reducing costs, generating new revenues, or
increasing customer comfort and convenience. OC Transpo’s marketing programs
and partnerships include: fare and
system map sales through 400 vendors; information sharing with media; joint
promotions with partner organizations; charter operations; special service
sponsorship opportunities; convenience store operations in rapid transit
stations; newspaper box space rental; service and space sharing with intercity
transportation carriers; employer Ecopass administration; Gold Park & Ride
pass sales; DayPass sales to car dealers; pass protection plan sales; and Lost
& Found operation.
The action plan for this strategy includes:
§
Improving marketing
access to major customer groups, such as through partnerships with school
boards, universities and colleges, and VIA Rail
§
Expanding
derivative products (e.g. pass protection plans, partnerships with other
organizations, DayPass sales to car dealers) to improve customer convenience
and revenues
§
Investigating the
potential to improve customer convenience and revenues through video terminals
displaying news and advertising
§
Continuing to
explore opportunities for new or expanded marketing programs and partnerships
that can improve customer convenience and revenues
Promotion, outreach
and education measures (together with pricing and marketing initiatives) are examples of a transportation demand
management (TDM) philosophy — i.e. that a successful public transit system must
focus on increasing the demand for service, as well as the supply. These
measures can create a heightened awareness, understanding and public opinion of transit among potential customers that will
provide a foundation for increasing ridership over time. Education involves
measures to enhance individuals’ understanding of transit and its benefits to
them, their community and environment. Promotion involves measures to enhance
awareness of transit service and its key attributes, and to strengthen
transit’s “brand”, through means including advertising, sponsorships and
special events. Outreach involves the delivery of education and promotion
measures by proactively engaging individuals and groups, and partnering with
other organizations to reach their members or clients.
OC Transpo’s current
activities in these areas include: media
advertising and publicity to promote new services, or to promote existing
services to new markets; a program of school visits reaching 3,000 students annually; sponsorship or
participation in special events; attendance at trade and information shows;
travel training at schools, hospitals and community agencies; and the supply of
customized information packages and displays to members of niche transit
markets. The City’s TravelWise TDM program also actively supports transit through a suite of activities that
includes working with employers, educational institutions and community groups
to support transit and other sustainable travel modes.
The action plan for this strategy includes:
§
Promoting the introduction and expansion of light
rail service in several communities through advertising, media events, active
sales and publicity that emphasize light rail’s quiet, clean, convenient and
reliable service
§
Promoting expanded bus transit services in new
residential communities through advertising and publicity that emphasize
increased frequencies and reduced travel times
§
Promoting the cost advantage of transit over
automobile travel through advertising and publicity
§
Expanding efforts
to promote transit at large workplaces through the use of dedicated web pages,
presentations and displays
§
Expanding the
TravelWise TDM program to work more closely with employers and schools to
promote transit use
§
Promoting internal
environmental initiatives including the adoption of ultra-low-sulphur biodiesel
blend for bus propulsion, and the introduction of hybrid diesel-electric buses
Market research helps to identify and understand various elements of the
transit market, in order to guide the development of service or information products that can increase ridership.
The City currently conducts a telephone-based Attitude Survey of customers and
non-customers every two years, a city-wide Origin-Destination Survey every 10
years or so, and one-off count programs (e.g. Rack & Roll usage, Park
& Ride surveys) as required and as resources permit.
The action plan for this strategy
includes:
§
Continuing to
deliver the Attitude Survey every two years
§
Analyzing results
of the 2005 Origin-Destination Survey in a timely manner, and repeating the
survey by 2015
This section presents
the City’s approach to measuring performance in achieving this plan’s
objectives over time.
The success of a
long-range plan like this one relies on the ability and willingness to monitor
relevant conditions, actions and impacts. The City must remain aware of its
progress toward key objectives so that it can add, modify or delete priorities
as needed. A comprehensive approach to performance measurement should consider
three issues:
§
Outputs — Actions taken as part of this plan, whether to build facilities,
acquire vehicles, deliver service or inform and educate riders
§
Outcomes — Results arising from actions taken, also considering that other
factors may help determine such results
§
External conditions — Important factors having a direct or indirect
influence on either outputs or outcomes, or both
The following table summarizes performance
measures that the City will use to monitor and report on progress or trends
related to ridership growth in general, as well as conventional transit
Initiatives A through E. These include general measures that may address
the overall objective of each initiative, as well as measures that are proposed
in Annex A for specific component strategies.
|
Elements of
performance measurement program for conventional transit |
|
|
Ridership growth |
|
|
General |
§ Regular service passenger
trips per year § Regular service passenger
trips per service hour § Regular service passenger
trips per capita §
Ridership on bus rapid
transit and light rail facilities §
Transit modal split,
city-wide (determined about every 10 years) § Transit modal splits at key screenlines |
|
Initiative A — Growth management |
|
|
General |
§ Population and employment
levels § Change in population and
employment levels, by area |
|
A.1 Official Plan |
§
Densities of new
residential developments (greenfield and infill) § Job/household ratio in urban communities outside the
Greenbelt § Increase in dwelling units within Greenbelt |
|
A.2 Transportation Master Plan |
§
Transit modal split,
city-wide (determined about every 10 years) § Transit modal splits at key screenlines |
|
Initiative B — Urban design & site planning |
|
|
General |
§ N/A |
|
B.1 Community design plans |
§ Number of Community Design Plans completed annually
for Mixed-Use Centres, Developing Communities and Mainstreet areas |
|
B.2 Zoning by-law |
§ N/A |
|
B.3 Development approval process |
§ Provision of development features as directed by
development design guidelines (qualitative assessment) |
|
B.4 Development around rapid transit stations |
§ Amount of new development in vicinity of rapid
transit stations, by type |
|
Initiative C — System capacity |
|
|
General |
§
Regular service hours
(bus and light rail) §
Regular service hours
per capita (bus and light rail) §
Regular service
vehicle-kilometres (bus and light rail) |
|
C.1 Bus rapid transit |
§
Length of exclusive
busways, freeway shoulder lanes and arterial bus lanes |
|
C.2 Light rail |
§
Length of light rail
facilities in operation |
|
C.3 Park & Ride |
§
Average weekday
occupancy of Park & Ride spaces §
Number of Park &
Ride lots in operation §
Number of parking
spaces provided |
|
C.4 Fleet expansion |
§
Number of standard and
articulated buses and light rail cars in fleet §
Number of peak service
transit vehicles §
Number of peak service
standard equivalent buses §
Average age of buses
and light rail vehicles |
|
Initiative D — Service design & delivery |
|
|
General |
§ N/A |
|
D.1 Service quality |
§
On-time performance §
Average passengers per
vehicle §
Number of customer
trips affected by routes on which average ridership per vehicle exceeds
established service capacity standards |
|
D.2 Route network |
§ Success
rate in providing early service to developing communities |
|
D.3 Operations management |
§
Average operating
speed (vehicle-km per service hour) §
Percentage of
scheduled trips operated |
|
D.4 Transit priority |
§
Transit travel speed
increases in new transit priority corridors §
Transit travel time
reliability improvements in new transit priority corridors §
Transit priority
corridor studies completed § Number of implemented transit priority measures of
different types |
|
D.5 Interprovincial service |
§ Ridership on OC Transpo and STO interprovincial
routes |
|
D.6 Accessible service |
§
Proportion of
low-floor accessible buses in fleet § Proportion of passenger shelters that are accessible |
|
D.7 Intermodal connections |
§ Length of improved pedestrian access routes
implemented at rapid transit stations |
|
D.8 Safety & security |
§
Number
of Transit Law Enforcement Officers §
Number of rapid
transit stations with video monitoring and public address capability § Number of buses
with incident-based video monitoring |
|
D.9 Fare technology |
§ Proportion of fares paid
electronically § Rate of fare fraud |
|
D.10 Fare structures & levels |
§ Average fare § Proportion of total revenue
and trips by fare type (cash, ticket, pass) § Rate of operating cost-recovery from fares |
|
Initiative E — Marketing & education |
|
|
General |
§ Customer satisfaction, as
determined through surveys |
|
E.1 Customer service, information & amenities |
§
Annual customer calls § Annual website visits |
|
E.2 Marketing programs & partnerships |
§ Number of customers using an
Ecopass |
|
E.3 Promotion, outreach & education |
§ Non-user opinion of transit
system, as determined through surveys § Proportion of population using
transit at least once per year |
|
E.4 Market research |
§ Number of market research activities conducted |
Over the life of this
plan, the demand for accessible public transit service will grow. Ottawa’s
population of seniors is rising, and changes in health care will increasingly
enable (through medical advances) and even require (through a trend toward
outpatient treatment) persons with disabilities to lead fully independent
lives. As discussed in Section 1.2, the accessibility of Ottawa’s conventional
transit fleet, facilities and services is improving, and fare-based incentives
will encourage persons with disabilities to ride conventional (rather than
specialized) transit. OC Transpo, in fact, will be the primary venue for
transit ridership growth by persons with disabilities. For this reason, readers
interested in services for customers with disabilities should read the entire
plan with particular attention to Section 3.4, which addresses the enhancement
and promotion of accessible conventional transit services.
There will always be
transit customers whose disabilities prevent them from using conventional
transit for some or all of their trips — and they will be more numerous in
winter than summer, because of the obstacles posed by cold weather, ice and
snow. In addition, until the City’s bus fleet is entirely composed of low-floor
vehicles (around 2015), accessible conventional transit service will not always
be available in all locations and at all times of day. For these reasons, the
City will continue to provide its door-to-door specialized transit service,
Para Transpo. However, it must be emphasized again that this plan does not aim
to significantly increase specialized transit ridership — rather, it aims to
increase travel by customers with disabilities on the entire transit system.
This chapter contains
the following sections:
§
Section 4.1 provides an overview of Initiative F — Specialized transit
§
Section 4.2 outlines a performance measurement strategy for specialized transit
While Section 4.1
reviews the strategies within Initiative F, readers seeking more information
may refer to Annex A where additional details are given in tabular format,
using the following headings:
§
Rationale
§
Description
§
Supporting
references
§
Actions for short
term, medium term and long term horizons
§
Milestones
§
Resources (where
information is available and transit-specific)
§
Supporting
strategies
§
Performance
indicators
This initiative
represents key directions in Para Transpo service provision including the size
of fleet that is used to deliver the service, the standards that define the
nature of service provided and the eligible customer base, the trip booking,
scheduling and dispatching process, and fares.
This initiative includes
four component strategies, which are summarized below. Readers may refer to Annex
A for additional details on each strategy.
Specialized transit fleet requirements are a function of targeted Para
Transpo service levels. Fleet vehicles are owned and operated by two private
contractors, with the number of vehicles specified in the contracts. One
contractor operates the accessible van service using 92 dedicated
wheelchair-accessible vans, and also operates the sedan service using 37
dedicated full-size four-door sedans. A second contractor supplements this base
service using a fleet of about 30 non-accessible taxis.
The action plan for this strategy
includes:
§
Maintain Para
Transpo’s dedicated wheelchair-accessible van fleet at its current size,
complemented by increasing the accessibility and use of the conventional transit
fleet by persons with disabilities
§
Entering a new
contract for supplemental accessible and non-accessible taxi service in 2006,
which may increase the number of taxis used (mostly during winter months)
§
Deciding by 2007
whether to expand, maintain or reduce the current sedan service and fleet,
based on the cost-effectiveness of the new taxi service
Service availability (i.e. hours and areas served) and service levels are
major factors in determining the degree to which customers can rely on transit to meet their travel needs; Para Transpo serves
the entire City of Ottawa (a larger area than that served by conventional
transit), service hours are about the same as for conventional transit service,
and advertised service levels are based on a half-hour window for scheduled
customer pick-ups (about 95% of which occur within this window). Customer eligibility (which determines whether the
service is available to a given individual) is a key determinant of the number
of customers who wish to use the service, and in turn of the proportion of customer demand that can be met
with a fixed resource base; Para Transpo welcomes customers who have permanent or
short-term disabilities that prevent them from being able to use conventional transit service. Given these service
standards and available resources, Para Transpo (like most other specialized
transit services in Canada) cannot meet all customer demands, but is able to
accommodate about 95% of trip requests.
The action plan for this strategy includes:
§
Maintaining Para
Transpo’s service area, current customer eligibility terms and hours of service
(i.e. paralleling those of conventional transit service)
§
Making service
available within these service level parameters, based on the availability of
resources
Specialized transit services must respond to the customer demands that
appear on a day-to-day basis. Booking, scheduling and dispatching are the vital
links between customer requests and the actual delivery of service for about
700,000 Para Transpo trips each year. Customers with regular trips (i.e. on the same days and at the same times
each week, about 55% of demand) can pre-arrange regular bookings, and the
requested service is provided automatically each week without the customer
having to contact Para Transpo. Customers can book casual trips (45% of demand)
by contacting Para Transpo booking agents one day before service is required.
Para Transpo sends schedules directly to its dedicated van and sedan service
contractor, and sends individual trip requests that cannot be served by
dedicated vehicles in a cost-effective manner to the taxi service contractor,
who schedules and dispatches them to their Para Transpo taxi drivers. During
the day, service adjustments are made either by Para Transpo dispatchers or the
taxi contractor’s dispatcher.
The action plan for this strategy includes:
§
Improving the
efficiency and effectiveness of scheduling and dispatching by equipping all 92
dedicated wheelchair-accessible vans with on-board processors and GPS units
in 2006
Fares generate only a small portion of the revenue that pays for
specialized transit operations (about 7% in 2004), due to the customized and
highly passenger-focused service. However (unlike conventional transit fares),
specialized transit fares are not set with a certain cost-recovery goal in
mind. Rather, they are set on the basis of equity with conventional transit
users. Para Transpo fares
are based on the fare structure of conventional transit, but at a slightly
higher level — this is both in recognition of the premium nature of the
service, and to provide an incentive
for customers with disabilities to make conventional transit their first
choice, wherever and whenever possible. Para Transpo customers may pay fares with
cash or tickets (or a combination thereof), or with a pass (adult, student or senior; regular or
express; or Ecopass). In some cases, a small supplement in the form of either
cash or tickets is required. Registered Para Transpo users may ride the O-Train
at no charge. Rural fares are calculated based on origin and destination, with
the fare representing about 10% of the actual trip cost. It should be noted
that the implementation of smart card technology is not likely to be
cost-effective for specialized transit operations, but that other options to
make the payment of Para Transpo fares more flexible and convenient will be
explored.
The action plan for this strategy
includes:
§
Maintaining the
current relationship between Para Transpo and OC Transpo fares (for information
in expected fare changes, see Strategy D.10 – Fare structures and levels)
§
Investigating
options to make Para Transpo fare payment more flexible and convenient, in
parallel with the implementation of smart card technology in conventional
transit operations
§
Investigating new
Para Transpo fare categories to parallel any that are developed for
conventional transit operations (e.g. weekly passes, rolling 30-day passes)
The following table summarizes performance
measures that the City will use to monitor and report on progress or trends
related to specialized transit (Initiative F). These include general measures
that address the initiative’s overall objective, as well as measures that are
proposed in Annex A for specific component strategies.
|
Elements of performance
measurement program for specialized transit |
|
|
Initiative F — Specialized transit |
|
|
General |
§
Number of trips
carried by wheelchair-accessible vans, sedans and taxis §
Eligible customers
converting to conventional transit service (either partly or wholly) §
Customer satisfaction,
determined through surveys |
|
F.1 Fleet |
§
Number of fleet
vehicles, by type |
|
F.2 Service standards |
§
Service hours and days
of operation §
Call centre hours and
days of operation §
Proportion of
customers picked up within a scheduled 30-minute window |
|
F.3 Booking, scheduling & dispatching |
§
Vehicle-kilometres
per passenger §
Passenger
trips per hour §
Proportion of booking requests not accommodated |
|
F.4 Fares |
§
Rate of operating
cost-recovery from fares |
|
CONVENTIONAL TRANSIT |
||||||||
|
Initiative |
A. GROWTH MANAGEMENT |
|||||||
|
Strategy |
A.1 Official Plan |
|||||||
|
Rationale |
§
Sets
2021 city-wide transit mode split target of 30% of motorized person-trips in
the afternoon peak hour §
Compact
development and transit-friendly urban design allow more effective and
efficient transit service §
Concentrating
the right kinds of development (e.g. office employment) in transit corridors
and around transit nodes can build ridership §
Official
Plan gives direction to developers, staff and Council regarding the desired
location, density and form of development |
|||||||
|
Description |
Present situation §
Official
Plan policies identify urban area boundary (i.e. growth limit), areas
permitted for urban development, desired characteristics of urban
development. §
Official
Plan policies provide high-level direction to development design and approval
processes (e.g. desirable densities and design characteristics in locations
like transit nodes). §
Official
Plan policies and schedules identify corridors for rapid transit (e.g.
Transitway, light rail) and transit priority to enable right-of-way
protection. §
Other
Official Plan policies specify: - Other
aspects of transit service including the early provision of transit service
in developing communities, the development of transit priority measures, the
creation of Park & Ride lots, and the construction of improved pedestrian
accesses to rapid transit stations - Actions
for facilities and programs related to walking and therefore support transit
use - The
development of a transportation demand management program Future directions § Maintain
currency of Official Plan schedules with regard to defined rapid transit
corridor alignments § Review
urban area boundary § Review
need to update Official Plan by 2008 in accordance with Planning Act |
|||||||
|
Supporting references |
§
City
of Ottawa Official Plan (2003) |
|||||||
|
Action plan |
Short term (2009) |
Medium term (about 2016) |
Long term (about 2021) |
|||||
|
Actions |
§
Maintain
and implement Official Plan policies §
Update
Official Plan to show rapid transit corridors as “defined” upon completion of
relevant Environmental Assessments, to enable right-of-way protection for
Transitway or light rail infrastructure §
Review
urban area boundary, based on an assumption of greater
intensification |
§
Review
need to update Official Plan, as required |
§
Review
need to update Official Plan, as required |
|||||
|
Milestones |
§
2006
— New zoning by-law to implement Official Plan (see Strategy B.2 — Zoning
by-law) §
2008
— Review urban area boundary §
2008
— Review need to update Official Plan |
|||||||
|
Supporting strategies |
§
Strategy
A.2 — Transportation Master Plan |
|||||||
|
Performance indicators |
§
Densities
of new residential developments (greenfield and infill), versus greenfield
target of 29 dwelling units/hectare §
Job/household
ratio in urban communities outside the Greenbelt (versus 1.3 jobs/household
ratio used to designate lands) §
Increase in dwelling units within
Greenbelt |
|||||||
|
CONVENTIONAL
TRANSIT |
||||||||
|
Initiative |
A. GROWTH MANAGEMENT |
|||||||
|
Strategy |
A.2 Transportation
Master Plan |
|||||||
|
Rationale |
§
The
Transportation Master Plan (TMP) was developed through an integrated planning
process in conjunction with the Official Plan (see Strategy A.1 — Official
Plan), and guides the long-term development of Ottawa’s transportation system
in support of desired land use patterns. §
The
TMP provides a comprehensive multimodal transportation strategy that
integrates future infrastructure and services for public transit, walking,
cycling and auto travel |
|||||||
|
Description |
Present situation §
The
TMP identifies policies, priorities, programs and projects to achieve the
following 2021 city-wide targets: -
Transit mode split — 30% of motorized
person-trips in afternoon peak hour (vs. 17% in 2001) -
Walking
modal share — 10% of all person-trips in afternoon peak hour (vs. 9.7% in
2001) -
Cycling
modal share — 3% of all person-trips in afternoon peak hour (vs. 1.7% in
2001) §
The
TMP identifies: -
A
long-term transit priority network, rapid transit network, and urban and rural
road networks (with road classifications) -
Policy
and programs related to transportation system management, area traffic
management, goods movement, and intercity travel -
Strategies
for environmental protection, asset management and maintenance, and implementation
and monitoring §
Chapter
7 (Public Transit) of the TMP outlines a general transit service strategy, as
well as policies, programs and projects for serving customers with
disabilities, transit priority, rapid transit, fleet, and safety and security Future directions §
Review
and update transit infrastructure requirements based on results of the 2005
Origin-Destination Survey §
Review
need to update TMP in conjunction with review of need to update Official Plan
by 2008 (see Strategy A.1 — Official Plan) |
|||||||
|
Supporting references |
§
City
of Ottawa Transportation Master Plan (2003) |
|||||||
|
Action plan |
Short term (2009) |
Medium term (about 2016) |
Long term (about 2021) |
|||||
|
Actions |
§
Maintain
and implement TMP policies, programs and projects §
Review
and update transit infrastructure requirements based on results of the 2005
Origin-Destination Survey |
§
Review
need to update TMP, as required |
§
Review
need to update TMP, as required |
|||||
|
Milestones |
§
2008
— Review need to update TMP |
|||||||
|
Supporting strategies |
§
Strategy
A.1 — Official Plan |
|||||||
|
Performance indicators |
§
Transit
modal split, city-wide (determined about every 10 years) §
Transit
modal splits at key screenlines |
|||||||
|
CONVENTIONAL
TRANSIT |
||||||||
|
Initiative |
B. URBAN DESIGN &
SITE PLANNING |
|||||||
|
Strategy |
B.1 Community design
plans |
|||||||
|
Rationale |
§
Transit
ridership growth is significantly dependent on the successful implementation
of many Official Plan policies and principles, which are ultimately applied
through tools including zoning by-laws and subdivision processes. The
Official Plan recognizes that transit-supportive urban environments require
coordinated action in a wide range of areas; it is also true that transit
requirements sometimes conflict with other community needs and a rational
decision-making process is required to weigh competing interests. §
Therefore,
the Official Plan requires that Community Design Plans be conducted as
integrated and comprehensive design exercises to ensure the optimal
implementation of Official Plan policies and principles
(e.g. intensification, transit-friendly design) at the community scale,
in urban areas where change is either actively occurring or desired (e.g.
zones of greenfield development or urban redevelopment). |
|||||||
|
Description |
Present situation §
Community
design plans are required by the Official Plan (see OP Section 2.5.7). They
may be adopted by Official Plan amendment and identified in an annex of that
plan, or may be approved by City Council as policy documents. Future directions §
Community
design plans will be undertaken over time for designated areas including Town
Centres and Mixed-Use Centres (where a large potential for change exists),
Mainstreets and Developing Communities §
In
Mixed-Use Centres, community design plans will: - Facilitate
a transit-oriented development pattern having an intensity and mix of uses
that will increase ridership -
Lead to development that is close to streets, with
the highest densities (offices and other employment uses) closer to rapid
transit stations §
In
Developing Communities, community design plans establish land use densities
and key features including the road system to be used by bus transit routes. § In Mainstreet areas,
community design plans will identify transit-supportive strategies like
minimum development densities and ways to stimulate intensification, creation
of pedestrian-friendly environments, creation of maximum parking requirements
near quality transit service, physical integration of transit stops and
waiting areas with adjacent land uses. |
|||||||
|
Supporting references |
§
Official
Plan — Section 2.5.7 |
|||||||
|
Action plan |
Short term
(2009) |
Medium term
(about 2016) |
Long term
(about 2021) |
|||||
|
Actions |
§
Complete several Community Design Plans annually, focusing on
greenfield areas, key locations along rapid transit corridors
(e.g. Nepean Town Centre, and Carling to Bayview along North-South light
rail corridor), and mainstreets |
§
Complete several Community Design Plans annually |
§
Complete Community Design Plans for Developing Communities, as
required |
|||||
|
Milestones |
|
|||||||
|
Supporting strategies |
§
Strategy
A.1 — Official Plan |
|||||||
|
Performance indicators |
§
Number
of Community Design Plans completed annually for Mixed-Use Centres,
Developing Communities and Mainstreet areas |
|||||||
|
CONVENTIONAL
TRANSIT |
||||||||
|
Initiative |
B. URBAN DESIGN &
SITE PLANNING |
|||||||
|
Strategy |
B.2 Zoning by-law |
|||||||
|
Rationale |
§
Transit
ridership growth is significantly dependent on the successful implementation
of many Official Plan policies and principles, which are ultimately applied
through tools including the City’s zoning by-law that regulates physical
development using both prescriptive and permissive language. |
|||||||
|
Description |
Present situation §
Since
amalgamation in 2001, there have been 36 zoning by-laws in force within
Ottawa §
Some
existing by-laws have transit supportive provisions, e.g. parking supply caps
near rapid transit stations, no minimum parking requirements for some land
uses in the central business district, and permission for mixed-use
developments near rapid transit stations Future directions §
The
City intends to create a new, unified zoning by-law that incorporates
transit-supportive elements of existing by-laws and also makes new provisions
for: - Reduced
minimum parking requirements to better reflect policy objectives and move
away from traditional demand-based parking rates - Maximum
parking limits near rapid transit stations to encourage transit usage - Incentives
for the provision of transit facilities on private lands (e.g. bus waiting
areas at shopping centres) - Bicycle
parking facilities to accommodate an alternative transportation mode to the
motor vehicle - Reduced
required size of parking spaces, driveways and aisles to reduced amounts of
paved areas - Shared
parking facilities between complementary uses to reduce need for parking
space development - Encourage
telecommuting by continuing to permit home-based business to reduce number of
home-work trips - Permit
rapid transit service to locate in all areas of the City, to remove obstacles
to expansion of facilities -
Zone areas in the vicinity of transit stations
to allow or even require mixed-use development |
|||||||
|
Supporting references |
§
36
existing zoning by-laws |
|||||||
|
Action plan |
Short term
(2009) |
Medium term
(about 2016) |
Long term
(about 2021) |
|||||
|
Actions |
§
Create
new zoning by-law to provide support for public transit services, facilities
and ridership |
§
Maintain/amend
zoning by-law, as needed |
§
Maintain/amend
zoning by-law, as needed |
|||||
|
Milestones |
§
2006
— Adopt zoning by-law |
|||||||
|
Supporting strategies |
§
Strategy
A.1 — Official Plan |
|||||||
|
Performance indicators |
|
|||||||
|
CONVENTIONAL
TRANSIT |
||||||||
|
Initiative |
B. URBAN DESIGN &
SITE PLANNING |
|||||||
|
Strategy |
B.3 Development
approval process |
|||||||
|
Rationale |
§
Through
the subdivision and site plan approval processes, the City is able to enforce
policy and by-law requirements affecting new development characteristics
(e.g. nature, form and design) that can impact on the convenience,
comfort and security of transit riders. Through these processes, the City can
also negotiate with developers to influence development characteristics that
are not explicitly or precisely addressed through policy or regulation. |
|||||||
|
Description |
Present situation §
Transit
Services staff comment on circulated draft subdivision and site plans §
Through the subdivision approval process, the
City ensures the application of Official Plan and community design plan
requirements including: - New
developing urban communities must have an overall average net residential density
of at least 29 units per hectare - Subdivision
designs must include road or pathway networks that ensure all
lots/development are within 400 m of a transit stop §
Through the site plan approval process, the
City ensures the application of zoning by-law and other requirements
including: -
Site plans must ensure direct pedestrian access routes
from adjacent transit stops to the main door of the development §
For
developments expected to have significant transportation impacts, a
Transportation Impact Study is required and must include transit elements Future directions §
Creation
of development design guidelines to support transit and other sustainable
transportation modes, for application throughout the development planning
process |
|||||||
|
Supporting references |
|
|||||||
|
Action plan |
Short term
(2009) |
Medium term
(about 2016) |
Long term
(about 2021) |
|||||
|
Actions |
§
Create
development design guidelines, and accompany with education of staff and
industry stakeholders |
|
|
|||||
|
Milestones |
§
By
2009 — Creation of development design guidelines |
|||||||
|
Supporting strategies |
§
Strategy
A.1 — Official Plan §
Strategy
B.2 — Zoning by-law |
|||||||
|
Performance indicators |
§
Provision of development features as
directed by development design guidelines (qualitative assessment) |
|||||||
|
CONVENTIONAL
TRANSIT |
||||||||
|
Initiative |
B. URBAN DESIGN &
SITE PLANNING |
|||||||
|
Strategy |
B.4 Development
around rapid transit stations and corridors |
|||||||
|
Rationale |
§
Commercial,
residential and institutional developments within convenient walking distance
(about 600 metres) of rapid transit service tend to generate higher levels of
transit ridership than similar developments elsewhere. Encouraging
appropriate levels and forms of development around rapid transit stations
(and corridors, in the case of rapid transit services running in a shared
road right-of-way) can therefore be an effective ridership strategy. §
In
Ottawa, several Transitway and light rail stations (existing and proposed)
are located somewhat remotely from existing development concentrations.
Deliberate efforts may be needed to attract development in those areas.
§
The TMP notes that rapid transit stations are
excellent locations for employment land uses, but that poor planning of
surrounding land uses can limit the ability of transit passengers to get to
and from the station in safety, security and comfort. It also notes that
employer-provided free parking near rapid transit stations will jeopardize
the competitiveness of rapid transit. |
|||||||
|
Description |
Present situation §
The Official Plan and community design plans
require higher density development near rapid transit stations, as well as
direct and convenient pedestrian access between transit stations and adjacent
developments. Parking requirements may also be reduced within 600 metres of
stations. Future directions §
Develop plans and guidelines to encourage and
facilitate appropriate development around rapid transit stations and
corridors |
|||||||
|
Supporting references |
§
Official
Plan — Section 4.3 (Policies 3 and 4) |
|||||||
|
Action plan |
Short term
(2009) |
Medium term
(about 2016) |
Long term
(about 2021) |
|||||
|
Actions |
§
Develop general guidelines for
transit-oriented development (TOD) that identify appropriate land use types,
densities, arrangements, features and amenities for new development nodes as
well as infill development §
Once future rapid transit station and corridor
locations have been defined, study site-specific planning opportunities for
development to support ridership transit through desirable land use types,
minimum densities and other key features |
|
|
|||||
|
Milestones |
§
By
2009 — Development of transit-oriented development guidelines §
Starting
by 2009 — Study of site-specific planning opportunities to encourage transit
ridership at new light rail and Transitway stations |
|||||||
|
Supporting strategies |
§
Strategy
A.1 — Official Plan |
|||||||
|
Performance indicators |
§
Amount
of new development in vicinity of rapid transit stations, by type |
|||||||
|
CONVENTIONAL
TRANSIT |
||||||||
|
Initiative |
C. SYSTEM CAPACITY |
|||||||
|
Strategy |
C.1 Bus rapid transit |
|||||||
|
Rationale |
§
Successful implementation
of an expanded rapid transit network will be a critical step toward
achievement of the City’s transit ridership objectives. §
The
Transitway bus rapid transit system has been backbone of transit service in
Ottawa for two decades, and its success has spawned numerous similar systems
in major cities around the world. Bus rapid transit will continue to be a major
part of Ottawa’s transit service. |
|||||||
|
Description |
Present situation §
Ottawa’s
Transitway services operate on 30 km of exclusive busways, 12 km of freeway
shoulder lanes, 4.5 km of arterial bus lanes, and 3.3 km of parkway. It has
35 stations (including 4 downtown bus stops) and eight Park & Ride lots
with over 4,400 parking spaces. Future directions §
Section
7.5 of the TMP identifies policies to support the development of 42 km of new
exclusive or semi-exclusive bus rapid transit corridors by 2021 (along with
stations and Park & Ride lots) §
TMP
policies (Section 7.5.1) indicate that the City will improve capacity and
service along the Central Area Transitway (which operates on arterial streets
through Ottawa’s downtown) through operational changes to intersections,
modified station locations, upgraded amenities at stations and integration of
stations with adjacent buildings. §
TMP
policies (Section 7.5.2) address the City’s intentions to enhance the
comfort, security and convenience of rapid transit stations by: -
Improving signage, seating, heating,
accessibility for disabled persons -
Adding
convenience retail and service uses -
Improving
or adding taxi loading areas, passenger drop-off and pick-up facilities,
bicycle parking facilities, and pedestrian walkways §
Annex
A of the TMP identifies specific projects that comprise the bus rapid transit
strategy. §
Figure
14.1 of the TMP recommends bus rapid transit projects to be completed at each
of three population horizons: 975,000 (about 2008), 1,100,000 (about 2013)
and 1,200,000 (about 2021) (see Milestones, below). |
|||||||
|
Supporting references |
§
Official
Plan §
Transportation
Master Plan (TMP) §
Rapid
Transit Expansion Study (RTES) §
Ottawa
Rapid Transit Expansion Program (ORTEP) |
|||||||
|
Action plan |
Short term
(2009) |
Medium term
(about 2016) |
Long term
(about 2021) |
|||||
|
Actions |
§
Optimize
Central Area Transitway operations §
Implement
highest priority bus rapid transit additions |
§
Optimize
Central Area Transitway operations |
§
Optimize
Central Area Transitway operations |
|||||
|
Milestones |
§
Ongoing
work in the Albert/Slater corridor §
Hospital
link corridor (Innes/Blair to Blair Station) §
West
Transitway (Pinecrest Rd. to Bayshore Station) |
§
Ongoing
work in the Albert/Slater corridor §
East-West
corridor (Innes/Blair intersection to Trim Rd. — interim measure preceding
light rail transit) §
Southwest
Transitway (Fallowfield Rd. to Nepean Town Centre) §
West
Transitway (Eagleson Rd. to Terry Fox Station) |
§
Ongoing
work in the Albert/Slater corridor §
Baseline
corridor (Navaho Dr. to Data Centre Rd. — semi‑exclusive) §
East
Transitway (Place d’Orléans to Trim Rd.) §
Hospital
link corridor (Hurdman Station to hospital complex to Innes/Blair
intersection) §
Southwest
Transitway (Nepean Town Centre to Cambrian Dr.) §
West
Transitway (Woodroffe Ave. to Pinecrest Rd.; Terry Fox Station to Hazeldean
Rd. — semi‑exclusive) |
|||||
|
Resource requirements |
§
$42
million for engineering and construction |
§
$145
million for engineering and construction |
§
$375 million for engineering and construction |
|
Supporting strategies |
§
Strategy
A.1 — Official Plan §
Strategy
A.2 — Transportation Master Plan §
Strategy
B.4 — Development around rapid transit stations §
Strategy
C.2 — Light rail §
Strategy
C.3 — Park & Ride §
Strategy
C.4 — Fleet expansion §
Strategy
D.2 — Route network §
Strategy
D.3 — Operations management §
Strategy
D.4 — Transit priority §
Strategy
E.2 — Marketing programs & partnerships |
||
|
Performance indicators |
§
Length
of exclusive busways, freeway shoulder lanes and arterial bus lanes |
||
|
CONVENTIONAL TRANSIT |
|||||||
|
Initiative |
C. SYSTEM CAPACITY |
||||||
|
Strategy |
C.2 Light rail |
||||||
|
Rationale |
§
Successful
implementation of an expanded rapid transit network will be a critical step
toward achievement of the City’s transit ridership objectives. §
Light
rail transit offers a complement to bus rapid transit, and takes advantage of
existing rail infrastructure in several key corridors. Light rail stations in
other cities have also proven to be attractive focal points for
higher-density, mixed-use developments. |
||||||
|
Description |
Present situation §
The
O-Train began operation in 2001 as a two-year pilot project to demonstrate
the feasibility and attractiveness of rail transit in the Ottawa context. It
involves three diesel multiple unit vehicles operating on an 8-km
single-track line with a single passing location at the Carleton Station,
about halfway along the line. The service runs with a 15-minute frequency on
weekdays and Saturdays. Future directions §
Section
7.5 of the TMP identifies policies to develop 110 km of new double tracks for
light rail lines by 2021 (along with stations and Park & Ride lots). §
Electrified
light rail lines will be developed in three types of right-of-way: existing
rail lines, exclusive rights-of way, and shared road rights-of-way. §
TMP
policies (Section 7.5.2) address the City’s intentions to enhance the
comfort, security and convenience of rapid transit stations by: -
Improving
signage, seating, heating, accessibility for disabled persons -
Adding
convenience retail and service uses -
Improving
or adding taxi loading areas, passenger drop-off and pick-up facilities,
bicycle parking facilities, and pedestrian walkways §
Annex
A of the TMP identifies the specific projects that comprise the light rail
expansion strategy §
Figure
14.1 of the TMP recommends light rail projects to be completed at each of
three population horizons: 975,000 (about 2008), 1,100,000 (about 2013) and
1,200,000 (about 2021) (see Milestones, below). |
||||||
|
Supporting references |
§
Official
Plan §
Transportation
Master Plan (TMP) §
Rapid
Transit Expansion Study (RTES) §
Ottawa
Rapid Transit Expansion Program (ORTEP) |
||||||
|
Action plan |
Short term (2009) |
Medium term (about 2016) |
Long term (about 2021) |
||||
|
Actions |
§
Implement
the first phase of the North-South corridor |
§
Implement
the first phase of the East-West corridor |
§
Complete
the North-South and East-West corridors §
Implement
two at-grade corridors in shared road rights-of-way |
||||
|
Milestones |
§
North-South
corridor (downtown to Woodroffe Ave.) |
§
East-West
corridor (Bells Corners to Innes-Blair intersection) §
North-South
corridor (Airport link) |
§
North-South
corridor (Woodroffe Ave. to Barrhaven) §
East-West
corridor (Bells Corners to Kanata North; Innes-Blair intersection to Trim
Rd.) §
Rideau-Montreal-Blair
corridor (Rideau Centre to Innes/Blair intersection) §
Carling
corridor (North-South corridor to Lincoln Fields to Bayshore to Bells
Corners) |
||||
|
Resource requirements |
§
$725
million for engineering and construction |
§
$540
million for engineering and construction |
§
$1.0
billion for engineering and construction |
||||
|
Supporting strategies |
§
Strategy
A.1 — Official Plan §
Strategy
A.2 — Transportation Master Plan §
Strategy
B.4 — Development around rapid transit stations §
Strategy
C.1 — Bus rapid transit §
Strategy
C.3 — Park & Ride §
Strategy
C.4 — Fleet expansion §
Strategy
D.2 — Route network §
Strategy
D.3 — Operations management §
Strategy
D.4 — Transit priority §
Strategy
E.2 — Marketing programs & partnerships |
||||||
|
Performance indicators |
§
Length
of light rail facilities in operation |
||||||
|
CONVENTIONAL
TRANSIT |
|||||||
|
Initiative |
C. SYSTEM CAPACITY |
||||||
|
Strategy |
C.3 Park & Ride |
||||||
|
Rationale |
§
Park
& Ride facilities allow travellers to reach transit service (typically
rapid transit) using their automobiles. It is principally intended for use by
residents of rural Ottawa or other municipalities, but is also used by
suburban residents for whom Park & Ride is more convenient than reaching
transit (typically a feeder route) on foot. |
||||||
|
Description |
Present situation §
The
eight existing park & Ride lots are at Baseline station (275 spaces),
Place d’Orleans station (568 spaces), Greenboro station (680 spaces),
Eagleson station (1185 spaces), Fallowfield station (868 spaces), Trim Road
(268 spaces), Telesat Court (75 spaces) and Terry Fox station (515 spaces) §
Park
& Ride use is free, except at Baseline station where a permit
($17.25/month) is required for use before 11:00 a.m. on weekday mornings, and
at Telesat Court where users must hold a Gold parking permit ($39.75/month).
Gold parking permits are also sold to users of other Park & Ride lots
(except Terry Fox) and offers customers a guaranteed preferred parking space
close to the station platform. Future directions §
TMP
policies (Section 7.5.3) indicate that the City will develop several new Park
& Ride lots adjacent to future rapid transit corridors |
||||||
|
Supporting references |
§
Transportation
Master Plan (TMP) §
Rapid
Transit Expansion Study (RTES) §
Ottawa
Rapid Transit Expansion Program (ORTEP) |
||||||
|
Action plan |
Short term
(2009) |
Medium term
(about 2016) |
Long term
(about 2021) |
||||
|
Actions |
§
Construct
new Park & Ride lots |
§
Construct/expand
Park & Ride lots |
§
Construct/expand
Park & Ride lots |
||||
|
Milestones |
§
New
Park & Ride lot for the Southwest Transitway (Berrigan station) §
Three
new Park & Ride lots for the North-South corridor (Leitrim, River Road,
Woodroffe stations) |
§
Expand
Park & Ride lots for the North-South corridor (Leitrim, River Road,
Woodroffe stations) §
Four
new Park & Ride lots for the East-West corridor (Trim, Navan,
Innes/Walkley, Baseline stations) §
New
Park & Ride lot for the Southwest Transitway (Barrhaven Town Centre
station) |
§
New
Park & Ride lot for the North-South corridor (Bowesville station) §
New
Park & Ride lot for the East-West corridor (Kanata North station) §
New
Park & Ride lot for the Southwest Transitway (Jock River station) §
Two
new Park & Ride lots for the West Transitway (Palladium, Hazeldean
stations) |
||||
|
Resource requirements |
§
$14
million for engineering and construction |
§
$45
million for engineering and construction |
§
$34
million for engineering and construction |
||||
|
Supporting strategies |
§
Strategy
A.1 — Official Plan §
Strategy
A.2 — Transportation Master Plan §
Strategy
C.1 — Bus rapid transit §
Strategy
C.2 — Light rail §
Strategy
E.2 — Marketing programs & partnerships |
||||||
|
Performance indicators |
§
Average weekday occupancy of Park &
Ride spaces §
Number
of Park & Ride lots in operation §
Number
of parking spaces provided |
||||||
|
CONVENTIONAL
TRANSIT |
|||||||
|
Initiative |
C. SYSTEM CAPACITY |
||||||
|
Strategy |
C.4 Fleet expansion |
||||||
|
Rationale |
§
Increasing
transit ridership will require substantial investment in an expanded fleet of
buses and light rail vehicles. Fleet needs will be driven by: -
Bus
service improvements including expanded route networks and service
frequencies -
The
development of an electrified light rail system -
Growing
ridership demands due to population growth, more attractive services,
complementary land use and parking management policies §
Fleet
expansion will be conducted in an integrated fashion with fleet renewal (e.g.
buses in the current fleet have an
expected lifespan of 18 years, so all buses acquired before 2004 are likely
to be replaced by 2021) |
||||||
|
Description |
Present situation §
In
2005, the City’s transit fleet included about 685 standard (12-metre) buses,
227 articulated (18-metre) buses, one small bus and three diesel
multiple-unit rail vehicles. Para Transpo vehicles were provided by
contracted service providers. Future directions §
TMP
policies (Section 7.6) indicate that the City will acquire sufficient new buses
and light rail vehicles to provide desired service levels to a growing number
of transit passengers by 2021, according to an approximate schedule in Annex
B. §
Fleet
expansion requires a commensurate expansion of garage and maintenance
facilities, including four new bus garages and unspecified light rail storage
and maintenance facilities by 2021. |
||||||
|
Supporting references |
§
Transportation
Master Plan — Section 7.6.1 and Annex B |
||||||
|
Action plan |
Short term
(2009) |
Medium term
(about 2016) |
Long term
(about 2021) |
||||
|
Actions |
§
Continued
expansion of the bus fleet, and introduction of the first phase of the light
rail fleet to enable operation of the North-South light rail corridor |
§
Steady
bus fleet expansion (almost 40% above 2009 levels) and substantial light rail
expansion (225% above 2009 levels) to enable North-South corridor extension,
and introduction of the East-West corridor |
§
Gradual
bus fleet expansion (12% above 2016 levels) and substantial light rail
expansion (70% above 2009 levels) |
||||
|
Milestones |
§
By
2008 — New bus barn and maintenance garage will enter service §
By
2009 — Fleet will have 635 standard and 367 articulated buses, and about 20
light rail cars. |
§
By
2014 — New bus barn and maintenance garage will enter service §
By
2016 — Fleet will have about 1015 standard buses, 540 articulated buses and
60 light rail cars |
§
By
2021 — Fleet will have about 1050 standard buses, 700 articulated buses and
105 light rail cars |
||||
|
Supporting strategies |
§
Strategy
C.1 — Bus rapid transit §
Strategy
C.2 — Light rail §
Strategy
D.1 — Service quality §
Strategy
D.2 — Route network |
||||||
|
Performance indicators |
§
Number
of standard and articulated buses and light rail cars in fleet §
Number
of peak service transit vehicles § Number
of peak service standard equivalent buses §
Average age of buses and light rail
vehicles |
||||||
|
CONVENTIONAL
TRANSIT |
|||||||
|
Initiative |
D. SERVICE DESIGN
& DELIVERY |
||||||
|
Strategy |
D.1 Service quality |
||||||
|
Rationale |
§
The
quality of transit service plays a large role in the ability to attract new
ridership. Key service characteristics include frequency, vehicle loading
levels, and the hours and areas in which service is offered. §
Service
standards guide the allocation of transit resources, thus determining how
attractive transit service is to users. They address system-wide and
route-specific financial standards, network and route design guidelines,
service hours, levels of service and capacity standards. |
||||||
|
Description |
Present situation §
Key
service quality characteristics are determined in accordance with the City of
Ottawa’s Transit Service and Fare
Policy Manual (October 2005), a comprehensive statement of the standards
to be met by OC Transpo service for the foreseeable future. The manual
includes: -
Six
transit system management policies, and a financial performance standard for
service improvements or reductions -
Service
standards for the all-day base route network (to which financial performance
standards do not apply) and policies for base route network expansion and
supplementation in developing communities -
Route
design guidelines addressing directness, convenience, economy, accessibility,
feasibility, compatibility, and evaluation of possible changes -
Definitions,
service hours and minimum frequencies for different route types (see Strategy
D.2 — Route network) -
Service
capacity standards governing desirable passenger loading levels (i.e. number
of standing passengers) -
Principles
governing services for festivals and major events §
The
manual also outlines the City’s approach to consultation and approvals
pertaining to service issues, including: -
Annual
transit operating budget, Transplan consultation on major route changes, and
financial performance review -
Quarterly
schedule changes and bi-weekly operations reviews -
Customer
notification for route changes (six months in advance for major route
changes, and about one month in advance for minor route changes) §
The
City’s standard for schedule adherence is for routes to be never early, and
not more than 3 minutes late at least 95% of the time. This standard is more
important on low-frequency routes than on high-frequency routes where headway
consistency is more important. Future directions §
TMP
policies (Section 7.2.1) indicate that the City will: -
Increase
service on routes with growing ridership in order to sustain desired service
levels, allow room for growth, and attract new users. -
Improve
the cost-efficiency of transit services (with a target revenue-cost ratio of
55% by 2008) by using high-capacity buses and light rail vehicles, by using
innovative lower-cost service delivery methods in low-ridership areas, and by
reallocating operating resources away from services that do not meet minimum
ridership targets |
||||||
|
Supporting references |
§
Transit Service and Fare
Policy Manual
(October 2005) |
||||||
|
Action plan |
Short term
(2009) |
Medium term
(about 2016) |
Long term
(about 2021) |
||||
|
Actions |
§
Increasing service frequency or vehicle
capacity on routes with growing ridership in order to sustain desired service levels,
allow room for growth, and attract new users §
Exploring alternative delivery methods
in areas where conventional services cannot cost-effectively meet minimum
ridership targets |
|
|
||||
|
Milestones |
|
||||||
|
Supporting strategies |
|
||||||
|
Performance indicators |
§
On-time performance §
Average
passengers per vehicle §
Number of customer trips affected by
routes on which average ridership per vehicle exceeds established service
capacity standards |
||||||
|
CONVENTIONAL
TRANSIT |
|||||||
|
Initiative |
D. SERVICE DESIGN
& DELIVERY |
||||||
|
Strategy |
D.2 Route network |
||||||
|
Rationale |
§
Ottawa’s
transit route network is structured around the rapid transit system, and will
evolve to take advantage of the future rapid transit expansion. New rapid
transit lines will offer the opportunity to relocate services now operating
in congested traffic environments, and new stations can act as service hubs
where (in some cases) none exist today. |
||||||
|
Description |
Present situation § The
“spine” of OC Transpo service is the all-day base route network, including
routes on rapid transit facilities and major arterial roads that link major
origins and destinations to rapid transit services. Service on the all-day
base route network is provided seven days a week, within an 800-metre walk of
95% of urban households, and is not subject to financial performance
standards. § There are several route
types in the current network: - Transitway
service — High frequency, high capacity bus routes on and beyond Transitway
facilities - O-Train
service — High capacity route that will be upgraded and extended as part of
the light rail strategy - Main
line service — Regular all-day bus routes on streets and the Transitway - Local
service — Feeder bus routes connecting residential or employment areas to
rapid transit service and other major nodes - Express
service — Peak period, direct-to-downtown bus routes that minimize transfers
for commuters from residential areas - Employment
area service — Peak period, direct bus routes from the central area and
Transitway to non-central employment areas - Rural service — Peak
period bus routes from several rural villages to downtown, and all-day
service to and from Manotick. Some small Park & Ride lots are located in
villages served by these routes. § An
annual Transplan consultation process is held to gather public input on a
package of proposed major route changes that is developed in response to
growth and changes in travel demand. Major route changes would result in operation
on a street that currently does not serve transit, or in a longer walk,
longer travel time or additional transfer for more than 100 daily customers.
The consultation process includes discussions with ward Councillors,
advertising, open houses as required, evaluation of comments, and
presentations to Transportation Committee when a ward Councillor does not
concur with staff’s recommendation. Future directions §
TMP
policies (Section 7.2.1) indicate that the City will: -
Expand
the transit route network to serve ridership growth as the population expands
and the transit modal split rises -
Minimize
interruption to O-Train service when it is being upgraded as part of the
North-South light rail corridor §
The
Transit Service and Fare Policy Manual indicates that the City will provide
service to new residential and employment areas in advance of when ridership
would be high enough to meet financial performance standards. In
non-contiguous development areas, the cost of basic peak period service is
paid by the developer. §
The
following changes to the route network will likely occur as part of future
route network development: -
Main
line service — Some routes will be replaced by rapid transit services in
adjacent corridors that can provide more efficient service. -
Local
services — More routes will focus on light rail or Transitway stations as the
number of stations grows throughout the urban area. -
Express
services — Some routes will be replaced by local services feeding light rail
stations. §
Transportation
Committee has approved a conceptual route restructuring in the downtown core
that would accompany the introduction of operations for Phase 1 of the
North-South LRT project. The concept significantly reduces bus volumes on
Albert and Slater Streets, based on a limited hub and spoke system, rapid
transit 90-series bus routes by-passing the downtown and local feeder bus
routes to the light rail line. It incorporates 11 frequent express routes
from the suburban communities to the downtown and moves two routes onto Queen
and Wellington Streets. The recommended service design concept would reduce
the volume of buses on Albert and Slater streets by approximately 30% at the
busiest times. §
The
pending Interprovincial Rapid Transit Environmental Assessment Study could
lead to the eventual introduction of interprovincial rapid transit service,
which in turn would be an opportunity to adjust the route network to improve
convenience and service |
||||||
|
Supporting references |
§
2009
Route Network Concepts – Evaluation and Recommendation (received by
Transportation Committee on Nov. 2, 2005) |
||||
|
Action plan |
Short term
(2009) |
Medium term
(about 2016) |
Long term
(about 2021) |
||
|
Actions |
§
Expand
route network to developing areas as early as possible §
Restructure
routes to accompany new light rail and Transitway facilities (see Strategy
C.1 — Bus rapid transit and Strategy C.2 — Light rail) |
§
Expand
route network to developing areas as early as possible §
Restructure
routes to accompany new light rail and Transitway facilities (see Strategy
C.1 — Bus rapid transit and Strategy C.2 — Light rail) |
§
Expand
route network to developing areas as early as possible §
Restructure
routes to accompany new light rail and Transitway facilities (see Strategy
C.1 — Bus rapid transit and Strategy C.2 — Light rail) |
||
|
Milestones |
§
2009
— New route network to accompany opening of North-South LRT |
||||
|
Supporting strategies |
§
Strategy
C.1 — Bus rapid transit §
Strategy
C.2 — Light rail §
Strategy
D.5 — Interprovincial service §
Strategy
E.1 — Customer service, information & amenities |
||||
|
Performance indicators |
§
Success
rate in providing early service to developing communities |
||||
|
CONVENTIONAL
TRANSIT |
|||||
|
Initiative |
D. SERVICE DESIGN
& DELIVERY |
||||
|
Strategy |
D.3 Operations
management |
||||
|
Rationale |
§
More
efficient transit operations can support ridership growth in several ways: -
Reduced
operating costs permit a reallocation of funds to complementary areas like
customer information or marketing -
Higher
travel speeds reduce travel times for individual riders, making transit a
more competitive choice -
Higher
travel speeds permit constant headways with fewer vehicles, freeing up
resources to improve or extend other services |
||||
|
Description |
Present situation §
Operations
management is an umbrella term for measures that make the most of OC Transpo
resources (vehicles, operators, fuel, etc.) Future directions §
TMP
policies (Section 7.2.1) indicate that the City will: -
Improve
the reliability of transit service through new technologies such as vehicle
location using global positioning systems for service control and monitoring,
as well as through other measures including enhanced operator training and
additional time points. §
The installation of global positioning systems
(GPS) units on OC Transpo buses by mid-2006 will create numerous
opportunities: -
More efficient use of spare vehicles -
Faster, more effective response to schedule
adherence & headway control issues (drivers will have on-board indicators
showing schedule adherence status, whether ahead of or behind schedule and by
how many minutes) -
Faster, more reliable data communications
between transit vehicles and central control -
Provision of real-time route arrival
information for waiting customers at stops and stations outside downtown -
Upgrading of automatic passenger counting
systems from signpost-based technology to GPS technology to provide more
reliable location data -
Analysis
of historical GPS data to improve future scheduling -
Support for smart card fare systems -
Automatic updating of electronic
transfer-issuing machines §
The
installation of transponders on all buses will enable: -
The
provision of real-time route arrival information for waiting
customers at downtown Transitway stops -
The
efficient and effective expansion of transit signal priority measures (see
Strategy D.4 — Transit priority) |
||||
|
Supporting references |
§
“SmartBus”
Business Case Review (2004) |
||||
|
Action plan |
Short term (2009) |
Medium term (about 2016) |
Long term (about 2021) |
||
|
Actions |
§
Installation
of GPS and transponders on all buses (except vehicles nearing retirement) by
2006 |
|
|
||
|
Milestones |
§
2006
— Installation of GPS on bus fleet §
2006
— Begin installation of transponders |
||||
|
Supporting strategies |
§
Strategy
D.4 — Transit priority |
||||
|
Performance indicators |
§
Average operating speed (vehicle-km per
service hour) §
Percentage of scheduled trips operated |
||||
|
CONVENTIONAL
TRANSIT |
|||||
|
Initiative |
D. SERVICE DESIGN
& DELIVERY |
||||
|
Strategy |
D.4 Transit priority |
||||
|
Rationale |
§
Over
85% of Ottawa’s transit service is delivered on roads, where traffic
congestion increases delay and reduces reliability. Transit priority measures
can help attract new riders and increase the efficiency and reliability of
transit operations in the following ways: -
Faster,
more reliable services are more competitive with automobile use, and thus
more attractive to riders. -
Higher
average travel speeds permit constant headways with fewer vehicles, freeing
up resources to save money or improve service elsewhere. -
Higher
reliability reduces the likely extent of delay due to unpredictable
congestion, permitting tighter route scheduling (i.e. shorter lay-ups) and
effectively freeing up resources to save money or improve service elsewhere. |
||||
|
Description |
Present situation §
Transit
priority measures can be physical or operational means of giving transit
vehicles priority over others. Examples include dedicated bus lanes, transit
signal priority treatments, bus queue jumps, special bus stop arrangements,
and traffic management techniques like queue relocation. §
Transit
priority measures currently in use include: -
Curb-side
bus lanes on arterial roads — more than 10 km -
Shoulder
bus lanes on freeways — more than 20 km -
Traffic
signal priority — more than 30 locations -
Transit
priority signal indicators — five locations -
Advance
stop bars — one location -
Left
turns from curb lane — four locations -
Bus-only
interchange connections — several locations -
“Demand
for service” indicators — two locations Future directions §
The
TMP designates a transit priority network on Map 4, comprised of corridors
where transit priority measures are intended to remain indefinitely, and
corridors where transit priority measures will serve as an interim “stepping
stone” during the development of rapid transit facilities. §
TMP
policies (Section 7.4) also indicate that the City will: -
Implement
the transit priority network identified on Map 4. -
Investigate
and implement transit priority measures whenever appropriate as part of
roadway or intersection modifications, but especially at intersections of the
Transitway with other roads, and at intersections and roadways near
Transitway stations. -
Use
education and promotion to build public awareness of transit priority
measures and a positive attitude toward them. §
Annex
A of the TMP identifies specific projects as part of the transit priority
strategy. §
Figure
14.1 of the TMP recommends transit priority projects to be completed at each
of three population horizons: 975,000 (about 2008), 1,100,000 (about 2013)
and 1,200,000 (about 2021) (see Milestones, below). |
||||
|
Supporting references |
§
Transportation
Master Plan — Section 7.4 |
||||
|
Action plan |
Short term
(2009) |
Medium term
(about 2016) |
Long term
(about 2021) |
||
|
Actions |
§
Establish
new transit priority measures in highest priority corridors and locations |
§
Expand
transit priority measures as resources permit |
§
Expand
transit priority measures as resources permit |
||
|
Milestones |
§
Major
operational studies will be undertaken in three major transit priority
corridors, with implementation to begin after the studies finish: -
Central
Area Transitway -
Baseline
Rd./Heron Rd. (Richmond Rd. to Navaho Dr.; Prince of Wales Dr. to Data Centre
Rd.) -
Carling
Ave. (Pinecrest Rd. to Bronson Ave.) §
Measures
will also be implemented at isolated locations possibly including Elmvale
Station, Montreal Rd./Ogilvie Rd., City Highway 174 at Montreal Road
(westbound), and others. §
System-wide
enabling measures will also be undertaken, including the modification of
traffic controller and traffic system software, the installation of
transponders on all buses, and the installation of remote traffic cameras at
several key locations. |
§
Bronson
Ave. (Carling Ave. to Albert St.) §
Holland
Ave. (Carling Ave. to Scott St.) §
Richmond
Rd. (Bayshore Dr. to Carling Ave.) §
St.
Laurent Blvd./Russell Rd. (Montreal Rd. to Walkley Rd.) §
Bank
St. (Wellington St. to Heron Rd.) §
Blair
Rd. (Innes Rd. to Montreal Rd.) §
Fisher
Ave. (Dynes Rd. to NCC Driveway) §
Innes
Rd. (Trim Rd. to St. Laurent Blvd.) §
Merivale
Rd. (Hunt Club Rd. to Carling Ave.) §
Ogilvie
Rd. (Blair Rd. to Montreal Rd.) §
Richmond
Rd./Somerset St. (Westboro Station to Bank St.) §
Wellington
St./Rideau St. /Montreal Rd. (Portage Bridge to Ogilvie Rd.) |
§
Heron
Rd./Walkley Rd. (Bank St. to St. Laurent Blvd.) §
Hunt
Club Rd. (Riverside Dr. to Bank St.) §
March
Rd. (Hwy. 417 to Morgans Grant Way) §
Robertson
Rd./Richmond Rd. (Moodie Dr. to Carling Ave.) §
Smyth
Rd. (St. Laurent Blvd. to Riverside Dr.) |
||
|
Resource requirements |
§
$1.7
million through March 2007 |
|
|
||
|
Supporting strategies |
§
Strategy
A.2 — Transportation Master Plan §
Strategy
D.3 — Operations management |
||||
|
Performance indicators |
§
Transit travel speed increases in new
transit priority corridors §
Transit
travel time reliability improvements in new transit priority corridors §
Transit
priority corridor studies completed §
Number
of implemented transit priority measures of different types |
||||
|
CONVENTIONAL
TRANSIT |
|||||
|
Initiative |
D. SERVICE DESIGN
& DELIVERY |
||||
|
Strategy |
D.5 Interprovincial
service |
||||
|
Rationale |
§
Although
Ottawa and Gatineau represent an integrated urban area, they have separate
municipal governments and largely distinct public services including transit.
Because interprovincial travel by other modes is barrier-free, transit
ridership across the Ottawa River can be maximized only if OC Transpo
and STO integrate their services as much as possible. |
||||
|
Description |
Present situation §
OC
Transpo and STO are complementary systems that operate services extending
into each other’s territory to serve major downtown destinations. Their fare
structures, levels and media are distinct but integrated, and transfers from
one service to the other are either free (for passholders transferring to
regular routes at most times) or require a small “top-up” fee. §
There
are no dedicated rapid transit links between Ottawa and Gatineau, although
there are reserved bus lanes on the Portage Bridge. §
The
municipal governments and transit systems in Ottawa and Gatineau maintain an
ongoing dialogue through which issues are raised and resolved. A new forum
for this dialogue is the OC Transpo/STO Cooperation Committee, which will
hold its first meeting in late 2005 and meet twice a year after that. Future directions §
The
City is a partner in the Interprovincial Transit Integration Environmental Assessment
Study, which will examine ways to improve integration between OC Transpo and
STO. §
Ottawa’s
planned smart card fare system (see Strategy D.9 — Fare technology) will
enable STO and OC Transpo vehicles to read farecards distributed by both
systems. -
Holders
of “stored value” cards will be able to use them on both systems, and avoid
having to pay with cash outside their home province -
STO
passholders will no longer have to carry paper receipts as proof of payment
on OC Transpo buses §
Enhancements
to the automated Travel Planner would incorporate STO route
data, to help customers plan interprovincial trips on both systems |
||||
|
Supporting references |
|
||||
|
Action plan |
Short term (2009) |
Medium term (about 2016) |
Long term (about 2021) |
||
|
Actions |
§
Undertake
the Interprovincial Transit Integration Environmental Assessment Study §
Implement
the new smart card fare system, including enhanced integration with STO fares §
Add
STO service data to the automated Travel Planner |
|
|
||
|
Milestones |
§
2007
— Implementation of OC Transpo smartcard fare system |
||||
|
Supporting strategies |
§
Strategy
D.9 — Fare technology |
||||
|
Performance indicators |
§
Ridership
on OC Transpo and STO interprovincial routes |
||||
|
CONVENTIONAL
TRANSIT |
|||||
|
Initiative |
D. SERVICE DESIGN
& DELIVERY |
||||
|
Strategy |
D.6 Accessible
service |
||||
|
Rationale |
§
As
Ottawa’s population ages over the coming decades, the demand for accessible
public transit services is expected to grow steadily. The population of
seniors will continue to rise, and medical advances will increasingly allow
persons with disabilities to lead fully independent lives. Rising
transportation costs will make transit more competitive over time,
particularly for cost-sensitive individuals such as those with fixed incomes.
Removing barriers to the use of conventional transit services by these riders
will enhance their lives, and is much more cost-efficient than meeting their
needs with specialized transit. §
The
Accessibility for Ontarians with Disabilities Act
requires municipalities and transit systems to (among other things) prepare
accessibility plans that report on past and proposed actions taken to
identify, remove and prevent barriers to persons with disabilities. |
||||
|
Description |
Present situation § Ottawa’s
current Transitway and O-Train stations are accessible to persons with
disabilities, and all buses acquired since 1997 have been low-floor models
able to carry customers who use mobility devices like wheelchairs. In 2005,
the bus fleet is composed of 58% low-floor accessible buses. § Low-floor
accessible buses are currently used on all Transitway routes, as many all-day
routes as possible, and on other routes based on demand by seniors and
persons with disabilities. § 83%
of the existing passenger shelters owned by either the City of Clear Channel
are accessible (17% are not). By 2009, all shelters will be accessible except
for 1.5% where accessibility is precluded by property or utility
restrictions. § Current
or imminent City practices also include: - Employing
an Accessible Transit Specialist - Consulting
with the City’s Accessibility Advisory Committee on an issue-by-issue basis. - Providing
travel training to seniors and
persons with disabilities (via one-on-one, group and train-the-trainer
sessions) - Promoting
customer awareness and sensitivity - Providing
operator awareness and sensitivity training - Offering
alternative information formats, such as TTY -
A one-year pilot project (starting 2006) to
offer a
reduced-cost monthly pass (the Community Pass, same cost as senior pass) to
people receiving income support from the Ontario Disability Support Program
(ODSP), coincident with the removal of free fares on conventional transit for
customers who use a wheelchair, scooter or walker -
Implementation
of a smartcard-based fare system that will minimize the need for passengers
with disabilities to handle tickets, change or passes (since smartcards will
work by proximity to a reader, they need not necessarily be removed from a
customer’s wallet, pocket or bag) Future directions § TMP
policies (Section 7.3) indicate that Ottawa will: - Continue
to make rapid transit facilities accessible - Acquire
only low-floor buses and light rail vehicles, so that all vehicles in
operation by 2015 will be low-floor (NB: By 2010 there will be sufficient
low-floor buses to have one on every route in peak hours, but fleet
composition will be such that high-floor buses will continue to be used in
peak hours) - Assign
low-floor buses to routes and trips where they will be of greatest use to
disabled passengers, until the fleet is 100% accessible - Consider
the needs of persons with disabilities when setting fares and providing
customer information § Providing
automated next-stop announcements and displays on buses via GPS technology
(see Strategy D.3 — Operations management) § Offer
alternative information formats, such as voice-based automated travel
planning |
||||
|
Supporting references |
§
Report
on travel training pilot project (pending) §
City
of Ottawa Municipal Accessibility Plan |
||||
|
Action plan |
Short term
(2009) |
Medium term
(about 2016) |
Long term
(about 2021) |
||
|
Actions |
§
Expand
travel training and community outreach §
Implement
automated next-stop announcements on transit vehicles (Phase 2 of GPS
project, see Strategy D.3 — Operations management) |
§
All
buses in operation are expected to be low-floor by 2015 §
Implement
voice-based automated travel planning |
|
||
|
Milestones |
§
2009
— All shelters to be accessible except where precluded by property or utility
constraints |
§
2015
— All buses in operation are low-floor |
|
||
|
Supporting strategies |
§
Strategy
D.3 — Operations management §
Strategy
D.9 — Fare technology |
||||
|
Performance indicators |
§
Proportion
of low-floor accessible buses in fleet §
Proportion
of passenger shelters that are accessible |
||||
|
CONVENTIONAL
TRANSIT |
|||||
|
Initiative |
D. SERVICE DESIGN
& DELIVERY |
||||
|
Strategy |
D.7 Intermodal
connections |
||||
|
Rationale |
§
Transit
users rely on connections to and from other modes to make their trips as
convenient and comfortable as possible. §
Transit
is also an important means of reaching intercity transportation terminals and
services. |
||||
|
Description |
Present situation §
The
City maintains intermodal connections by linking transit to: -
Walking
— via program to provide missing links to bus stops via pathways and
sidewalks -
Cycling
— via pathways, on-road cycling facilities, bike parking at rapid transit
stations (Bike & Ride), bike racks on buses (Rack & Roll), and provision
for the carriage of bicycles on rail transit vehicles -
Private
automobiles — via Park & Ride lots (see Strategy C.3 — Park & Ride)
and passenger drop-off/pick-up zones at rapid transit stations -
Taxi
— via designated taxi loading zones at many rapid transit stations, and a
service to help passengers arrange for taxi pick-up at rapid transit stations
late at night (Taxi Link) -
Intercity
rail — via Transitway service at both VIA Rail stations (Tremblay Road and
Fallowfield) -
Intercity
air — via Transitway service to Ottawa International airport -
Intercity
bus — via OC Transpo fare sales at Greyhound station, sharing of Transitway
facilities with intercity bus operators (including Greyhound and other
private intermunicipal carriers serving rural Ottawa and external
communities, e.g. Osgoode, Dunrobin, Greely, Metcalfe and North Gower), and
shared fare agreements with private intermunicipal carriers to provide their
customers with inexpensive access to OC Transpo Future directions §
Improve
pedestrian access to rapid transit stations §
Selective
expansion of Rack & Roll program §
Addition
of Terry Fox Transitway station to Greyhound routes between Ottawa and points
west §
Construction
of a light rail link to the Ottawa International Airport (see Strategy C.2 —
Light rail) |
||||
|
Supporting references |
|
||||
|
Action plan |
Short term (2009) |
Medium term (about 2016) |
Long term (about 2021) |
||
|
Actions |
§
Improve
pedestrian access to rapid transit stations §
Selectively
expand Rack & Roll program §
Add a Greyhound stop at the new Terry
Fox Transitway station, for routes between Ottawa and points west |
§
Extend
light rail service to airport |
|
||
|
Milestones |
§
Greyhound
routes begin stopping at Terry Fox station |
§
By
2016 — Opening of light rail link to Ottawa International Airport |
|
||
|
Resource requirements |
§
$400,000
annually for improved pedestrian access to rapid transit stations |
§
$400,000
annually for improved pedestrian access to rapid transit stations |
|
||
|
Supporting strategies |
§
Strategy
B.4 — Development around rapid transit stations and corridors §
Strategy
C.1 — Bus rapid transit §
Strategy
C.2 — Light rail §
Strategy
C.3 — Park & Ride §
Strategy
E.2 — Marketing programs & partnerships |
||||
|
Performance indicators |
§
Length
of improved pedestrian access routes implemented at rapid transit stations |
||||
|
CONVENTIONAL
TRANSIT |
|||||
|
D. SERVICE DESIGN & DELIVERY |
|||||
|
Strategy |
D.8 Safety &
security |
||||
|
Rationale |
§
Studies
have established that public transit is the safest mode of transportation
within cities, and OC Transpo has an excellent safety record. §
Nevertheless,
the physical safety and personal security of passengers and other members of
the public is a primary concern. The individual perception of safety or
security risks can be a critical factor in whether an individual chooses to
use transit rather than other modes. |
||||
|
Description |
Present situation §
The
City has developed a comprehensive approach to maximizing the safety and
security of transit passengers and other members of the public. §
Current
operations: -
33
Transit Law Enforcement Officers patrol transit facilities and vehicles, supported
by 9 dispatchers. While cars are used by most officers to permit rapid
response, a Walk & Ride program involves some officers patrolling on
foot. Patrols focus on the rapid transit system. Special Constable status is
pending for officers, meaning that patrol staff will be able to detain
suspects on reasonable and probable grounds, rather than only when an act is
witnessed directly by officers -
Enforcement
blitzes are conducted for pedestrian infractions/smoking/general conduct at
rapid transit stations, and for speeding by bus operators -
The
Violence Against Transit Employees program trains operators to avoid and
resolve conflicts. -
Security
staff attend community forums and public meetings, as required or invited.
They also visit local schools, sometimes in partnership with Ottawa Police
Services, to address safety and security issues. As part of these visits,
they deliver Operation Lifesaver program for the Railway Association of
Canada, to increase awareness of the dangers of stopping on railway tracks at
crossings. -
Rapid
transit station designs are proactively reviewed before construction, and
safety audits are conducted at 8 to 9 stations each year in conjunction with
Ottawa Police Services and CPTED Ontario (an organization in crime prevention
through environmental design). -
Video
cameras are monitored at 6 or 7 stations. The City has conducted pilot
projects with video cameras in buses, and is developing an expansion
strategy. -
2
light rail stations have public address systems -
The
City promotes customer awareness of its “clear view” policy on buses, to
ensure that operators have an unobstructed view to the right. -
“If
you see something, say something” customer awareness program is currently
underway §
Current
customer information and services: -
Yellow
security phones and direct-call payphone buttons are available in all rapid
transit stations -
Night
Stop program – after 9:00 p.m., all Transitway routes stop at a central
location within stations, and other routes will stop at locations other than
regular stops if requested by disembarking passengers -
TranSecure
program – any person (passenger or not) can hail OC Transpo vehicles for
assistance at any time, and transit operators are continually on the watch
for situations where they may be of assistance -
Extensive
rider safety and security information is available on the OC Transpo website -
TIPS
program offers rewards for incident reports that lead to a conviction Future directions §
Develop
an enhanced community-oriented approach to transit law enforcement §
Equip
patrol cars with wireless laptop technology to enhance communication §
Expand
use of video cameras in buses |
||||
|
Supporting references |
|
||||||
|
Action plan |
Short term
(2009) |
Medium term
(about 2016) |
Long term
(about 2021) |
||||
|
Actions |
§
Expand
number of officers, as resources permit, to enable zone coverage off the
rapid transit system §
Expand
Walk & Ride foot patrol program, as resources permit §
Expand
video monitoring and public address capabilities in rapid transit stations §
Introduce
incident-based video camera coverage inside vehicles |
§
Expand
public address systems in rapid transit stations §
Expand
video camera coverage of rapid transit stations |
|
||||
|
Milestones |
|
||||||
|
Supporting strategies |
§
Strategy
E.3 — Promotion, outreach & education § Strategy E.4 — Market research |
||||||
|
Performance indicators |
§
Number
of Transit Law Enforcement Officers §
Number of rapid transit stations with
video monitoring and public address capability §
Number of buses with incident-based
video monitoring |
||||||
|
CONVENTIONAL
TRANSIT |
|||||||
|
Initiative |
D. SERVICE DESIGN
& DELIVERY |
||||||
|
Strategy |
D.9 Fare technology |
||||||
|
Rationale |
§
How
each transit rider pays their fare is an integral part of their transit
experience. Different fare technologies can make transit use either more or
less convenient. §
Advanced
technologies represent an opportunity to fundamentally change how users pay
fares — minimizing uncertainty, maximizing convenience and offering ways to
make transit more affordable for certain types of users. The positive effects
on ridership can be tangible. §
Electronic
fare validation will reduce fraud, improve working conditions for operators,
and enable convenient and economic fare collection on the light rail service. §
STO
uses smart cards for passes, and plans to introduce stored-value smart cards
shortly. There are numerous benefits (to both users and the systems
themselves) to integrating fare systems so that both systems can read each
other’s smart cards. §
New
fare categories would also be enabled by smart cards, such as a “personal
Ecopass” that would be available to users who do not work for an employer
that participates in the current Ecopass program. Individuals could commit to
transit on an ongoing basis through regular debit payments without
introducing significant revenue protection risks, as any card could be
disabled if its owner stops making automatic payments. §
Concurrent
implementation of a smart card fare system and the “smart bus” system (see
Strategy D.3 — Operations management) offers substantial economies through
the shared use of on-board computer processors. |
||||||
|
Description |
Present situation §
OC
Transpo largely relies on conventional fare media including paper passes
(daily and monthly), tickets and cash. §
Plastic
Ecopass cards are offered to commuters who purchase the pass through payroll
deduction at participating employers. Future directions §
A
smart card-based fare system has been contemplated by OC Transpo since the
mid-1990s, and plans are now underway to implement the system by 2008, with
short-term priority on two types of smart card application: passes (i.e.
monthly and Ecopass) and stored value (i.e. cash/ticket equivalent). §
Smart
cards also make possible a number of innovative fare categories (e.g. weekly
passes, rolling 30-day passes) that will be investigated once passes and
stored-value cards have been implemented (see Strategy D.10 — Fare structures
& levels) |
||||||
|
Supporting references |
§
Transit
Smart Card Strategy (KPMG, 2005) |
||||||
|
Action plan |
Short term
(2009) |
Medium term
(about 2016) |
Long term
(about 2021) |
||||
|
Actions |
§
Smart
card passes and stored value cards are short-term priorities. |
§
Review
and possible changes to fare structures based on smartcard abilities |
|
||||
|
Milestones |
§
2007
— Implementation of smart card passes (monthly pass, employer & personal
Ecopasses) §
2008
— Implementation of stored value smart cards |
||||||
|
Resource requirements |
§
$12.5
million in capital and one-time costs |
||||||
|
Supporting strategies |
§
Strategy
D.3 — Operations management |
||||||
|
Performance indicators |
§
Proportion of fares paid electronically §
Rate of fare fraud |
||||||
|
CONVENTIONAL
TRANSIT |
|||||||
|
Initiative |
D. SERVICE DESIGN
& DELIVERY |
||||||
|
Strategy |
D.10 Fare structures
& levels |
||||||
|
Rationale |
§
Fares
are necessary to generate much of the revenue that pays for transit
operations. Fare structures and levels can also attract and maintain riders. §
Fare
levels may represent a barrier to individual transit use, although the
significance of this barrier varies greatly among passengers. §
The
challenge in setting fare levels is to balance the need to generate revenue
against the desire to lower the barriers faced by current and potential
riders. A key consideration is that lower fares do increase ridership, but
not sufficiently to increase net revenues — and, at the same time, service
costs may rise in order to carry an increased number of riders. Fare
increases, however, generally increase net revenues — but at the cost of
lower ridership, especially among economically vulnerable people (e.g. some
students and elderly customers, and other individuals with low incomes). |
||||||
|
Description |
Present situation §
In
early 2005, fares generated about 51% of the City’s transit operating costs.
The City’s policy target is for fares to generate at least 55% of costs. §
The
average fare (annual fare revenues divided by annual number of customers) in
2004 was $1.20. §
Fare
structures are intended to encourage customers to pre-purchase fares by
communicating the following rationale: buying tickets is better than cash,
buying a pass is better still, and buying an annual pass or holding an
Ecopass is even better. §
2005
fare use distribution: -
Cash
fares — 4.6% of trips, 9.6% of revenue, 14.6% of people -
Tickets
— 20.3% of trips, 28.6% of revenue, 47.0% of people -
Passes
— 75.1% of trips, 61.8% of revenues, 38.4% of people §
Current
cash or ticket categories include: -
Child
(ages 6 to 11) -
Adult
(regular, express, rural express) §
Current
pass categories include: -
Monthly
adult pass (regular, express , rural express ) -
Student
monthly pass (regular, express, rural express) and student annual (regular,
express) -
Senior monthly pass -
Daily
pass (individuals any day, families on Sundays and statutory holidays) -
Ecopass
(subscription through employer) §
Non-pass holders who use the O-Train must pay
a $2.25 cash fare (the system-wide weighted average of cash and ticket
fares). §
The current policy of free fares for
passengers using a wheelchair, scooter or walker will be terminated in 2006
with the implementation of a one-year pilot project to offer a reduced-cost monthly pass
(Community Pass, same cost as senior pass) to people receiving income support from the Ontario
Disability Support Program (see Strategy D.6 — Accessible service) §
Beginning in 2006, two new pass categories
will be offered (each offering a 10% discount from the equivalent cost of monthly
passes):
-
Annual adult pass (i.e. calendar
year) -
Student semester pass (post-secondary only) Future directions §
Increase
the average fare to reach an appropriate level of operating cost-recovery
from fares (55%), and thereafter adjust the average fare at the annual rate
of inflation. §
The
introduction of smart card technology (see Strategy D.9 — Fare technology)
starting in 2007 will provide the opportunity to develop innovative fare
categories (e.g. weekly passes, rolling 30-day passes) that will be
investigated once passes and stored-value cards have been implemented. |
||||||
|
Supporting references |
§
Transit
Service and Fare Policy Manual (2005) |
||||||
|
Action plan |
Short term
(2009) |
Medium term
(about 2016) |
Long term
(about 2021) |
||||
|
Actions |
§
Offering
an annual adult pass and a semester pass for post-secondary students in 2006 §
Achieve
the target rate operating cost-recovery rate of 55% through increases to the
average fare |
§
Review
and possible changes to fare structures based on smartcard abilities §
Annual
fare increases at rate of inflation |
§
Annual
fare increases at rate of inflation |
||||
|
Milestones |
§
2008
— Achievement of target 55% rate of operating cost recovery from fares |
||||||
|
Supporting strategies |
§
Strategy
D.9 — Fare technology |
||||||
|
Performance indicators |
§
Average fare §
Proportion of total revenue and trips by
fare type (cash, ticket, pass) §
Rate of operating cost-recovery from fares |
||||||
|
CONVENTIONAL
TRANSIT |
|||||||
|
Initiative |
E. MARKETING &
EDUCATION |
||||||
|
Strategy |
E.1 Customer service,
information & amenities |
||||||
|
Rationale |
§
Transit
users need accurate and meaningful information to make the decision to take
transit, and then to choose among the wide range of services that are
available to them. By helping users reach the information they need easily
and quickly, the City can increase their likelihood of choosing transit and
their satisfaction with it. Riders also need an “open door” for communication
with transit staff, should they have an issue or question §
By
dividing primary transit markets (e.g. commuters, students, seniors) into
smaller niche markets according to origin (e.g. neighbourhood), travel time
(e.g. peak, off-peak), travel frequency (e.g. regular, occasional) and
destination (e.g. workplace, campus, special event), customer information can
be developed and delivered to various niche market to maximize ridership. |
||||||
|
Description |
Present situation § Elements
of the current customer service program include: - Four
sales and information centres at Rideau Centre, Place d’Orleans, Lincoln
Fields, St. Laurent - Suggestions/compliments/complaints
by telephone and Internet - Operators
receive post-hiring training (and cyclical refresher courses every 3 to 5 years)
on courtesy, conflict avoidance and resolution, and the application of
various system policies § Elements of the customer information
program that are current or imminent include: - OC Transpo website — a significant tool for
providing transit information, with 3.5 million website visits in 2004
(10,000 per average weekday) - Transit
information by telephone - Internet-based
customer-care (e-mail advisories; customer registration) - Travel
planning services provide customized itineraries via telephone, automated
Travel Planner website (4,000 daily users in 2004), email and wireless
devices (imminent). Travel planning service demonstrations are provided at
events such as Ecopass registration days. -
Location-specific displays (rapid transit
stations, bus stop shelters), customized displays (seniors residences,
schools, hospitals) -
"560"
interactive voice response telephone system provides automated bus schedules
over the telephone (12.1 million calls a year) -
Publications
– system map, route maps and timetables, brochures/flyers, and other
publications specific to neighbourhoods (e.g. Kanata
off-peak timetable),
destinations (e.g. Corel Centre) and events (e.g. New Years Eve, Canada Day) Future directions §
Additional
efforts will serve to identify and serve additional niche market segments |
||||||
|
Supporting references |
|
||||||
|
Action plan |
Short term
(2009) |
Medium term
(about 2016) |
Long term
(about 2021) |
||||
|
Actions |
§
Identify
additional niche markets, and develop of targeted services or information |
§
Identify
additional niche markets, and develop targeted services or information
§
Distribute kiosks providing access to the
automated Travel Planner website |
§
Identify
additional niche markets, and develop targeted services or information
|
||||
|
Milestones |
|
||||||
|
Supporting strategies |
§
Strategy
E.2 — Marketing programs & partnerships |
||||||
|
Performance indicators |
§
Annual
customer calls §
Annual
website visits |
||||||
|
CONVENTIONAL
TRANSIT |
|||||||
|
Initiative |
E. MARKETING &
EDUCATION |
||||||
|
Strategy |
E.2 Marketing
programs & partnerships |
||||||
|
Rationale |
§
Building
ridership (and attracting choice riders, in particular) will require the City
to influence customer choices at key decision-points by emphasizing transit’s
convenience, reliability and affordability. §
Marketing
programs and partnerships are intended to identify, understand, engage and
influence the individuals who make up various transit markets. §
Marketing
partnerships can be used to leverage additional value from marketing
expenditures by extending reach, reducing costs, generating additional
revenues, or increasing customer comfort and convenience. |
||||||
|
Description |
Present situation § OC
Transpo’s marketing programs and partnerships are conducted in an individualized
and targeted manner, and are tightly integrated with the delivery of information services (see
Strategy E.1 — Customer service, information & amenities). They include: - Fare
and system map sales through 400 vendors (to complement sales through OC
Transpo’s four sales and information centres) - Sharing
information with media (e.g. Ottawa Citizen local events website
cross-references OC Transpo’s on-line travel planning) - Marketing
relationships (e.g. Ottawa 67s ticket discount and mutual promotion, NAC
LiveRush mutual promotion) - Charter
services operated with cost-recovery principle (e.g. Winterlude and Tulip
Festival shuttles) - Special
service sponsorship (e.g. New Year’s Eve service) - Agreements
for the operation of 6 convenience store outlets in rapid transit stations - Space
rental for newspaper boxes, and automated teller machines on transit property
- Service
and space sharing with intercity transportation carriers (e.g. information
displays at terminals, curb access at Ottawa International Airport, fare
sales at Greyhound terminal and Transitway access privileges for Greyhound
routes) -
Cooperative
pass programs (e.g. employer administration of Ecopass programs) -
Sale of Gold Park &
Ride passes to reserve spaces at selected Park & Rides, pass protection
plans for annual passes, and DayPasses to car dealers -
Lost & found service
provided by Heartwood House (a non-profit organization) Future directions §
Transit
staff plan to continue exploring opportunities for new or expanded marketing
programs and partnerships, particularly those that would increase net
revenues and improve customer convenience. |
||||||
|
Supporting references |
§
Staff
report on “Transit Revenue-Generating Activities” received by Transportation
Committee on Feb. 28, 2005 |
||||||
|
Action plan |
Short term
(2009) |
Medium term
(about 2016) |
Long term
(about 2021) |
||||
|
Actions |
§
Improve
partnerships with school boards, universities and colleges, and VIA Rail §
Expand
derivative products (e.g. pass protection plan for new adult annual pass,
partnerships with car rental agencies/museums/car sharing organizations) §
Expand
sale of DayPasses to car dealers §
Investigate
potential for new revenues through video displays carrying news and
advertising |
|
|
||||
|
Milestones |
|
||||||
|
Supporting strategies |
§
Strategy
E.1 — Customer service, information & amenities |
||||||
|
Performance indicators |
§
Number
of customers using an Ecopass |
||||||
|
CONVENTIONAL
TRANSIT |
|||||||
|
Initiative |
E. MARKETING &
EDUCATION |
||||||
|
Strategy |
E.3 Promotion,
outreach & education |
||||||
|
Rationale |
§
Education,
promotion and outreach (together with pricing and marketing initiatives) is a
key manifestation of transportation demand management (TDM) philosophy — i.e.
that a successful public transit system must focus on managing the demand for
service, as well as the supply. §
Heightened
awareness, understanding and public opinion of transit will provide a
foundation for more individual travel decisions to favour transit, thus
increasing ridership over time: - Education
involves measures to enhance individuals’ understanding of transit and its
benefits to them, their community and environment. - Promotion
involves measures to enhance awareness of transit service and its key
attributes, and to strengthen transit’s “brand”, through means including
advertising, sponsorships and special events (e.g. annual Food Drive). -
Outreach involves the delivery of education
and promotion measures by proactively engaging individuals and groups through
direct presentations and discussions (either one-to-one or one-to-many) and partnerships
with other organizations to reach their members or clients. |
||||||
|
Description |
Present situation § OC
Transpo conducts a range of related activities: - School
program — presentations to 3,000 primary school students annually - Sponsorship
of and/or participation in environmental and other special events (e.g. Clean
Air Day, Car Free Day, Food Drive) - Attendance
at trade shows and information shows - Travel
training at schools, hospitals and community agencies - Supply
of customized information packages — e.g. for seniors at libraries (see
Strategy E.1 — Customer service, information & amenities) §
The City’s TravelWise TDM program also
actively supports transit through a multimodal suite of activities. City
staff work to help employers, educational institutions and community groups
to support transit and other sustainable travel modes through activities like
sponsorship of special events (e.g. Commuter
Challenge) Future directions §
Promotional
activities to accompany new or expanded light rail and bus rapid transit
services §
Promotion
and outreach to employers through OC Transpo programs, as well as through the
City’s TravelWise TDM program which will be expanded to work more closely
with employers and schools §
Promote
internal environmental initiatives such as the adoption of 20% biodiesel
blend for bus propulsion, and the introduction of hybrid diesel-electric
buses |
||||||
|
Supporting references |
|
||||||
|
Action plan |
Short term
(2009) |
Medium term
(about 2016) |
Long term
(about 2021) |
||||
|
Actions |
§
Promote the expansion of light rail
service in several
communities through advertising, media events, active sales and publicity
that emphasize light rail’s quiet, clean, convenient and reliable service §
Promote expanded bus transit services in
new residential communities through advertising and publicity that emphasize increased
frequencies and reduced travel times §
Promote the cost advantage of transit
over automobile travel through advertising and publicity §
Promote
transit to employees at large workplaces through the use of dedicated web
pages, presentations and displays §
Promote
OC Transpo’s clean fuel and vehicle technologies including biodiesel blend
fuel and hybrid diesel-electric engines |
§
Same
as short term |
§
Same
as medium term |
||||
|
Milestones |
|
||||||
|
Supporting strategies |
§
Strategy
E.1 — Customer service, information & amenities |
||||||
|
Performance indicators |
§
Non-user
opinion of transit system, as determined through surveys §
Proportion
of population using transit at least once per year |
||||||
|
CONVENTIONAL
TRANSIT |
|||||||
|
Initiative |
E. MARKETING &
EDUCATION |
||||||
|
Strategy |
E.4 Market research |
||||||
|
Rationale |
§
Market
research helps to identify and understand various elements of the transit
market, in order to guide the development of service or information products
that can increase ridership. |
||||||
|
Description |
Present situation §
A
telephone-based Attitude Survey of customers and non-customers is conducted
every two years. §
One-off
count programs (e.g. of Rack & Roll usage) are conducted as required and
as resources permit. §
The
City’s Origin-Destination Survey, conducted every 10 years or so, is an
invaluable source of detailed transportation behaviour data. Future directions §
Continue
regular conduct of Attitude Survey and Origin-Destination Survey |
||||||
|
Supporting references |
|
||||||
|
Action plan |
Short term
(2009) |
Medium term
(about 2016) |
Long term
(about 2021) |
||||
|
Actions |
§
Analysis
of 2005 Origin-Destination Survey results §
Repeat
Attitude Survey every 2 years |
§
New
Origin-Destination toward the end of this period |
|
||||
|
Milestones |
|
||||||
|
Resource requirements |
§
$50,000
to conduct each Attitude Survey |
||||||
|
Supporting strategies |
|
||||||
|
Performance indicators |
§
Number
of market research activities conducted |
||||||
|
SPECIALIZED
TRANSIT |
|||||||
|
Initiative |
F. SPECIALIZED
TRANSIT |
||||||
|
Strategy |
F.1 Fleet |
||||||
|
Rationale |
§
Fleet
requirements are a function of targeted Para Transpo service levels. |
||||||
|
Description |
Present situation §
Para
Transpo fleet vehicles are owned and operated by two private contractors,
with the number of vehicles specified in the contracts. One contractor
(FirstBus Canada) operates the accessible van service using 92 dedicated
wheelchair-accessible vans, and also operates the sedan service using
37 dedicated full-size four-door sedans. A second contractor (WestWay Taxi) supplements this base
service using a fleet of about 30 non‑accessible taxis. Future directions §
Due
to the conventional transit fleet’s increasing accessibility and use by
persons with disabilities, expansion of the dedicated Para Transpo fleet is
not generally envisioned, possibly except for accessible and/or
non-accessible taxi service mostly during the winter months. |
||||||
|
Supporting references |
|
||||||
|
Action plan |
Short term
(2009) |
Medium term
(about 2016) |
Long term
(about 2021) |
||||
|
Actions |
§
Maintain
the dedicated wheelchair-accessible van fleet at its current size. §
The
number of taxis used will likely expand, mostly in the winter months. A new
contract to deliver supplemental taxi service will be in effect in April or
May 2006, including the delivery of supplemental taxi service using
wheelchair-accessible taxis. A
decision on whether to expand, maintain or reduce the current sedan service
will be made over 2006 and 2007 based on the cost-effectiveness of the new
taxi service. |
|
|
||||
|
Milestones |
§
By
2007 — Decision on changes to current sedan service |
|
|
||||
|
Resource requirements |
§
To
be determined based on the cost of the new 2006 taxi contract |
|
|
||||
|
Supporting strategies |
§
Strategy
D.6 — Accessible service |
||||||
|
Performance indicators |
§
Number
of fleet vehicles, by type |
||||||
|
SPECIALIZED
TRANSIT |
|||||||
|
Initiative |
F. SPECIALIZED
TRANSIT |
||||||
|
Strategy |
F.2 Service standards |
||||||
|
Rationale |
§
The
availability of service (i.e. hours and areas served) and service levels are
major factors in determining the degree to which customers can rely on
transit to meet their travel needs. §
Eligibility
(which determines whether the service is available to a given individual) is
another key determinant of the number of customers who use the service, which
in turn determines the proportion of customer demand that can be met with a
fixed resource base. |
||||||
|
Description |
Present situation §
The
area served by Para Transpo is larger than the area served by conventional
transit. Para Transpo will pick up
and return clients anywhere within the City of Ottawa, and will also carry
Ottawa residents to and from an area within the City of Gatineau formerly
known as the City of Hull. §
Para
Transpo service hours are approximately the same times as those of
conventional transit service. If a
non-disabled person can take a conventional transit bus to a location within
the transit area by a specific time, then Para Transpo will ensure that a
Para Transpo client living in the same area will be delivered to the same
destination by approximately the same time. §
Service
is offered to persons who have permanent or short-term disabilities that
prevent them from being able to use conventional transit service, and who
submit an eligibility form signed by an appropriate health care professional
such as a physician, a physiotherapist, an occupational therapist, or a
chiropractor. Service is also available to qualified disabled persons
visiting Ottawa-Carleton. §
Para
Transpo, like most other specialized transit services in Canada, cannot meet
the demands of all of its customers. On average, about 95% of trip requests
can be accommodated with the available resources. §
Advertised
service levels are based on a half-hour window for scheduled customer
pick-ups. About 95% of customer pick-ups are made within this window. Future directions §
Para
Transpo will continue to parallel the hours of services provided by
conventional service anywhere within the City of Ottawa. §
Eligibility
terms are not expected to change. §
Existing
service levels will be maintained, while the availability of service will be
based on the availability of resources. |
||||||
|
Supporting references |
|
||||||
|
Action plan |
Short term
(2009) |
Medium term
(about 2016) |
Long term
(about 2021) |
||||
|
Actions |
§
Maintain
current service standards, updating them as needed |
|
|
||||
|
Milestones |
|
|
|
||||
|
Supporting strategies |
|
||||||
|
Performance indicators |
§
Service hours and days of operation §
Call centre hours and days of operation §
Proportion of customers picked up within
a scheduled 30-minute window (versus 95% target) |
||||||
|
SPECIALIZED
TRANSIT |
|||||||
|
Initiative |
F. SPECIALIZED
TRANSIT |
||||||
|
Strategy |
F.3 Booking,
scheduling & dispatching |
||||||
|
Rationale |
§
Specialized
transit services are highly variable and depend on the specifics of customer
demands that appear on a day-to-day basis. Booking, scheduling and
dispatching are the links between a customer request and the actual delivery
of service in response. |
||||||
|
Description |
Present situation §
About
700,000 Para Transpo trips each year are booked, scheduled and dispatched by
about 30 staff of City of Ottawa Transit Services: -
Customers
with regular trips (i.e. on the same days and at the same times each week)
can pre-arrange regular bookings, and the requested service is provided automatically
each week without the customer having to contact Para Transpo. Regular
bookings account for about 55% of trips. Customers book casual trips by
contacting Para Transpo booking agents one day before service is required.
Casual trips account for about 45% of trips. -
Using
the Trapeze automated scheduling system, Para Transpo schedulers produce hard
copy schedules (runs) and send them to the contractor who operates the
dedicated accessible van and non-accessible sedan contracts. Trips that cannot be scheduled to
dedicated vehicles in a cost‑effective manner are emailed to the taxi
service contractor, who schedules and dispatches them to their Para Transpo
taxi drivers. -
Service
adjustments during the day are sent to dedicated vans or sedans by Para Transpo
dispatchers using three radio communication channels, while service
adjustments on taxi runs are forwarded to the taxi contractor’s dispatcher
via a dedicated phone line. Future directions §
All
92 dedicated wheelchair-accessible vans will be equipped with on-board
processors and GPS units in 2006, to help improve the efficiency and
effectiveness of scheduling and dispatching among other service areas. |
||||||
|
Supporting references |
|
||||||
|
Action plan |
Short term
(2009) |
Medium term
(about 2016) |
Long term
(about 2021) |
||||
|
Actions |
§
Equip
accessible vans with processors and GPS units |
|
|
||||
|
Milestones |
§
2006
— All vans to be equipped with processors and GPS units |
|
|
||||
|
Supporting strategies |
|
||||||
|
Performance indicators |
§
Vehicle-kilometres per passenger §
Passenger trips per hour §
Proportion of booking requests not
accommodated |
||||||
|
SPECIALIZED
TRANSIT |
|||||||
|
Initiative |
F. SPECIALIZED
TRANSIT |
||||||
|
Strategy |
F.4 Fares |
||||||
|
Rationale |
§
Fares
generate only a small portion of the revenue that pays for specialized
transit operations, due to the customized and highly passenger-focused
service. §
Unlike
conventional transit fares, specialized transit fares are not set with a
certain cost-recovery goal in mind. Rather, they are set on the basis of
equity with conventional transit users, while recognizing the premium door-to-door
nature of the service (making it slightly more expensive). Maintaining a fare
level slightly above conventional transit fares also provides an incentive
for customers with disabilities to make conventional transit their first
choice, wherever and whenever possible. |
||||||
|
Description |
Present situation §
In
2004, fares generated about 7% of Para Transpo costs. §
Para
Transpo fares are based on the fare structure and levels of conventional
transit. Para Transpo customers may pay fares with cash or tickets (or a
combination thereof), or with a pass (adult, student or senior; regular or
express; or Ecopass). In some cases, a small supplement in the form of either
cash or tickets is required. Registered Para Transpo users may ride the
O-Train at no charge. Rural fares are calculated based on origin and
destination, with the fare representing about 10% of the actual trip cost. Future directions §
Because
Para Transpo fares are based on the fare structure and levels of conventional
transit , they will likely change in close step with conventional fares (for
information on expected fare increases, see Strategy D.10 – Fare
structures and levels) §
Possible
ways to make Para Transpo fare payments more flexible and convenient (e.g.
through structure or technology) and will be explored as smart cards (see
Strategy D.9 — Fare technology) are introduced on conventional transit
services. |
||||||
|
Supporting references |
|
||||||
|
Action plan |
Short term
(2009) |
Medium term
(about 2016) |
Long term
(about 2021) |
||||
|
Actions |
§
Maintain the current relationship
between Para Transpo and OC Transpo fares §
Investigate options to make Para Transpo
fare payment more flexible and convenient, in parallel with smart card
implementation on conventional transit §
Investigate new Para Transpo fare categories to parallel any
developed for conventional transit (e.g. weekly passes, rolling 30-day
passes) |
|
|
||||
|
Milestones |
|
|
|
||||
|
Supporting strategies |
§
Strategy
D.9 — Fare technology §
Strategy
D.10 — Fare structures and levels |
||||||
|
Performance indicators |
§
Rate
of operating cost-recovery from fares |
||||||
|
|
Official Plan |
A
transportation system should emphasize both mobility and accessibility. Emphasizing mobility means providing the
transportation facilities (roads, bus routes, etc.) to get people from one part
of Ottawa to their destinations in other areas, no matter the distances
involved. In contrast, emphasizing
accessibility means planning the city to bring
people closer to their destinations and making it easier for people to reach
jobs, services, education and recreation. [OMB decision, June 17, 2005]
Accessibility
also means increasing the range of options open to people who need to travel
within the city. Some residents of
Ottawa already have access to quality transit, walking and biking facilities,
but these transportation options need to be extended to other areas of the
city.
This
Plan encourages land-use patterns that reduce the need to travel great
distances across the city and encourage alternatives to car travel. More compact and mixed-use development
throughout developing areas of the city and a stronger series of urban centres
to anchor the transit system is essential to achieving the Plan’s
transportation goals. [OMB
decision, June 17, 2005]
This
strategic direction is compatible with the City’s desire to protect and improve
the natural environment, as it will reduce the amount of land used for new
transportation facilities and decrease air pollution and greenhouse gas
emissions from private automobile use.
It will also help minimize the disruption of roadconstruction in
established communities and help reduce the amount of traffic in our
neighbourhoods.
Accommodating
the movement of people during the morning and afternoon peak hours is the major
transportation challenge for the planning period. However, independent of City actions, some significant changes in
travel are anticipated, including increased reliance on communication
technologies to replace travel and the extension of peak-period travel over a
longer period as the city grows.
A clear objective of this Plan is a substantial
increase in the use of public transit and reduced dependence upon automobile
use during peak hours. Increasing the
percentage of trips by transit from today’s level of 17 per cent of total
passenger trips using motorized modes (transit or automobile) to about 30 per
cent by 2021 is crucial to meet growing travel needs. This doubling of the share of travel by transit is very
ambitious, in that it far exceeds current usage levels for all of the larger
urban areas in Canada and the United States.
In fact, it is comparable to the levels realized by many European
cities. [OMB
decision, June 17, 2005]
Despite
the focus on increased transit use, there will be a need for on-going
improvements to the road infrastructure network. With a 30 per cent modal split in favour of transit, new roads
and road widenings identified in the Official Plan (1997) of the former Region
of Ottawa-Carleton will still be needed to accommodate projected traffic
volumes in 2021.
The
rapid-transit system will also be expanded to directly serve much more of the
urban area. Complementary measures will
also be needed to enhance the relative attractiveness of transit over private
automobile use. These measures include
controlling parking supply and pricing parking appropriately.
City
Council has adopted a Transportation Master Plan (TMP) to implement the
policies expressed in this Plan. The
TMP identifies the transportation policies, facilities and services that the
City intends to put in place over the next two decades in order to meet the
travel needs of residents and businesses in Ottawa and to support the
development pattern identified in the Official Plan. The TMP policies guide the operation of the City's day-to-day
transportation programs and provide a basis for developing the annual and
five-year capital and operating budgets.
While the TMP does not establish design or operating details, it identifies the need for separate guidelines that will give
detailed support to policy objectives.
It has several recurring themes consistent with the Ottawa 20/20 growth
management vision, including minimizing costs, minimizing unnecessary travel,
minimizing automobile dependence, keeping neighbourhoods liveable, protecting
public health and the environment, and making efficient use of current
infrastructure and services. [Amendment 14, September 8, 2004] [OMB decision, June
17, 2005]
In keeping with the Transportation Master Plan the City will seek to achieve the following increases in the share of peak-hour travel by pedestrian, cycling and public transit modes by 2021: [Amendment 14, September 8, 2004]
· Walking modal share of all person trips – from 9.6 per cent in 2001 to 10 per cent in 2021;
· Cycling modal share of all person trips – from 1.7 per cent in 2001 to 3 per cent in 2021;
· Public transit – from 17 per cent of total motorized trips in 2001 to 30 per cent in 2021.
Figure 2.4 Projected
Transit Modal Splits — Screenlines
(Proportion of travel by motorized modes, afternoon
peak hour, peak direction)
|
Screenline* |
Transit Modal Split |
|
|
2002 |
2021 |
|
|
Rideau River |
28% |
50% |
|
CPR |
30% |
49% |
|
Total: Inner Area Cordon |
29% |
50% |
|
Green’s Creek |
33% |
41% |
|
417 East (2000) |
0% |
0% |
|
Leitrim |
1% |
32% |
|
Fallowfield |
9% |
31% |
|
Eagleson |
15% |
38% |
|
Total: Greenbelt Cordon |
17% |
34% |
|
Interprovincial** |
16% |
36% |
|
CNR West |
15% |
36% |
|
CNR East |
18% |
41% |
|
Western Parkway (1996) |
15% |
41% |
|
Terry Fox (1996) |
3% |
34% |
|
Rideau South |
6% |
25% |
|
Bilberry Creek (1996) |
20% |
35% |
|
Smyth / Hydro
(2001) |
29% |
43% |
|
|
||
* All 2002 data
shown correspond to actual 2002 counts unless otherwise noted
** Interprovincial screenline projections are preliminary
estimates subject to refinement through future work with the City of Gatineau
and the National Capital Commission [OMB
decision, June 17, 2005]
Policies
Transportation Master Plan
1. The
City will implement a Transportation Master Plan that sets out Transportation
Demand Management (TDM) programs, transportation system management programs and
transit-priority measures as described in the policies below. [Amendment 14, September 8, 2004]
Transportation Demand Management
2. The City will implement a comprehensive Transportation Demand Management (TDM) program as part of its efforts to reduce automobile dependency. TDM measures can reduce transportation infrastructure needs, congestion and pollution by minimizing the need for personal travel and encouraging people to change their travel mode, timing or destination. The City’s TDM program will involve independent action as well as partnerships with the private sector, other governments and non-governmental organizations including educational institutions and community groups. It will make alternatives to driving more attractive, build a positive public attitude towards them, and provide information and incentives that encourage individuals to reduce their car use. [OMB decision, June 17, 2005]
3. To demonstrate its commitment to leadership, the City will act as a role model by implementing measures that enhance its employees’ options for commuting and business travel.
4. The City will minimize the effect of excessive traffic speed and volumes on residential neighbourhoods by researching and implementing measures and programs as part of its TDM program to enforce speed limits, discourage speeding, cut through traffic and reckless driving, and encourage walking, cycling and transit as preferred methods for trips in or through neighbourhoods.
Transportation System Management
5. The City will implement a comprehensive Transportation System Management (TSM) program. TSM refers to strategies that can be implemented to make more efficient use of existing facilities through improved management and operation of transportation infrastructure. TSM focuses on optimizing existing infrastructure, for example, adjusting traffic control devices to maximize car flow, or to provide priority to transit vehicles. [OMB decision, June 17, 2005]
Walking
6. When undertaking comprehensive land-use planning studies, especially community design plans (see Section 2.5.7), the City will emphasize the creation of pedestrian-friendly environments.
7. The City will require, where feasible, that all new development or redevelopment provide walking facilities in accordance with the policies of Section 4.3. This includes, for example, providing safe, direct and attractive pedestrian access between public sidewalks and building entrances.
8. In the construction or reconstruction of transportation facilities, such as roadways, bridges, and transit stations, and public buildings, such as community centres and libraries, the City will ensure the provision of facilities to address the needs of pedestrians where feasible.
9. The City will ensure that pedestrian safety is a high priority in the selection and configuration of traffic control device. [OMB decision, June 17, 2005]
10. The City will support walking through promotion and education initiatives that address issues such as personal security; safe behaviour by vehicle drivers, cyclists and pedestrians; and an appreciation of the health and environmental benefits of walking and costs of the private and public travel choices.
11. The City will prepare a Pedestrian Plan by the end of 2004, which will outline guidelines and standards for pedestrian facilities and circulation, identify discontinuities in the pedestrian network, and develop a network implementation strategy. The plan will guide the City in the development and implementation of new programs and facilities to encourage people to walk and to reduce their dependence on the automobile.
Cycling
12. When undertaking or reviewing comprehensive land-use planning studies, such as community design plans (see Section 2.5.7), the City will require that emphasis be placed upon creating environments highly favourable to cyclists.
13. The City will require, where feasible, that all new development or redevelopment provide cycling facilities in accordance with the policies of Section 4.3. For example, bicycle parking spaces will be located in highly visible and lighted areas, sheltered from weather if possible.
14. In the construction or reconstruction of transportation facilities (roadways, bridges, transit stations, etc.) and public buildings (community centres, libraries, etc.), the City will ensure, to the extent possible, the provision of facilities to address the needs and safety of cyclists.
15. The City will protect corridors for and develop the network of major urban cycling routes identified on Schedule C. Schedule C includes those routes identified in the approved cycling plans of the former regional and local governments now making up the City of Ottawa and select routes shown in the National Capital Commission’s study, Integrated Network of Recreational Pathways for the National Capital Region. As illustrated on Schedule C, the City will accommodate commuter cycling needs on the road network to the greatest extent possible. However the network of major recreational pathways, identified on Schedules I and J, may also be used by commuter cyclists.
16. The City will prepare a Cycling Plan by the end of 2004, which will include harmonizing cycling policies, establishing supporting guidelines and updating a plan for the integrated cycling network. The Cycling Plan will guide the City in the development and implementation of new programs and facilities to encourage people to cycle. Schedule C will be amended to reflect the integrated cycling network of the Cycling Plan.
17. As part of the implementation of policies 14 and 15, the City will identify missing links in the cycling network and develop a program to rectify these discontinuities. Discontinuities in the recreational pathway network (see Section 4.6.5) will be addressed through the Greenspace Master Plan.
18. The City will support cycling through promotion and education initiatives that address issues including, but not limited to, proper driver and cyclist behaviour, safe cycling techniques, awareness of designated cycling routes, and an appreciation of the health and environmental benefits of walking and costs of the private and public travel choices.
Transit
19. The City will protect corridors for and develop the rapid-transit network and transit-priority network as shown on Schedule D. Rapid transit means a convenient, fast, and frequent public transportation service that features a high carrying capacity. Rapid transit operates on its own right-of-way, as a separate system or in shared corridors, and is not delayed in general traffic. The rapid-transit network consists of an interconnecting system of existing and planned rights-of-way and corridors in which a rapid-transit facility, such as a transitway, O-Train, or streetcar, may be located. A transit-priority network is a system of primarily arterial roads upon which transit-priority measures may be implemented to improve the quality of transit service in terms of speed and reliability. Specific segments of the transit-priority network may represent the interim stage in the long-term development of a rapid-transit network.
20. The City will introduce rapid-transit quality service at an early stage in the development of new urban communities. As these communities mature, they will ultimately be served by the extension of full rapid-transit facilities.
21. The City may acquire lands for transit rights-of-way as a condition of approval for a subdivision, severance, site plan, condominium or minor variance.
22. The City will improve the speed and reliability of transit service by providing transit-priority measures to lessen delays on transit vehicles caused by other traffic and traffic control signals. Transit-priority measures will be implemented for those transit-priority corridors identified on Schedule D and at other opportune locations.
23. In new development, the City will require that the layout of the road network be designed to facilitate transit routing and ensure reasonable walking distances to transit stops, as required by Section 4.3.
24. Further to any land-use requirements associated with a particular designation, development within 600 metres of transit stations will occur in accordance with Section 4.3.
25. In addition to the provision of excellent pedestrian and cycling access to transit stations, the City will ensure, where feasible, the provision of separate multi-use pathways in or adjacent to rapid-transit corridors.
26. The City will pursue partnerships with the private sector to develop lands at or over transit stations and park-and-ride facilities.
27. The City will ensure the provision of park-and-ride facilities to enhance accessibility to rapid-transit services at selected stations and other appropriate sites. In this regard, the City may require that the proponents of major development at existing or planned rapid-transit stations provide sufficient land for park-and-ride facilities, for which the City may enter into agreements for purchase, rent, operation or shared use.
28. The City will work with the City of Gatineau and the federal government to improve transit service between the Cities of Ottawa and Gatineau and investigate means to reduce the use of King Edward Avenue and Rideau Street as bus waiting areas. The City will work with the City of Gatineau and the federal government to improve transit service between the Cities of Ottawa and Gatineau and investigate means to reduce the use of King Edward Avenue and Rideau Street as bus waiting areas. Pending completion of the Interprovincial Rapid Transit EA Study, the City will protect for the possible inclusion of exclusive rapid transit services across such bridges as the Lemieux Island Rail Bridge, the Portage Bridge, the Chaudière Bridge, or other locations as may be identified in the environmental assessment. [OMB decision, June 17, 2005] [OMB decision, October 24, 2005].
29. At the time of initial development or at a later date, the City in partnership with affected parties may construct pedestrian overpasses to provide improved access to rapid-transit facilities such as the overpass between the transitway and the Blair Road office complex south of Highway 174 and the overpass proposed for the Rideau Canal that will connect Centretown and the transitway. Other sites that could be considered for pedestrian overpasses in the future include the Ottawa baseball stadium on Coventry Road and the Algonquin College Woodroffe Campus.
Roads and Rights-of-Way Protection
30. The City will develop the road network shown on Schedules E to H to provide for the safe and convenient movement of people and goods.
31. The City will protect rights-of-way for the road network shown on Schedules E to H and as listed in detail in Annex 1. A description of the road network classification and further rights-of-way protection policies are also found in Annex 1.
32. An amendment to this Plan is required when an arterial road or city freeway is to be added or deleted from the schedules, or when an Arterial – Conceptual (Alignment Undefined) is proposed to be changed to an Arterial – Proposed (Alignment Defined). An amendment to this Plan will not be required to add or delete major collector or collector roadways, such roads being generally deeded to the City through the subdivision approval process. An amendment will be required for all other schedule changes.
33. The City may acquire land for rights-of-way or the widening of rights-of-way through conditions of approval for a subdivision, severance, site plan, condominium or minor variance. As detailed in Annex 1, this may involve unequal road widenings, the requirement for additional land for corner triangles at intersections or railway crossings, and the use of easements in the Central Area.
34. When the City permits interim uses of the land in its rights-of-way, it will ensure that the uses are in accordance with the objectives of this Plan.
35. Priority use of lanes on a road or planned new lanes may be given exclusively to certain classes of roadway users if it contributes to the implementation of transportation and land-use objectives of this Plan. This may result in roadway lanes reserved for transit vehicles in identified locations supportive of rapid-transit and the transit-priority network. The City may give priority to lanes used for high-occupancy vehicles on selected roads. Additional truck-priority lanes (e.g., Waller to Nicholas Streets) may also be implemented.
36. The City will ensure that road corridors function as public spaces in Ottawa by implementing the Arterial Road Corridor Design Guidelines for the City’s urban arterial roads and Village mainstreets. Application of the guidelines will result in street tree plantings, which helps to improve the natural environment. The City will prepare and implement similar guidelines for all other arterial and collector roads, including but not limited to, roads in heritage districts, tourist areas and business improvement areas. It is recognized that the parkway network in the city, primarily developed by the National Capital Commission, contributes greatly to the distinct open space character of Ottawa.
37. In recognition of the importance of preserving and enhancing the visual and aesthetic appeal of the main scenic and entry routes in Ottawa, the City will require additional development controls for lands along these routes, as identified in Schedules I and J, and detailed in Section 4.6.4.
38. In considering prospective changes to the provincial highway network, the City would likely favour actions to improve road safety and reduce emissions, but it is not likely to favour actions that have substantial neighbourhood impacts or increase congestion on parallel or intersecting streets. [OMB decision, June 17, 2005]
Other Rights-of-Way Protection
39. The City will purchase surplus railway rights-of-way and select utility (e.g., hydro line) corridors, as they become available, for use as future transportation and utility corridors. When such rights-of-way are acquired, recreational and agricultural uses may be permitted as interim uses. Future use as a transportation or utility corridor will have priority over any interim use. Provision will be made for recreational uses to continue, wherever possible.
40. The City will not close and sell unopened road allowances that have reasonable potential, in the short- or long-term, for use as a roadway, a transit or utility corridor, or a pedestrian or cyclist link or, as outlined in Section 2.4.5, public access to the shore of a water body. [Amendment 14, September 8, 2004]
41. The City will work with the federal and provincial governments and the Province of Québec and the City of Gatineau, to determine the location of future bridge crossing(s) of the Ottawa River. Pending agreement on the location(s), the City will continue to prohibit development that might hinder the eventual use of potential crossings and approaches, such as those to Kettle Island or from Orléans to Angers.
42. The City maintains the following strategic objectives related to parking:
a.
To
provide short-term parking that supports the vital interests of local
businesses, institutions and tourism destinations;
Parking
43. The City will develop a Parking Management Strategy by the end of 2006, which will:
a)
Support the City’s strategic parking objectives outlined above; [OMB
decision, June 17, 2005]
b)
Establish centralized parkinglots within a reasonable walking distance
of multiple destinations, where required;
c)
Account for potential changes to the current supply through
redevelopment of existing lots;
d)
Investigate new technologies for payment, enforcement and user
information;
e)
Provide an adequate supply of bicycle parking;
f)
Address the needs of the tourism industry;
g)
In
consultation with community associations, local businesses and other interested
parties, the City will review current policies regarding residential on-street parking permits
and consider options to balance the
needs of the community, businesses, and others; [OMB decision, June 17,
2005]
h)
Investigate
means to incorporate reduced parking requirements for long-term parking into
its zoning by-law, where specific criteria are satisfied that contribute to
walking, cycling and transit use. [OMB decision, June 17, 2005]
44. The City will update, as appropriate, the City’s cash-in-lieu of parking policy to ensure fair and equitable application across the city. This policy permits entering into agreements with an applicant to reduce or eliminate the provision of on-site parking otherwise required by the zoning by-law, subject to the payment of money to the City.
45. As a condition of development application approval, the City will apply further policies for parking lots as outlined in Section 4.3.
Movement of Goods
46. The City will minimize the impact of truck traffic on residential neighbourhoods caused by the presence of these vehicles and their noise, vibration and emissions by ensuring the availability of a comprehensive truck route network based on the arterial road system.
47. The City will explore alternative means to accommodate interprovincial truck travel to minimize impacts on the Central Area, in particular along and in the vicinity of King Edward Avenue. Upon the completion of a new interprovincial corridor to accommodate trucks in a safe and efficient manner, the City will remove Rideau Street and King Edward Avenue from the City’s identified truck route system. See also, policy 8 in Section 3.6.6 on the Central Area. [OMB decision, June 17, 2005]
Transportation Terminals
48. The City will provide convenient road and transit access to all major inter-city passenger terminals (airport, train and bus stations).
49. The City will support the establishment of multi-modal, inter-city passenger terminals like the existing co-location of the Fallowfield VIA Rail and transitstations.
50. In industrial and commercial areas with rail access, the City will encourage the development of inter-modal terminals such as truck/rail transfer facilities that reduce the amount of freight transported by road.
|
|
Transportation Master Plan |
Chapter 7 – Public Transit
Ottawa has achieved greater levels
of transit ridership than other North American cities of its size, but must
become even more transit-oriented. The City’s growth management strategy aims
to increase transit’s peak hour share of motorized person-trips to 30%. This is
almost twice today’s level, and compares well to many large European cities.
Such an ambitious objective requires the City to improve the competitive
position of transit, relative to the automobile.
To make transit the preferred choice
of even more residents, the City must make a deliberate series of improvements
to the transit system as well as to its physical, social and economic context. To
achieve a peak hour transit modal split of 30%, all measures identified in this
chapter are required. Partial implementation will lead to inadequate
transit ridership, greater air pollution and the need for more road
infrastructure to prevent unacceptable congestion and road safety risks.
The City’s transit strategy
recognizes that substantial increases in ridership call for greater
availability, reliability, speed and comfort of transit service. All of these
will be achieved or enabled by expansion of Ottawa’s rapid transit system — the
cornerstone of Ottawa’s transit strategy. This chapter discusses a number of
key elements within the overall strategy:
7.1 Essential Supporting
Measures
A variety of measures are required
to maximize transit’s competitiveness with automobile use, as described in the
following paragraphs.
Land use planning. Through the Province of Ontario’s Planning
Act and its own Official Plan, the City has the authority to shape land use
within its borders. It controls the land uses that are permissible in various
areas, and can establish conditions on new developments including the extent,
type and location of automobile parking. Section 4.1 of this plan summarizes
many of the transit-supportive land use policies that are contained in the
City’s Official Plan.
Parking management. The availability and price of
parking are major determinants of the attractiveness of transit in reaching a
destination. Section 4.1 and Chapter 10 of this plan identify a number of
measures through which the City can limit the challenge that abundant, free
parking poses to achievement of transit ridership objectives. Examples of such
measures include limiting parking supply in the vicinity of rapid transit
stations, encouraging shared and/or structured parking to enable more compact
development patterns, and pursuing the ability to impose levies on
non-residential parking spaces.
Transportation demand management. Chapter 4 identifies a framework for
the City’s transportation demand management (TDM) program. There are a number
of TDM efforts that can help increase transit ridership, including partnerships
with various groups to raise public awareness of transit options, build positive
attitudes towards them, and promote their use.
Financial incentives. Transit faces several areas of
competitive disadvantage related to the price of travel. Free parking
(especially at workplaces) is the most significant, since it reduces the out-of-pocket
costs for most automobile trips to below the cost of a transit fare; the
considerable fixed costs of automobile ownership and operation do not influence
individual trip-making decisions. The City currently has virtually no ability
to influence the provision of free parking but will pursue the required
authority, possibly through the power to impose a levy on non-residential
parking spaces such as that being considered by the Quebec government. The City
will also urge the federal government to enforce the taxability of
employer-provided parking benefits, and to make employer-provided transit
benefits tax-exempt. The City will also consider whether transit incentives
such as a fare-free zone would help to achieve key objectives.
Intermodal integration. Transit users rely on connections
with other modes to make their trips as convenient and comfortable as possible.
City initiatives to improve modal integration include linking transit to
walking (via pathways and sidewalks), cycling (via bike parking at rapid
transit stations, and provision for transit vehicles to carry bicycles),
automobile use (via Park & Ride lots, passenger drop-off zones at rapid
transit stations) and intercity carriers (via service to air, rail and bus
terminals).
Infrastructure priority setting. The City can improve the
competitive balance between transit and automobile use by placing a higher
priority on the provision of infrastructure that improves transit service,
relative to infrastructure intended to improve service for automobile users.
Importantly, this is not an issue of rapid transit lines versus roads — in
fact, new road infrastructure can be favourable to transit, particularly when
it provides priority to transit vehicles or otherwise improves the speed and
reliability of transit operations. The phasing of new infrastructure can also
influence the travel patterns of residents in new developments, and whatever
infrastructure is needed to provide high-quality transit service to such areas
should be a high priority. Chapter 14 describes the infrastructure priorities
established by this plan.
The City will:
7.2 Transit Service Strategy
7.2.1 Route Network and
Service Standards
The City of Ottawa’s transit service
strategy is based on two major objectives:
The City’s transit route network is
structured around Ottawa’s rapid transit facilities (Transitway and O-Train)
and will evolve over the next two decades to take advantage of the expanded new
rapid transit facilities (light rail lines and Transitway extensions) described
in Section 7.4. The route network currently includes the following major
components:
In planning the level of service on
transit routes, the City must balance passenger comfort and convenience with
the need to deliver service cost-effectively. Inevitable trade-offs will
require some peak period passengers to stand on a bus, rather than sit. Outside
peak periods all passengers will normally have a seat, except over short
distances at the busiest point of the route, or on longer trips at particularly
busy times. Transit service will be provided only where it meets
Council-approved minimum cost-recovery targets. The City strives to operate
every scheduled trip on time, and to respond quickly to delays that arise due
to weather, collisions or mechanical problems.
The City will:
7.2.2 Fares and Funding
In 2002, about 57 percent of the
City’s transit operating costs were recovered from passenger fares, with the
remainder funded by property taxes. No funding for transit operations is
received from the provincial or federal governments, and the City has no local
funding source other than property taxes.
Transit fares do far more than
simply pay for transit operations. Discounts for select groups contribute to
social goals, discounts for off-peak travel can encourage better use of spare
capacity, and fare levels generally help to determine the economic
competitiveness of transit use compared to car ownership and operation.
Technologically advanced fare collection systems can take advantage of this
potential, helping the City to achieve its financial performance, modal shift
and social objectives.
The City will:
7.2.3 Service in Villages
and Rural Areas
In the rural area of Ottawa, the
City provides peak period transit service directly between downtown Ottawa and
Bearbrook, Carlsbad Springs, Cumberland Village, Kars, Manotick, Munster
Hamlet, Navan, North Gower, Notre-Dame-des-Champs, Sarsfield, and Vars. All-day
service is also provided to and from Manotick, the largest rural village.
The operating costs of transit
service to villages and rural areas are funded about equally by customer fares
and rural property taxes. The capital costs are paid from property taxes in the
rural area, with a contribution in 2003 from the provincial government toward
the expansion of the bus fleet.
Large Park & Ride lots are
located in Kanata, Orleans, South Nepean and South Ottawa, at the end of each
arm of the Transitway. Passengers from rural areas can drive to these lots,
park their cars and continue their trip by transit. Smaller Park & Ride
lots are located at City properties in the rural villages served by direct
peak-period service to downtown Ottawa.
Bus service from rural areas within
the City has also been provided by private intercity bus companies for many
years. Such services are provided from Cumberland Village, Dunrobin, Greely,
Metcalfe, North Gower, Vars, Vernon and Woodlawn. The City supports these
services by providing information to and by sharing the use of City transit
facilities such as Transitway stations.
The City will:
7.2.4 Interprovincial
Transit Service
The City’s transit route network
extends into the Hull sector of the City of Gatineau. Similarly, Gatineau’s
transit service, the Société de transport de l’Outaouais (STO) extends into
downtown Ottawa. The two transit systems are complementary and the fares are
integrated. The two systems do not compete with each other, but instead
cooperate to serve the needs of all transit passengers between Ottawa and
Gatineau.
The City will:
7.2.5 Transit Service from
Outside the City of Ottawa
For many years, private intercity
bus companies have offered bus service from towns outside Ottawa including
Alfred, Arnprior, Bourget, Carleton Place, Casselman, Embrun, Hawkesbury,
Kemptville, Limoges, L’Orignal, Merrickville, Perth, Plantagenet, Rockland,
Russell, Wendover and Winchester.
The City will:
7.3 Service for Customers with
Disabilities
Over the life of this plan, there
will be an increased demand for accessible public transit service. Ottawa’s
population of seniors will continue to rise, and medical advances will
increasingly allow persons with disabilities to lead fully independent lives.
Barriers to transit travel by these important transit customers have been
progressively removed since the 1980s, and today’s transit services are
developed with the objective of providing them with maximum accessibility. All
stations on the Transitway and O-Train are built as barrier-free as possible,
and all buses purchased since 1997 have been low-floor models able to carry
customers who use mobility devices such as wheelchairs. By about 2015, all
existing high-floor buses should have been replaced.
There will always be some people
whose disabilities prevent them from using conventional transit services for
some or all of their trips — a greater number in winter than summer, because
cold weather, snow and ice are barriers to travel. As well, until the City’s
bus fleet is entirely composed of low-floor vehicles, there will be some
passengers who require accessible service but are traveling on routes where, or
at times when, accessible service is not provided. For these passengers, the
City will continue to provide door-to-door Para Transpo service. Even though
the number of persons with disabilities is expected to increase over the next
two decades, the greater accessibility of the conventional transit fleet should
minimize the need for substantial Para Transpo service expansions.
The City will:
7.4 Transit Priority
In Ottawa, over 85% of transit
service is delivered on roads. In these mixed traffic environments, traffic
congestion increases delay and reduces reliability for transit services.
Transit priority measures can minimize the impacts of congestion through
physical, operational, and legislative means that give transit buses
preferential treatment over other vehicles. Their main objective is to improve
the competitiveness of transit, compared to the automobile, by reducing travel
times and improving service reliability. A secondary objective is either to
reduce transit operating and capital costs, or to provide more transit capacity
and service with the same resources.
Transit priority measures include
dedicated bus lanes, transit signal priority treatments, bus queue jumps,
special bus stop arrangements, and traffic management techniques such as queue
relocation. A recent Transit Priority Network Study has led to the
identification of the following policies in support of the City’s transit
priority program, and to the identification of specific projects, shown in Annex
A, that are required to create the recommended network.
The City will:
7.5 Rapid Transit System
7.5.1 Rapid Transit
Corridors
The successful implementation of an
expanded rapid transit network will be a critical element in the achievement of
the City’s transit objectives. Through the Rapid Transit Expansion Study, the
City has developed a strategic approach to expanding its rapid transit system
in response to future transportation needs.
The recommended rapid transit
network consists of an interconnected system of existing and planned corridors
in which a rapid transit facility may be located. The rapid transit network
identified on Map 5 includes about 100 kilometres of double tracks for
electrified rail, 42 kilometres of Transitway extensions, and 58 new rapid
transit stations. This network, roughly four times the size of Ottawa’s current
rapid transit system, will be implemented over the coming two decades. Annex A
identifies the rapid transit infrastructure projects that will be required.
The City will:
7.5.2 Rapid Transit
Stations
Rapid transit stations serve high
volumes of passenger transfers between transit routes, and between transit and
other travel modes such as walking, cycling, taxis and private automobiles.
They must make all transfers as convenient, comfortable and secure as possible.
Stations are also meeting points between the rapid transit system and the
surrounding community, and their environments can help to generate transit
ridership from nearby workers and residents.
Rapid transit stations are also
excellent locations for future employment opportunities. However, poor planning
of surrounding land uses can limit the ability of transit passengers to get to
and from the station in safety, security and comfort. As well, the provision of
abundant free parking for employees near rapid transit stations will negatively
affect the competitiveness of the rapid transit service. The City’s land use
policies, as contained in the Official Plan and summarized in Section 4.1 of
this plan, outline strategies to encourage integrated office and commercial
developments at selected rapid transit stations. Additional policies related to
the planning of rapid transit stations are located in Chapter 5 (walking
considerations), Chapter 6 (cycling considerations) and Chapter 10
(parking management).
The City will:
7.5.3 Park & Ride Lots
Park & Ride lots are an
important adjunct to rapid transit stations. They serve passengers arriving by
car from the rural area or adjacent municipalities, as well as passengers from
the urban area who drive to and from transit in order to meet other needs en
route, such as childcare, shopping or other personal business. This plan
envisions several new Park & Ride lots at the locations shown on Map 5.
The City will:
7.6 Transit Fleet and
Related Facilities
By the end of 2003, the City’s fleet
of conventional transit vehicles would include 12-metre standard buses (725
vehicles), 18-metre articulated low-floor buses (200 vehicles), two small buses
and three diesel rail cars. Para Transpo vehicles are provided by contracted
service providers, and include 91 lift-equipped vans, 25 cars and a number of
taxis.
7.6.1 Fleet Expansion and
Replacement
The increased transit ridership that
is expected by the City's Official Plan and this Transportation Master Plan
will require a significant investment in new transit vehicles to expand and
replace the current fleet. Four main factors will drive this need:
Annex B includes an approximate schedule for
the acquisition of transit vehicles over the life of this plan.
The City will:
7.6.2 Vehicle Propulsion
Diesel technology has powered almost
all transit vehicles for the past several decades. However, with increasing
attention paid to the impacts of emissions from conventional diesel engines,
significant research and development has occurred in the field of new
propulsion technologies. When powered with low-sulphur diesel fuel, clean
diesel engines can achieve up to a 90% reduction in several key air toxins,
compared to traditional diesel engines. Hybrid diesel-electric technologies are
now in limited use in Europe and North America, and will be more widely
deployed as they grow more reliable and affordable.
The City will:
7.6.3 Garages and
Maintenance Facilities
The City’s maintenance and storage
facilities can just accommodate today’s bus and rail fleet, with no room to
spare. Expansion of the bus and light rail fleet will require additional
storage and maintenance facilities. Annex B provides additional detail
on these capital project requirements.
The City will:
7.7 Transit Safety and
Security
In recent years, input from transit
customers and employees have made safety and security issues a high priority
for transit systems across North America. Transit systems are working to foster
greater safety and security through innovative physical and operational
measures, as well as through public outreach. Safety and security must maintain
a high priority if the City is to achieve its transit objectives.
The City will: