™


CNG
Bus Option
Evaluation
for
the City of Ottawa
Final
Report
January 2007
CNG
Bus Option
Evaluation
for
the City of Ottawa
Final
Report
by
Pierre
Ducharme, DSA
William
Bugyra, LLB, MBA
Roy
Duncan, P.Eng.
David
Martin, P. Eng.
Foreword
This Study was funded by the City of Ottawa with a contribution from the Members of the CNG Consortium. It was managed by Mr. Ken Wetzel, P.Eng., Technical Services Manager for the City of Ottawa.
The research for this Study was undertaken during the months of May, June and July 2006 as the original publication date was set for September 2006. While the publication date was delayed, the Reader should keep in mind that the information contained herein is limited to material available prior to the intended date of publication.
Table of Contents
Foreword___________________________________________________ 2
Table of Contents____________________________________________ 3
Executive Summary___________________________________________ 8
1 Introduction_____________________________________________ 13
1.1 The Context of the
Study_________________________________ 13
1.2 The Objectives of
the Study______________________________ 14
1.3 The Mandate of
sustain-ABILITY™___________________________ 14
1.3.1 Original Mandate___________________________________________________ 14
1.3.2 Changes to the Original Mandate______________________________________ 14
1.4 The Methodology Used
by sustain-ABILITY™___________________ 15
1.4.1 Original Methodology_______________________________________________ 15
1.4.2 Changes to the Original Methodology__________________________________ 16
1.4.3 Note regarding reference documentation_______________________________ 16
2 The CNG Consortium
Case for CNG Buses in Ottawa_____________ 17
2.1 Description of the
CNG Bus Option from a Financial Perspective___ 17
2.2 Strengths and
Weaknesses of the Consortium Business Case for CNG Buses in Ottawa____________________________________________ 19
2.2.1 Logical Structure and Data Accuracy___________________________________ 19
2.2.2 Completeness_____________________________________________________ 20
2.2.3 Validity of Data____________________________________________________ 21
2.2.4 Accuracy of the Original Conclusions___________________________________ 22
2.3 Description of the
CNG Option from an Environmental Perspective 22
2.3.1 Consortium Position________________________________________________ 22
2.3.2 City of Ottawa Staff Position_________________________________________ 22
2.3.3 Supporting Background Information___________________________________ 23
2.4 Strengths and
Weaknesses of the Environmental Case for CNG Buses in Ottawa___________________________________________________ 25
2.4.1 Logical Structure___________________________________________________ 25
2.4.2 Completeness_____________________________________________________ 25
2.4.3 Validity of Data____________________________________________________ 26
2.4.4 Accuracy of Conclusions_____________________________________________ 31
3 The Diesel Electric
Bus Business Case in Ottawa________________ 33
3.1 Description of the
DEH Bus Option from a Financial Perspective___ 33
3.2 Strengths and
Weaknesses of the DEH Case in Ottawa__________ 34
3.2.1 Logical Structure___________________________________________________ 34
3.2.2 Completeness_____________________________________________________ 35
3.2.3 Validity of Data____________________________________________________ 35
3.2.4 Accuracy of the Original Conclusions___________________________________ 37
3.3 Description of the
Diesel Electric Hybrid Option from an Environmental Perspective___________________________________ 37
3.4 Description of the
DEH from an Environmental Perspective______ 37
3.4.1 City Staff Position__________________________________________________ 37
3.4.2 Completeness_____________________________________________________ 37
3.4.3 Validity of Data____________________________________________________ 38
3.4.4 Accuracy of Conclusions_____________________________________________ 43
4 Reconstructed
Business Cases_______________________________ 44
4.1 The CNG Business
Case___________________________________ 44
4.1.1 Capital Costs______________________________________________________ 45
4.1.2 Other Soft, Non-Recurring Costs______________________________________ 54
4.1.3 Summary
of Capital Costs___________________________________________ 55
4.1.4 Operating Costs____________________________________________________ 55
4.1.5 Renewable Fuel Option______________________________________________ 65
4.2 The DEH Business
Case___________________________________ 71
4.2.1 Capital Costs______________________________________________________ 72
4.2.2 Operation Costs____________________________________________________ 73
4.2.3 Renewable Fuel Options_____________________________________________ 75
5 Review of the
Environmental Case___________________________ 77
5.1 Emissions of CNG
buses___________________________________ 77
5.1.1 Compliance with Standards__________________________________________ 77
5.1.2 Performance______________________________________________________ 77
5.1.3 Greenhouse Gases__________________________________________________ 81
5.2 Renewable Fuel
Options_________________________________ 82
5.3 Emissions of DEH
Buses___________________________________ 83
5.3.1 Compliance with Standards__________________________________________ 83
5.3.2 Performance______________________________________________________ 83
5.4 Renewable Fuel
Options (Biodiesel in DEH Buses)______________ 84
5.4.1 Biodiesel__________________________________________________________ 84
5.4.2 Ultra Low Sulphur Diesel_____________________________________________ 86
5.5 Fleet Emissions
Reduction Strategy_________________________ 89
6 Other Issues Related
to Alternate-Fuel Buses in Ottawa_________ 91
6.1 Impact
of New Technologies on CNG and DEH Buses____________ 91
6.1.1 Emissions Control Technologies_______________________________________ 91
6.1.2 Impact on Emissions and Fuel Economy________________________________ 96
6.1.3 Getting to 2010____________________________________________________ 98
6.1.4 Summary_________________________________________________________ 99
6.2 Procurement
of Renewable Fuel Sources in Ottawa___________ 100
6.2.1 HCNG___________________________________________________________ 100
6.2.2 Biogas___________________________________________________________ 100
6.3 Future
Considerations Regarding the Use of New Buses in Ottawa 101
6.3.1 General__________________________________________________________ 101
6.3.2 Evolution of the CNG Technology_____________________________________ 101
6.3.3 Evolution of the Diesel Electric Technology_____________________________ 102
6.4 Common
Practices of Transit Systems Adopting Alternate Technologies 107
6.5 National and International Transit
Acquisition Trends__________ 108
6.6 Other
Considerations Regarding the Adoption of Alternate Technologies______________________________________________ 109
6.7 Pathway to a
Zero-Emission Fleet_________________________ 110
7 Summary of Findings
and Conclusions_______________________ 114
7.1 Financial Components
of the CNG and DEH Options: The Lifecycle Cost of CNG and DEH Buses at the City
of Ottawa_____________________ 114
7.1.1 Summary of Financial and Operational Hypotheses______________________ 114
7.1.2 Calculation Results for the CNG Option________________________________ 119
7.1.3 Calculation Results for the DEH Option________________________________ 120
7.1.4 Sensitivity of the Results___________________________________________ 121
7.2 Environmental
Components of the CNG and DEH Options: Environmental Impact of Using
Alternate-Fuel Buses in Ottawa______ 122
7.2.1 Environmental Performances________________________________________ 122
7.2.2 Consistency with FERS_____________________________________________ 124
8 Recommendations________________________________________ 127
8.1 Financial
Considerations_________________________________ 127
Appendices
Appendix A
Literature Review
Appendix B
List of Responding Transit Systems
Appendix C
Bibliography
Appendix E
Acronyms and Abbreviations
Appendix F
About the Authors
Tables
Table 1 - Total Lifecycle Cost
of CNG Buses vs. Conventional Diesel Buses................... 9
Table 2 - Total Lifecycle Cost of DEH Buses vs. Conventional Diesel Buses................... 9
Table 3 - Operating Costs Forecasted by the Consortium for CNG Buses.................... 18
Table 4 - Lifecycle Costs Forecasted by the Consortium for CNG buses...................... 18
Table 5 - Comparative NOx Emissions Data...................................................... 28
Table 6 - Emissions of CNG vs. Diesel Buses
at WMATA....................................... 29
Table 7 - Intermediate Average Annual Costs for Transit Buses in 2010..................... 31
Table 8 - Operating Costs Forecasted by the Consortium for DEH Buses..................... 33
Table 9 - Lifecycle Costs Forecasted by the Consortium for DEH Buses...................... 34
Table 10 - Emissions of DEH vs. Diesel Buses.................................................... 39
Table 11 - Emissions of DEH vs. Diesel Buses at King County................................... 40
Table 12 - GHG Emissions in CNG
Transit Buses – 2003......................................... 41
Table 13 - GHG Emissions in CNG
Transit Buses - 2010......................................... 41
Table 14 - GHG Emissions in DEH
Transit Buses – 2003......................................... 42
Table 15 - Fuelling Station Cost
Estimates........................................................ 46
Table 16 - City of Ottawa
Transit Garage Comparison.......................................... 51
Table 17 - Garage CNG Upgrading
Costs Parameters............................................ 52
Table 18 - CNG Garage Upgrading
Costs (including taxes)...................................... 54
Table 19 - Capital Cost Summary
for CNG Case.................................................. 55
Table 20 - Forecasted
Electricity Price Increases................................................. 60
Table 21 - Maintenance Costs, Ontario Transit
System, 2001-2005........................... 62
Table 22 - NYC Maintenance
Operations Economics.............................................. 62
Table 23 - WMATA Bus Maintenance
Costs........................................................ 63
Table 24 - Operating Cost
Summary – CNG Fleet................................................. 65
Table 25 - Hydrogen Prices 2007
– 2027 (in $/DLE).............................................. 69
Table 26 - HCNG Lifecycle Costs................................................................... 71
Table 27 - Capital Cost Summary
– DEH Fleet..................................................... 73
Table 28 - Annual Operating Cost
Summary – DEH Fleet......................................... 75
Table 29 - Operating Cost
Summary – Bio-DEH Fleet............................................. 76
Table 30 - Emissions Reduction
in HCNG Bus..................................................... 83
Table 31 - Potential Emissions Reduction from Use of B20 Biodiesel Fuel..................... 85
Table 32 - GHG Reductions from
Different Sources of Biodiesel............................... 85
Table 33 - Emissions Impact of
ULSD.............................................................. 87
Table 34 - Emissions Control Technologies........................................................ 91
Table 35 - Typical Operational
Changes Associated with Alternate-Fuel Buses.............. 107
Table 36 - Transit Buses in Service in the
United States....................................... 109
Table 37 - Two Pathways to Fuel
Cell-Powered Buses........................................... 111
Table 38 - Forecasting
Assumptions for Main Bus Types....................................... 115
Table 39 - NRC and
sustain-ABILITY™ Base Cases for Diesel Buses........................... 117
Table 40 - Annual Variation in
Diesel Prices 2007-2028........................................ 118
Table 41 - Total Lifecycle Cost
of CNG Buses vs. Conventional Diesel Buses................ 119
Table 42 - Total Lifecycle Cost
of DEH Buses vs. Conventional Diesel Buses................ 120
Table 43 - Emissions of CNG vs. Diesel Buses at WMATA...................................... 123
Table 44 - Diesel vs. CNG Emissions on FTP
Transient Cycle.................................. 123
Table 45 - Emissions of DEH vs.
Diesel Buses................................................... 124
Table 46 - Risk Factors
Associated with Alternate Bus Technologies Costs.................. 128
Diagrams
Diagram 1 - Evolving
Emissions Standards................................................... 23
Diagram 2 - Key Characteristics – Diesel vs. NG............................................. 24
Diagram 3 - Key Characteristics – Diesel vs. NG............................................. 24
Diagram 4 - Emissions Controls in 2007 Diesel and NG Engines........................... 30
Diagram 5 - Figure Key Characteristics – Diesel vs. NG..................................... 30
Diagram 6 - Possible Location of Compressor Unit at St-Laurent South.................. 47
Diagram 7 - Ideal Location of Compressor Unit at Merivale................................ 48
Diagram 8 - Recent Natural Gas Prices (2003-2006), in USD............................... 56
Diagram 9 - Natural Gas Prices................................................................ 57
Diagram 10 - Natural Gas Price Variations, 2007-2030 (2007=100)......................... 58
Diagram 11 - CNG Bus Maintenance Costs in $ per Kilometre............................... 64
Diagram 12 - Sources of Hydrogen for HCNG blend........................................... 66
Diagram 13 - In-Service Fuel Economy......................................................... 70
Diagram 14 - Sensitivity
of Lifecycle Cost..................................................... 79
Diagram 15 - Canada’s Greenhouse Gas Emissions........................................... 81
Diagram 16 - HCNG Emissions.................................................................. 82
Diagram 17 - Particulate Filters................................................................. 93
Diagram 18 - Exhaust Gas Recirculation....................................................... 94
Diagram 19 - NOx Compliance Pathways........................................................ 99
Diagram 20 - Fuel Road Map................................................................... 125
Executive Summary
In June 2006,
sustain-ABILITY™ was retained by the City of Ottawa to review the CNG Option, a proposal made by a
Consortium lead by Enbridge Gas Distribution that includes Clean Energy
Fuels, Cummins Westport Inc. and the Canadian Natural Gas Vehicle Alliance. The
objectives of this evaluation are to utilize a reconstructive approach …
Ø to
provide an independent and objective assessment of the CNG Option;
Ø to specifically
validate the financial and environmental components of the CNG Option; and,
Ø to
provide a final report and presentation documenting the findings and
recommendations.
In August 2006, a number of changes were made to
the original mandate to include an evaluation of Diesel-Electric Hybrid (DEH) technologies to provide a comparative
baseline and to evaluate a limited number of issues that were outside the
original scope of work. The evaluation and analysis in this Report were in many
cases constrained or limited by the scope of work and these constraints and
limitations were noted with the Steering Committee throughout the process. This
Report should, therefore, be read in the context of the sustain-ABILITY™
mandate. For clarity, areas where these constraints impacted the conclusions
reached in this report are highlighted, and recommendations for further
analysis are included.
The reconstruction of the CNG business case demonstrates that the Consortium estimates of cost savings generated over the diesel alternative are inaccurate for several reasons:
Ø A logical flaw in their models (the use of $/km data from other transit systems);
Ø Missing cost elements based on parameters of study (such as the cost of adapting transitways to CNG); and,
Ø Invalid capital costs based on parameters of study (the cost of adapting garages to CNG and providing fuelling stations for example).
According to sustain-ABILITY™’s calculations, the savings of $36 million quoted in the business case presented to Council in 2005 would not occur if CNG buses are deployed according to existing deployment patterns from two different garages in Ottawa rather than optimising their deployment. Under this scenario, total costs would increase by $31.2 million or 10.3% over the use of conventional diesel buses on the same routes.
Table 1 - Total Lifecycle Cost of CNG Buses vs. Conventional Diesel Buses
|
Fleet Average |
DIESEL |
CNG |
Diesel vs. CNG |
|
|
|
|
|
$$$ |
% |
|
Capital Investment Costs |
|
|
|
|
|
Bus acquisition |
90,108,581 |
95,366,244 |
5,257,663 |
5.83% |
|
Building and infrastructure cost |
0 |
50,207,748 |
50,207,748 |
|
|
Other soft, non-recurring costs |
0 |
692,074 |
692,074 |
|
|
Total capital costs: |
90,108,581 |
146,266,066 |
56,157,485 |
62.32% |
|
|
|
|
|
|
|
Operating Costs |
|
|
|
|
|
O&M cost (excluding fuel) |
192,698,598 |
193,902,965 |
1,204,366 |
0.62% |
|
Fuel cost |
161,193,810 |
112,051,396 |
-49,142,414 |
-30.49% |
|
Electricity (Compressor) |
0 |
6,293,399 |
6,293,399 |
|
|
Total operating costs: |
353,892,408 |
312,247,760 |
-41,644,649 |
-11,77% |
|
|
|
|
|
|
|
Non-Discounted Total Cost |
444,000,989 |
458,513,826 |
14,512,837 |
3.27% |
|
|
|
|
|
|
|
Discounted Total Cost |
302,108,366 |
333,267,256 |
31,158,891 |
10.31% |
Source: Sustain-ABILITYTM, 2006
It should, however, be noted that a number of assumptions had to be made in the absence of an Ottawa field test of CNG buses and that the Model Year (MY) 2007 will bring significant changes to both diesel and CNG engine technologies.
The review of the DEH business case for the City of Ottawa provided the following results.
Table 2 -
Total Lifecycle Cost of DEH Buses vs.
Conventional Diesel Buses
|
Low Speed / Frequent Stops |
DIESEL |
DEH |
Diesel vs. DEH |
|
|
|
$$$ |
% |
||
|
Capital Investment Costs |
|
|
|
|
|
Bus acquisition |
90,108,581 |
139,816,714 |
49,708,134 |
55.16% |
|
Building and
Infrastructure cost |
0 |
1,763,264 |
1,763,264 |
|
|
Other soft, non
recurring costs |
0 |
955,283 |
955,283 |
|
|
Total capital costs: |
90,108,581 |
142,535,262 |
52,426,681 |
58.18% |
|
|
|
|
|
|
|
Operating
Costs |
|
|
|
|
|
O&M Cost
(excluding fuel) |
246,834,752 |
182,890,809 |
-63,943,943 |
-25.91% |
|
Fuel Cost |
223,774,936 |
163,361,122 |
-60,413,815 |
-27.00% |
|
Battery
replacement cost |
0 |
25,481,952 |
25,481,952 |
|
|
Other costs |
0 |
5,078,268 |
5,078,268 |
|
|
Total operating costs: |
470,609,689 |
376,812,151 |
-93,797,537 |
-19.93% |
|
|
|
|
|
|
|
Non discounted Total Cost |
560,718,269 |
519,347,413 |
-41,370,856 |
-7.38% |
|
|
|
|
|
|
|
Discounted Total Cost |
373,459,512 |
365,250,148 |
-8,209,365 |
-2.20% |
Source: Sustain-ABILITYTM, 2006
For the purpose of this Report, sustain-ABILITY™ was instructed to assume that DEH buses would be assigned to routes where they perform best. The substitution of conventional buses used on low-speed/frequent stops routes in the City of Ottawa would provide the City with savings of $8.2 million dollars (2.2%) as opposed to the $59 million savings anticipated by City staff. This difference is mainly attributable to the fact that the City will not benefit from any subsidy if it acquires DEH buses[1], the expectation that 2007-compliant engines will be less fuel efficient, and that certain increases are anticipated in the cost of diesel fuel. If DEH buses were assigned according to existing deployment patterns, i.e. including less than optimal routes, savings would be further reduced.
The parameters and assumptions used and possible variation of many inputs can influence the outcome of the models reconstructed by sustain-ABILITY™ for the purposes of this study. Unfortunately, performing quantitative sensitivity analysis is beyond the scope of this study. It must be understood however that the 2.2% saving calculated for DEH buses falls well within the margin of error of sustain-ABILITY™’s calculations, in part because the source data provided to sustain-ABILITY™ by the NRC was “of LOW quality.[2]”
The analysis in the Report is also qualified by the fact that certain assumptions had to be made with respect to the potential impact of significant changes in both CNG and diesel engine technologies in MY 2007. The mandate was expanded to include a discussion of expected implications of 2007 technology changes but data on actual performance of 2007 platforms is not yet available.
From an environmental perspective, the case presented in the CNG Option was broadly accurate but incomplete. While both CNG and diesel technologies are designed to meet regulatory requirements, CNG engines are being designed for certification to 2010 levels in 2007, while diesel engine manufacturers are taking advantage of provisions allowing them to phase-in emissions reductions by meeting 50% of the 2010 requirements in 2007. The Consortium case emphasized performance relative to regulated pollutants, while the City’s Fleet Emission Reduction Strategy and City staff analysis focused on CO2 emissions. Additional analysis with respect to CO2 emissions was inconclusive, due to the paucity of quality data and wide variability in the data that was available. Additional constraining factors included the restriction of the analysis to post-2002 CNG technology and restricted scope relating to duty cycles to be considered.
Limited field test data was available for MY 2001 diesel electric buses from the NRC study and sustain-ABILITY™ chose the best results from this study as a basis for comparing DEH buses to CNG buses. Emissions data from previous dynamometer testing of MY 2004 Orion/BAE and MY 2002 New Flyer/Allison DEH platforms was utilized in the NRC study. This data was utilized by sustain-ABILITY™ together with data from the most credible field-testing of newer model DEH buses. Emissions data from the most credible field-testing of newer model CNG engines was utilized and data from a number of other reports was considered. The data suggests that actual performance will vary significantly with engine/chassis combination and duty cycle such that either may perform comparatively better depending on the circumstances, and either may perform only marginally better than clean diesel if not deployed optimally. While DEH buses perform particularly well in a low speed / frequent stops duty cycle, CNG buses offer the greatest benefits in duty cycles characterised by higher speeds / fewer stops. The economic and environmental performance of either DEH or CNG buses will be directly correlated to how optimally they are deployed. Sub-optimal deployment will have significant financial implications and could significantly diminish the potential environmental benefit of investment in these technologies.
Recommendations
Over the anticipated 18-year life of the new buses the City of Ottawa intends to buy, conventional diesel buses would cost between $302 million (if deployed across all routes) and $373 million (if deployed only on low-speed / frequent-stop routes). In that same timeframe, CNG buses deployed across all routes would cost $333 million and DEH buses $365 million (if deployed on low-speed / frequent-stop routes only). These expenditures represent the total net discounted costs calculated by sustain-ABILITY™.
From a strictly financial viewpoint, the lowest cost option for the City of Ottawa in 2007 remains diesel buses[3].
Also from a strictly financial viewpoint, If the City requires buses to operate on their lowest speed / most frequent-stop routes, then it should select DEH buses to perform that duty as long as these buses remain deployed on such routes for their entire lifespan. On the other hand, should the City require buses for average routes or rural ones, conventional diesel buses offer the cheapest alternative. Total disbursements for CNG buses on such routes is however smaller than the cost of deploying DEH buses on low-speed / frequent-stop routes.
The possibility and impact of procuring both the DEH and CNG technologies should be investigated. In this event, the cost of deploying each fleet out of a single garage would be cheaper and, ideally, CNG buses should be located in a new facility built to accommodate the later introduction of hydrogen-fuelled buses.
The introduction of DEH buses in the Ottawa fleet represents the least «disruptive» scenario among those examined by sustain-ABILITY™ in the context of this study because infrastructural changes would be minimal. The use of electric drives in future generations of transit buses is almost certain and the experience gained from working with DEH buses should provide a lasting return on investment.
The adoption of CNG buses, on the other hand, is a bolder step towards an eventual hydrogen/fuel cell fleet. It offers the advantage of the use of an abundant Canadian fuel source at a more predictable price in the future (at least for the next ten years) thereby sheltering the City from potential sharp increases in operating costs that may result from unpredictable oil prices.
The sustain-ABILITY™ Report contains limitations resulting from the scope of the mandate given to sustain-ABILITY™ and from the availability of data in some areas. The impact of these limitations on the level of precision of the quantitative and qualitative conclusions of the report could be material.
Following are the recommendations outlined by sustain-ABILITY™ in the last chapter of this study that would most improve the level of precision of its calculations:
- Refine the comparative diesel base case for both technologies to ensure a fair comparison.
- Adequately characterize Ottawa’s duty cycle.
- Perform quantitative sensitivity analysis of the results and determine the impact of alternative scenarios relating to operation and maintenance costs.
- Perform a detailed study of the impact of 2007 compliance on maintenance costs for DEH buses.
- Test MY 2007 CNG buses in-service in Ottawa assigning the vehicles to routes matching the same variety of duty cycles studied by the National Research Council in its study of DEH buses for Ottawa.
- Participate in testing of MY 2007 diesel and DEH platforms to assess the impact of technology changes.
- Conduct gas flow analysis on St-Laurent South and St-Laurent Station (at the very least) to ascertain facilities upgrade costs.
The City of Ottawa can derive maximum benefit from the above recommendations by incorporating a long-term strategic plan into its considerations. Such a plan would entail the development of a roadmap (ten years or more) to a zero-emission fleet in the overall context of public transportation in Ottawa. The selection of the optimal pathway would then be undertaken within the parameters set in the roadmap.
1 Introduction
1.1
The
Context of the Study
In
2002, the City of Ottawa (the “City”) adopted a Fleet Emissions Reduction
Strategy (FERS) as a part of the City’s efforts to prioritize spending to
improve environmental conditions. The
FERS was revisited and updated in 2004. At that time, CNG was not the preferred
alternative as a mid-term solution in moving toward the prime strategic
objective of zero-emission buses and the City planned to pursue other options,
including diesel-electric
hybrid, for its transit bus fleet.
In the
summer of 2004, Enbridge Gas Distribution approached the City of Ottawa with the
opportunity to review updated information regarding CNG buses.
Efforts
were made through 2004 and 2005 to determine if there were opportunities for
the use of CNG in the transit fleet.
Ultimately a group of CNG industry partners referred to as the Consortium
(Clean Energy Fuels [CE], Cummins Westport Inc. [CWI], the Canadian Natural Gas
Vehicle Alliance and Enbridge Gas Distribution [Enbridge]) brought forward a
business case identifying the potential for a $36 million net present value
(NPV) savings in favour of CNG buses over diesel buses. A presentation in
August 2005 to the City Manager of the Consortium case was focused on four
areas:
1.
Financial
2.
Reliability
3.
Environmental
4.
Directional
Following
a further exchange of information, the City undertook a review of the business
case and reported to the Transportation Committee and Council on the
matter. Report ACS2005-PWS-FLT-0004
resulted in the approval of the following resolution of Council on November 30th,
2005:
1. That the matter be referred to Staff to
arrange a cost-shared independent evaluation of the Compressed Natural Gas
(CNG) Option, both from a financial consideration and from an emissions
perspective, and to report back to Committee by March 2006.
2. That the City Staff explore with the
Consortium and the National Research Council’s (NRC’s) Surface Transportation
Technology Test Facility, the feasibility of running a technical comparison of
CNG Buses with Hybrid Diesel Electric Vehicles for cost effectiveness.
3. That for 2006 the planned purchases of 63
buses be limited to fuel efficient diesel.
The cost-shared
independent evaluation of the Compressed Natural Gas Option was entrusted to
sustain-ABILITY™ following a formal bid process conducted by the City.
1.2
The
Objectives of the Study
In May 2006, the services of
sustain-ABILITY™ were retained by the City to conduct an independent review of
the CNG Option proposing CNG technology for future transit fleet
acquisitions. The objectives of this
evaluation were …
Ø To
provide an independent and objective assessment of the CNG Option;
Ø To
specifically validate the financial and environmental components of the CNG
Option; and,
Ø To
provide a final report and presentation documenting the findings and
recommendations.
More specifically, the acquisition of 226
40-foot buses was to be considered by sustain-ABILITY™.
1.3
The
Mandate of sustain-ABILITY™
1.3.1 Original Mandate
In the start-up meeting of the project, the sustain-ABILITY™ mandate was defined as follows:
Ø sustain-ABILITY™ was to review the financial and environmental aspects of the NGV[4] Option only. The reliability and directional components (relating to the pathway to hydrogen) of the Consortium case and the review/analysis of the diesel and diesel-hybrid options were specifically excluded from the scope of this mandate.
Ø sustain-ABILITY™ was to use a reconstructive approach to analysing the models used to support the NGV Option[5], and to review the business case presented by the Consortium to determine …
o The logical structure used by the Consortium in presenting their business case;
o The completeness of the business case;
o The validity of the business case; and
o The accuracy of the conclusions of the business case.
Only data that relates to newer model engines (post-2002) and CNG buses were to be considered for this analysis. The stakeholders agreed that issues related to earlier model CNG engines were not representative of the products currently being sold.
The City and the Consortium further agreed that all subsidies, taxes and other externalities would be left out of sustain-ABILITY™’s analysis.
The Consortium provided a presentation to Ottawa Council on August 10th, 2005. That presentation, supporting documentation and the cost model developed by Enbridge to support the case, constitute the NGV Option under consideration.
1.3.2 Changes to the Original Mandate
In the course of conducting this study, the Steering Committee decided that the mandate of sustain-ABILTY™ would be expanded to enable a comparison of DEH and CNG technologies and to somewhat broaden the general scope of the analysis. The Steering Committee agreed to amend the scope of work as follows:
Ø Adjustments were made to the reference
prices of CNG buses to ensure their relevance to the City’s specific requirements.
Ø The Urban Dynamometer Driving Schedule
(UDDS) duty cycle was to be used as a common basis for comparing both
technologies from an emissions perspective, rather than characterising different duty cycles that may apply to Ottawa based on
the NRC Report[6] for DEH and
discussing the potential impact on emissions and fuel economy under these duty
cycles based on results from available secondary data sources.
Ø Data on 2005 buses was used to estimate as
best as possible the fuel consumption and emissions of both technologies (CNG
and Diesel Electric Hybrid [DEH]) for 2007 vehicles based on an agreed upon
duty cycle. Manufacturer claims with
respect to plans for 2007 certification were verified to the extent possible
through testing data and educated third-party opinions.
Ø Analysis of the impact on emissions and
fuel economy of various emission control technologies (Ultra Low Sulphur
Diesel, Diesel Particulate Filters with EGR and SCR) was performed based on
manufacturers’ representations, available secondary data sources and
supplemental answers from transit operators. The expected impact of the
introduction of new technologies to ensure CNG and diesel engines meet 2007 and
2010 standards has been included in the report.
Ø Additional field research to ensure costs
obtained from outside sources are as comparable as possible to Ottawa’s
situation (including duty cycle) for CNG buses. Adjustments have been made for
2007 models based on the results of other alternatives presented above.
Ø Updating of the cost of maintaining 2007
DEH buses using the best available data from recent implementations of DEH
buses in service, adjusting for lifecycle increases in these costs over time.
Ø Development of updated prices for CNG
fuelling stations based on a quote provided by Clean Energy that includes
station maintenance costs.
Ø Verification of the cost of fuelling
station maintenance quoted by Clean Energy against field data.
Ø Discussion of the possibility of using
renewable or waste sources of methane and hydrogen without any attempt to
quantify its impact.
Ø Factoring of Ottawa-specific factors (such
as the specific structure of the buildings) in estimates regarding the cost of
upgrading Ottawa’s maintenance facilities. Adjustments were made to field data
information to take such factors into account.
Ø Verification of Ontario’s building code to
determine whether the changes planned to the facilities for DEH buses require
the City to bring HVAC systems to current standards. The results were used to adjust the comparative costs of adapting
the City’s maintenance facilities for both technologies.
Ø Consultation of codes and standards to
determine whether three (3) stations (St-Laurent2, Riverside and
Queensway) used by City buses require modifications if the City acquired CNG
buses. The cost of ventilating these
stations has been included in the CNG business case.
Ø Further
investigation of the use of biodiesel in DEH buses and hydrogen in CNG buses to
outline the general economic
and environmental impact of using these alternate fuels.
Ø General discussion of the pathway to
hydrogen buses included in the report (without any attempt to quantify its
implications) to provide a long-term perspective to the reader.
1.4
The
Methodology Used by sustain-ABILITY™
1.4.1 Original Methodology
sustain-ABILITY™ developed a specific methodology based on the Request for Proposal (RFP) submitted by the City of Ottawa and the proposed project team's expertise and experience in the field.
sustain-ABILITY™ proposed a Reconstructive Approach consisting of a close examination of the CNG Option of the Consortium’s Business Case submitted by the Stakeholders in order to …
Ø ascertain its logical consistency;
Ø determine its completeness;
Ø validate input data used in the Business Case; and,
Ø verify the accuracy of the calculations supporting the arguments.[7]
1.4.2 Changes to the Original Methodology
In the course of the project, the Stakeholders agreed that the level of precision of the Study should be increased in certain areas to provide a better basis for comparing the two competing technologies. Additional research was therefore conducted to provide the complementary information described in section 1.3.2.
The additional information enabled a comparative analysis of the two competing technologies (CNG and DEH). It also provided the data necessary to evaluate variations on the basic technologies, such as adding hydrogen to CNG and using biodiesel fuel in DEH, and to comment on the advantages of each technology in the context of the prime strategic objective of zero-emission buses.
1.4.3 Note regarding reference documentation
A significant amount of information was provided by City Staff to sustain-ABILITY™ in the course of this Study, including the report of a study performed by the National Council of Canada . sustain-ABILITY™ did not gather data directly, nor has the accuracy of the data provided by the City for the purpose of this study, or the study conducted by the NRC, been verified.
With the exception of updating minor elements related to cost information contained in the NRC Report, the scope of sustain-ABILITY™’s mandate did not include a critical review of the study. Therefore, the accuracy of the NRC findings was not questioned and much of its content was used as the basis for comparing the performance of DEH buses to that of CNG buses.
2 The CNG Consortium Case for CNG Buses in Ottawa
2.1
Description
of the CNG Bus Option from a Financial Perspective
The Consortium provided sustain-ABILITY™ with two different models (dated August 2005) as well as two updates of those models (dated December 2005). The incremental costs used in the models were based on absolute numbers in one case (“The Pierce-based model”) and on a 20% increase over regular Diesel O&M costs (“The 20% model”).
Both models are based on common working
hypotheses:
Ø The
City of Ottawa will purchase 226 buses (68 in 2007, 80 in 2008 and 78 in 2009);
Ø The
life of a bus is 18 years;
Ø The
buses are to be maintained and stored at a single facility;
Ø Each bus operates 75,000 kilometres per year;
Ø A
discount factor of 6.75% was used for the Net Present Value analysis;
Ø The CA$ to US$ exchange rate used was 1.40 $ Canadian = 1 $ US.
The following sources were used to form the basic assumptions of the CNG Consortium cost models:
|
Ø
Fuel
Consumption of CNG buses |
Ten
Years of Compressed Natural Gas (CNG) Operations at SunLine Transit Agency April 2003 — December 2004 K. Chandler Battelle, Columbus NREL/SR-540-39180 |
|
Ø Natural Gas Prices |
Enbridge
Rate Sheet dated April 1, 2005 |
|
Ø Facilities Upgrade |
Bus Facilities Requirements
Study for Alternative Fuel Buses, Final Draft Report prepared for the Toronto Transit
Commission January 19, 2005 McCormick Rankin Corporation 2005 |
|
Ø Fuelling Infrastructure |
Idem (McCormick Rankin Corporation 2005) |
|
Ø Operations & Maintenance Costs |
Pierce Transit: The Future
is Clear: 100% CNG fleet Cummins Westport Promotional Literature (Undated) |
The key modelling assumptions made by the Consortium regarding CNG buses are the following:
|
Ø
Fuel
Consumption of CNG buses |
3.08 (Sunline)
to 3.10 (TTC) miles per diesel gallon equivalent. The Consortium used 0.76
diesel litres equivalent per km (or 3.1 miles per diesel gallon equivalent). |
|
Ø
CNG Prices |
Natural gas is
$0.26/km. The electricity required by the fuelling station adds 1.6 cents/km
for a total CNG fuel price of $0.277/km. |
|
Ø
Facilities
Upgrade |
Average cost to
upgrade the facilities for CNG buses and fuelling is $13.3 million |
|
Ø
Operations
& Maintenance Costs |
US$0.16 per mile
(Pierce) or CA$0.14 per km |
|
Ø
Compressor
Maintenance Costs |
$0.03 per km |
The financial analysis of operating costs supplied by the Consortium is presented following.
Table 3 - Operating Costs[8] Forecasted by the
Consortium for CNG Buses
|
The Pierce-based Model |
August and December 2005 |
||
|
Cost Category |
$ per km |
$ per |
Total Fleet Cost
($) |
|
O&M Cost (excluding fuel) |
0.14 |
10,500 |
2,373,000 |
|
Fuel Cost |
0.28 |
20,775 |
4,695,150 |
|
Compressor Maintenance Cost |
0.03 |
2,250 |
508,500 |
|
Total Cost |
0.45 |
33,525 |
7,576,650 |
Source: CNG Consortium, 2005
|
The 20% Model |
August and December 2005 |
||
|
Cost Category |
$ per km |
$ per |
Total Fleet Cost
($) |
|
O&M Cost (excluding fuel) |
0.23 |
17,100 |
3,864,600 |
|
Fuel Cost |
0.28 |
20,775 |
4,695,150 |
|
Compressor Maintenance Cost |
0.03 |
2,250 |
508,500 |
|
Total Cost |
0.54 |
40,125 |
9,068,250 |
Source: CNG Consortium, 2005
On a lifecycle basis that includes capital costs, the Consortium forecasted the following savings when comparing CNG buses to conventional Diesel buses:
Table 4 -
Lifecycle Costs Forecasted by the
Consortium for CNG buses
|
The Pierce-based Model |
August 2005 |
December 2005 |
|
Capital Investment |
|
|
|
40-foot bus savings1 ($) |
42,940,000 |
4,016,020 |
|
Building and Infrastructure incremental
cost ($) |
(13,500,000) |
(13,500,000) |
|
Operating Cost Savings ($) |
81,766,800 |
81,766,800 |
|
Net Savings of CNG Over
Diesel ($) |
111,206,800 |
72,282,820 |
|
Discounted (6.75%) Savings
of CNG Over Diesel ($) |
73,124,043 |
36,716,490
|
1 Assuming subsidies from the Government of
Ontario for urban transit vehicles and alternate fuel buses.
|
The 20% Model |
August 2005 |
December 2005 |
|
Capital Investment |
|
|
|
40-foot buses savings* ($) |
42,940,000 |
4,016,020 |
|
Building and Infrastructure incremental
cost ($) |
(13,500,000) |
(13,500,000) |
|
Operating Cost Savings ($) |
54,918,000 |
54,918,000 |
|
Net Savings of CNG Over
Diesel ($) |
84,358,000 |
45,434,020 |
|
Discounted (6.75%) Savings
of CNG Over Diesel ($) |
57,868,486
|
21,460,933 |
Source: CNG Consortium, 2005
* Assuming subsidies from the Government of
Ontario for urban transit vehicles and alternate fuel buses.
The variations between the August and December forecasts in both models occur as a result of a change in savings related to the purchase of the buses. Adjustments were made by the Consortium to reflect the impact of subsidies and sales taxes from the Government of Ontario.
Depending on the model used, savings over the cost of using conventional diesel buses ranging from $21.5 to $73.1 million would result from the placing in service of a CNG fleet of 226 buses in Ottawa.
2.2
Strengths
and Weaknesses of the Consortium Business Case for CNG Buses in Ottawa[9]
2.2.1 Logical Structure and Data Accuracy
The logical structure of the models developed by the Consortium comprises all major cost components. Without the full benefit of all internal cost data from the City at the time of its construction, the model was based on differential costs. Various sources have been used to obtain incremental (higher or lower) costs associated with the use of CNG buses as compared to diesel and diesel-electric hybrid buses. The Consortium states it has attempted to be conservative in its estimates but it could not arrive at accurate estimates for the following reasons:
Ø The Consortium model does not replicate the baseline case of the City of Ottawa. In order to perform a comparative analysis, the situations being evaluated must be identical or adjustments must be made to bring them to a comparable basis. This is very difficult under the best of circumstances as the number of variables to be considered is somewhat overwhelming: weather conditions, duty cycles, operating procedures, labour contracts, etc.
Ø From a logic perspective, using absolute numbers in the form of $/km presents the problem that some significant elements such as labour costs (and therefore the shop rates), of the reference cases are different from those of the City of Ottawa. In the case of maintenance costs, for example, the equation would read:
$/km = (hours required * shop rate)/km driven
Using the absolute $/km at Pierce Transit as a reference case to determine the maintenance costs in Ottawa does not take into consideration the differential in shop rates.
Ø Using a percentage differential (the second model used by the CNG Consortium uses 20% and the accuracy of this figure will be discussed later) avoids the problem of unavailable detailed inputs as long as the overall costs (the current maintenance cost per km in the example) are available.
The Consortium assumed that only one facility would be converted to host CNG buses. The common practice at the City of Ottawa is to distribute new buses among various garages for several valid reasons (equal distribution of the maintenance load, fair distribution of new buses among the various routes, etc). The conversion of only one facility does not follow the logic of the process currently used at the City of Ottawa where management Staff would prefer to maintain more flexibility. This does not necessarily invalidate the use of a single garage in the short term with a second facility being converted at a later date, especially if the City of Ottawa chooses to convert an increasingly larger proportion of its bus fleet to a lighter than air gaseous fuel.
2.2.2 Completeness
A model is regarded as complete when all relevant cost elements have been taken into consideration.
The models submitted by the CNG Consortium asserted that the following elements were taken into consideration:
Ø Fuel Consumption of CNG Buses
Ø Natural Gas Prices
Ø Facilities Upgrade (Capital costs)
Ø Fuelling Infrastructure
Ø Operations & Maintenance Costs
Generally speaking, these represent all the major elements of converting a diesel bus fleet to a CNG bus operation. The fuel consumption and price of natural gas estimates are complete.
As the method used to determine the potential savings of adopting CNG buses was based on cost differentials, it is not possible to determine precisely if all cost elements specific to the City of Ottawa were taken into consideration in the facilities upgrade category as detailed data on the changes required to the reference properties is not available. However, converting a single existing garage will not suffice to the task of handling new CNG buses as many specialised tasks are performed in separate facilities. For example, the engine dynamometer room and the body overhaul facility located at St-Laurent South would need to be converted to CNG even if another facility would be selected to host the CNG fleet. This was not taken into account in the Consortium models. In this respect, they are incomplete.
Transitway stations have not been integrated in the models proposed by the Consortium. If new CNG buses are required to be available on these transitways, three stations will be affected: the St-Laurent Station, the Riverside Station and the Queensway Station.
As for fuelling infrastructure, CNG buses can be deployed from only one facility as foreseen in the Consortium model. The cost of fuelling infrastructures used in the models is based on the average cost of converting the Toronto Transit Commission (TTC) facilities in 2004.
It is not possible to fully assess the completeness of the estimate used by the Consortium as it is based on an average of facilities. The cost of new refuelling facilities is very site specific. Without the benefit of detailed information at the time the model was built, the Consortium could not estimate the cost associated with facility conversion. The estimate used by the Consortium excluded the cost of upgrading the HVAC system on the basis that this upgrade (in the TTC case) should be performed regardless of the introduction of CNG buses, as the facilities do not meet current HRAI standards. In the course of the study, Ottawa’s property managers assured sustain-ABILITY™ that most of the City’s facilities do meet current standards[10].
References to elements contained in the cost of operation and maintenance are not detailed in the CNG Consortium model nor are they detailed in the main source provided for the information (Pierce Transit). An opinion concerning the completeness of this cost category cannot therefore be formulated.
2.2.3 Validity of Data
Data is considered valid when it is applicable to the City of Ottawa situation and accurate. The cost of CNG fuel used in the Consortium model is based on several valid assumptions:
Ø Bus performance = 3.1 miles/diesel gallon
equivalent (because the average duty cycle of the Ottawa fleet was assumed to
be comparable to that of the TTC);
Ø Natural gas prices are based on Enbridge
tariffs effective at the time the case was developed;
Ø Electricity required for compression of NG
($0.016/km) was based on Ottawa Hydro tariffs as applicable to the City at the
time the case was developed.
The capital costs of a fuelling station provided by the Consortium are not valid. This may be explained by the lack of site-specific data available to the Consortium at the time the model was constructed. In the course of this project, the Consortium was supplied with detailed information resulting in Clean Fuels Energy providing a valid cost estimate of supplying the City of Ottawa with two fuelling stations for specific sites. This information will be used in the reconstruction of the business case presented later in this report.
The same conclusion applies to the cost of bringing the City’s facilities up to CNG standards. Again here, this exercise is very site specific and the Consortium did not have access to the data required. As the Consortium could not identify the garage where the CNG fleet would be hosted, it selected an average cost of upgrading the TTC facilities. This provided a first-order summary that is, however, insufficient for decision-making purposes. A more precise estimate will be included in the reconstructed model presented later in this report.
The Consortium used O&M costs from Pierce Transit as a reference for both models. In the opinion of sustain-ABILITYTM, this information is not valid despite the fact that Pierce has almost the same average commercial speed as Ottawa[11], and the fact that generally, O&M costs are correlated with the average speed of the fleet. First, the shop rate of Pierce ($98)[12] is different from that at Ottawa Transit ($71). The information regarding the O&M cost per mile obtained from Pierce Transit by the Consortium was confirmed by the research undertaken by sustain-ABILITYTM but remains inexplicably low. Pierce Transit did not provide sustain-ABILITY™ sufficient data to substantiate the accuracy of this information. Excluding Pierce Transit from the sample, the maintenance costs obtained by sustain-ABILITY™ in its survey of transit systems range from $0.29 to $0.90/km while the cost used in the Consortium business case is $0.14/km.
In addition, all O&M CNG C-Plus Gas engine cost data obtained was necessarily tabulated from relatively young fleets as this engine model has been on the market for only four years. Experience shows that average bus maintenance costs increase dramatically in the first five to six years of a bus’ life and peak afterwards.
The overall validity of the data used in the Consortium models is therefore questionable in these respects and will be revised in Section 4 of this report.
2.2.4 Accuracy of the Original Conclusions
Given the incompleteness of the models presented by the CNG Consortium and the inaccuracy of several cost elements in the Ottawa context, the potential savings the City will realize by introducing CNG buses as presented in the Consortium’s business case are not entirely relevant.
Section 4 provides reconstructed cost estimates while Section 7 draws conclusions regarding the CNG option.
2.3
Description
of the CNG Option from an Environmental Perspective
2.3.1 Consortium Position
The Consortium Case from an environmental perspective (the “CNG Option”) was represented as follows:
Ø
CNG is the cleanest available solution
o CNG engines and vehicle platforms offer the lowest urban emissions;
o substantial greenhouse gas emission reductions are generated using a CNG platform relative to diesel;
o hybridisation would enhance these benefits proportionally to those claimed for hybridisation of diesel engines.
Ø Stricter emissions standards reduce diesel efficiency, reliability and drive up costs
o ever-tightening emissions standards (Environmental Protection Agency [EPA] and California Air Resources Board [CARB]) are difficult for diesel to achieve;
o the technology used to reduce diesel emissions reduces efficiency and reliability and increases costs.
Ø Low sulphur diesel fuel requirements drive up costs and potentially reduce efficiency and increase maintenance costs
Ø “Clean” DEH technology carries uncertainty
o ability to meet regulations (currently engine, not platform, based) and diesel faces significant challenges to get to 0.2g NOx standard;
o novelty of hybrid drive systems;
o reliance on subsidy to be economic.
2.3.2 City of Ottawa Staff Position
Natural gas buses (the NGV Option),
according to City
Staff, present no environmental benefit compared to DEH buses for
the following reasons:
Ø Diesel-electric hybrids operating under severe duty cycles (assessed as comparable to those recommended by NRC for use in Ottawa) produce fewer emissions than CNG buses;
Ø Hybrid buses have an advantage in non-regulated emissions such as greenhouse gases (GHGs) (this has significant relevance in Canada that has ratified the Kyoto Protocol, whereas the USA has not);
Ø CNG has no renewable fuel option, such as bio-fuels.
2.3.3 Supporting Background Information
The Consortium environmental case was embodied in an MS PowerPoint presentation[13] (the “Consortium Presentation”) without supporting written documentation. There is no written record of the discussion that accompanied the presentation. This section documents the Consortium case based on subsequent communications between the Consortium and City Staff and communications between sustain-ABILITYTM and Consortium members.
Diagram 1, extracted from the Consortium Presentation, was developed by Cummins-Westport and similar graphics appear throughout the literature sustain-ABILITY™ has reviewed. It illustrates the evolving EPA emissions standards for Nitrogen Oxides (NOx) and Particulate Matter (PM) over time, the current emissions levels, and levels that must be achieved for 2007 and 2010. The blue 2002 box represents emissions standards currently in effect. The dark green box in the lower left-hand corner shows the 2007 regulations that must be fully met by 2010. The gold box indicates the blended average that must be met starting in 2007 as the 2010 levels are phased in. The numbers to the right of the graph indicate the lower levels of sulphur permitted in diesel fuel and the estimated incremental increase in cost for diesel to meet each level of tighter emissions standards.
Diagram 1 -
 Evolving Emissions Standards
CWI has indicated that it expects to certify its 2007 engines to the 0.2g NOx 2010 regulations in Q1 2007. It expects diesel engine manufacturers to initially certify to the 1.2g NOx average and require additional improvements to meet 2010 requirements. A description of the regulations and phase-in requirements follows.
CWI has developed a lifecycle cost model that incorporates the expected cost of meeting evolving environmental standards, as well as the associated impact on engine performance, and has offered to work through it with City Staff. It should be noted that CWI has indicated that the model itself cannot be provided to sustain-ABILITYTM as it contains proprietary Cummins Inc. data.
Diagram 2 is also included in the Consortium Presentation. It is proposed that the performance of CNG engines relative to comparable diesel platforms has improved markedly, such that 2001 CNG engine technology is considered by Cummins Westport to be equivalent to diesel, save emissions where the CNG technology is better. It is projected that fuel cost / mile and lifecycle cost will also be better in the new 2007 engine platform. Reliability and durability are expected to continue to be similar to diesel. It is the position of the Consortium that CNG technology had problems in its introductory years but that it is now a mature technology. It is claimed that modern CNG buses significantly reduce emissions while being very comparable to diesel in operating costs.
Diagram 2 - Key Characteristics – Diesel vs. NG
|
|
L 10 G |
C 8.3 |
C
Plus |
2007
Gas |
|
Emissions |
Better |
Better |
Better |
Better |
|
Reliability |
Worse |
Worse |
Similar |
Similar |
|
Fuel Cost/Mile |
Worse |
Worse |
Similar |
Better |
|
Durability |
Worse |
Worse |
Similar |
Similar |
|
LCC |
Worse |
Worse |
Similar |
Better |
|
Timeline |
1989 |
1996 |
2001 |
2007 |
Source: Cummins
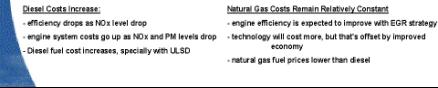
It is also the Consortium’s position that the current trend in increasing diesel fuel prices is not likely to reverse. Ultra Low Sulphur Diesel now being implemented, coupled with increasingly stringent requirements for diesel engine emissions controls scheduled for 2007 and 2010, will make diesel buses more expensive to operate in the future. The technology required to clean up emissions to current levels (i.e. particulate traps) has already negatively impacted reliability, and it is not yet known how the lubricity of Ultra Low Sulphur Diesel (ULSD) (to protect the engine) will be achieved. The cost of fuel, however, is expected to be significantly higher than standard diesel.
Cummins Westport has indicated, as shown in Diagram 3, that future diesel-powered buses will actually lose fuel economy in the attempt to make them less environmentally damaging. Diesel buses are most efficient operating at high temperatures but this also generates the most pollution. Thus reducing combustion temperatures to protect the environment will also reduce fuel economy.
Diagram 3 - Key Characteristics – Diesel vs. NG
The Consortium also cited problems that the
Toronto Transit Commission (TTC) had with diesel particulate filters to support
its case that emissions control devices required to permit diesel to meet
emerging emissions standards would reduce reliability and increase cost. The
TTC authorized additional funds to allow the
first 80 buses of the 330-bus order to be delivered with Diesel Oxidizing
Catalyst exhaust after-treatment instead of the Diesel Particulate Filters
(DPFs) originally specified. Based on the experience of other transit
properties, such as Ottawa and Golden Gate in California, it has become evident
that the introduction of DPFs to large fleets is premature and is leading to
high filter maintenance and reduced availability of buses for service.[14]
2.4
Strengths
and Weaknesses of the Environmental Case for CNG Buses in Ottawa
2.4.1
Logical
Structure
The Consortium’s environmental case focuses on regulated pollutants: the basis upon which technical performance specifications are established and technologies are certified.
The Consortium case focuses on engine emissions versus vehicle-based emissions. This is also consistent with the way emissions are regulated and technologies are certified today. Implicitly, the Consortium case is based on the standardised duty cycle used for the purpose of engine certification.
The Consortium case does not directly address greenhouse gases and does not consider the impact of the local duty cycle on actual versus certified emissions, nor does it expressly consider the potential impact of hybridisation of the diesel platform.
The Consortium case is not necessarily illogical with respect to its focus on regulated emissions from the engine, but it could be characterised as incomplete from the City Staff perspective, as discussed in the following section.
Ottawa’s Fleet Emissions Reduction Strategy
specifically references a reduction in CO2 emissions and adopts the
recommendation of City Staff to pursue diesel-electric hybrid buses instead of
CNG buses. It is illogical that the Consortium’s case would not address the
comparative advantages and disadvantages of both technologies. The failure to
consider the local duty cycle is also illogical, given that the City measures
emissions reduction on the basis of fuel consumption.
2.4.2
Completeness
Consistent with the criteria used to assess the business case, the environmental case would be regarded as complete when all relevant elements have been taken into consideration.
The environmental case is described in very general terms. There is very little in the way of explanation or support for the claims made in the documentation provided. However, as noted above, the materials included a PowerPoint presentation that would have been accompanied with a verbal explanation. Section 2.3.3 is included for that purpose.
It was acknowledged that the greenhouse gas emissions issue was not specifically addressed in the Consortium presentation, and that Cummins Westport’s focus, like that of other engine manufacturers in the industry, has been on regulated emissions. Consortium members subsequently provided data available to them as part of the supporting documentation required to validate their case.
It was also acknowledged that no analysis had been undertaken to determine the impact of the Ottawa duty cycle on the emissions profile of the CNG bus. The Consortium position is that all engine manufacturers are required to certify to the same regulated emissions targets, and that the certification tests consider a representative duty cycle adopted by the regulators. The UDDS duty cycle, ultimately agreed-on as the baseline for this study, has been developed for chassis dynamometer testing of heavy-duty vehicles and was the basis for the development of the Federal Test Procedure, or FTP, transient cycle used for EPA certification. The FTP transient test was developed to take into account the variety of heavy-duty trucks and buses in American cities, including traffic in and around the cities, on roads and expressways.[15]
As noted above, the CNG Option, as originally presented, was incomplete as it failed to adequately address GHG emissions and the local duty cycle. The Consortium could not reasonably have been expected to characterise an Ottawa duty cycle in the context of presenting the CNG Option and it was ultimately agreed with the City not to include such an analysis in this Report. Nevertheless, the potential impact could have been addressed given the availability of the NRC Report that discusses the impact of duty cycle on the potential benefit of DEH buses without characterising an “Ottawa duty cycle”.
2.4.3
Validity
of Data
Data
is considered valid when it is accurate and applicable to the situation of the
City of Ottawa. Given the general and
high-level nature of both the Consortium and City Staff positions with respect
to the environmental case, an assessment of the validity of their respective
positions and accuracy of their conclusions required substantial primary and
secondary research. In fact, the third-party data is sufficiently inconsistent
that conclusions supporting a broad range of positions can be drawn. Engine,
vehicle, model, model year, duty cycle and test parameters can have a dramatic
impact on results. The (sometimes poor) quality of data acquisition and
reporting and the lack of timely reporting of current data in an environment of
rapidly changing technology to meet 2007 regulatory requirements are also
factors.
The
sources of third-party data vary, from independent testing by government
organizations based on established protocols and methodologies to private
studies prepared by consultants in accordance with less stringent and
transparent data collection, analysis and reporting methods. The highest
quality data available is from fleet testing undertaken by the National
Renewable Energy Laboratory (NREL) in the United States. Each of its studies is
carried out in accordance with a General Evaluation Plan, Fleet Test and Evaluation Projects[16].
Recent studies were carried out by NREL in collaboration with other
national laboratories, universities and government staff for the Washington
Metropolitan Area Transit Authority (WMATA), King County Metro Transit
Authority (KCMTA) in Seattle, and the New York City Transit Authority (NYC).
Testing undertaken by Environment Canada (referenced in the NRC Report) was
also undertaken and reported in a similarly thorough manner.
The
use of studies undertaken by Levelton Consultants (for BC Transit), TIAX (for
CARB), MJ Bradley and Associates (for the Massachusetts Bay Transportation
Authority) and Parsons Brinkerhoff for Sound Transit (suburban Seattle,
Washington) is qualified and limited, for the reasons described in the
summaries provided in Appendix 1. Some other sources provided by the
stakeholders, including the Northeast Advanced Vehicle Coalition Hybrid
Electric Drive Heavy-duty Vehicle Testing Project[17]
cited by City Staff in the FERS Update, are outdated and outside of the
parameters agreed by the stakeholders for this evaluation. The City has also
referenced a recently completed Bus Technology and Alternative Fuel
Demonstration Project conducted by MJ Bradley and Associates for Translink (the
“Translink Study”). Unfortunately, the final report from that study was not
available when this Report was being prepared and the preliminary data that had
been released was incomplete. The preliminary Translink staff reports raise a number
of flags with respect to the methodology used and whether the buses used fall
within the parameters agreed for this evaluation (as discussed in Appendix 1).
It is our understanding that Translink is planning to re-do its testing with
2006 model CWI CNG and Diesel buses beginning in November.
Additional
data was acquired directly from transit agencies, academic institutions
specializing in automotive technologies, the US EPA, NREL, Environment Canada
and Southwest Research Institute (SwRI), an independent research and testing
organization that it is widely utilized by engine manufacturers and respected
in the industry.[18]
As
noted, the claims in the Consortium base case were very high level and
generally unsupported by reference to verifiable sources. The Consortium’s
position is that its case was intended to raise the major issues, with the
intent of subsequently carrying out a more complete analysis in the specific
Ottawa context. The additional background information buttresses the Consortium
case but is incomplete in that it does not address greenhouse gas emissions (a
declared priority in the Ottawa FERS) with specific data. It also focuses on
comparisons to diesel rather than the diesel-electric hybrid alternative, in
some cases drawing conclusions without relevant supporting data or reference
points, and it fails to address inconsistencies in publicly-available data
where such data contradicts its case.
Where the Consortium case proposed that CNG is the cleanest available solution, “clean” is not defined specifically, but is characterised as regulated, pollution-causing emissions. In January 2001, the United States Environmental Protection Agency enacted the latest round of regulations for the “Control of Air Pollution from New Motor Vehicles: Heavy-Duty Engine and Vehicle Standards and Highway Diesel Fuel Sulphur Control Requirement”.
“Even with more stringent
heavy-duty highway engine standards set to take effect in 2004, these engines
will continue to emit large amounts of nitrogen oxides and particulate matter,
both of which contribute to serious public health problems in the United
States. These problems include premature mortality, aggravation of respiratory
and cardiovascular disease, aggravation of existing asthma, acute respiratory
symptoms, chronic bronchitis, and decreased lung function. Numerous studies
also link diesel exhaust to increased incidence of lung cancer. We believe that
diesel exhaust is likely to be carcinogenic to humans by inhalation and that
this cancer hazard exists for occupational and environmental levels of
exposure. We are establishing a comprehensive national control program that
will regulate the heavy-duty vehicle and its fuel as a single system. As part
of this program, new emission standards will begin to take effect in model year
2007, and will apply to heavy-duty highway engines and vehicles. These
standards are based on the use of high-efficiency catalytic exhaust emission
control devices or comparably effective advanced technologies. Because these
devices are damaged by sulphur, we are also reducing the level of sulphur in
highway diesel fuel significantly by mid-2006.”
(40 CFR Parts 69, 80, and 86, January 18, 2001)
As Table 5 and Diagram 4 from SwRI show, CNG engines have traditionally demonstrated superior capabilities to achieve lower levels of NOx and PM emissions, and NOx plus Non-Methane Hydrocarbons (Methane itself does not contribute the formation of smog). This has been demonstrated by lower certified emissions levels and is broadly reflected in the literature with respect to in-service testing. In 2007, the difference between diesel and gas engines will be at its highest level in 20 years, on a percentage basis, albeit at low levels. If, as has been suggested, the City purchases 2006 diesel engines for the first wave of new DEH bus purchases in 2007, certified NOx emissions may be more the twelve times higher than with 2007 CNG and PM emissions may be up to five times higher. For the 2008 and 2009 purchases, base NOx emissions will continue to be six times higher than with 2007 CNG engine buses but the new diesel engines will have to comply with the 0.1g PM standards.
Table 5 - Comparative NOx Emissions Data
|
Gas Traditionally Ahead of Diesel |
||
|
Model Year |
Diesel Engines |
Gas Engines |
|
1988 |
10.7 |
n/a |
|
1990 |
6.0 |
2.5 |
|
1994 |
5.0 |
2.5 |
|
1998 |
4.0 |
2.5 |
|
2002-2004 |
2.4/2.5 |
1.8 |
|
2007 |
1.18 |
<0.2 |
|
2010 |
0.2 |
<0.2 |
Source: SwRI, 2006
Notwithstanding the foregoing, the City has
indicated that it is more concerned about CO2 emissions of its in-service
fleet. The
NREL-WMATA study is the only available independent study of new CNG engine
technology in field service.[19] The relevance of the results of this study
is subject to the following qualifications:
the data sample is limited, a WMATA specific duty cycle was
characterised that may not be directly comparable to the UDDS cycle and the
study utilized both newer and older model CNG and diesel platforms. However, in accordance with the project
scope and evaluation parameters, only newer model results are used. The older
model CWI CNG buses did not perform as well as newer model Deere platforms on
regulated emissions, but performed very well with respect to CO2
emissions.
The
following table indicates that the new model CNG buses performed well compared
to new model conventional diesel buses equipped with the latest emission
controls.
Table 6 - Emissions of CNG vs. Diesel Buses
at WMATA
|
Vehicle |
CO (g/mile) |
NOx (g/mile) |
Methane (g/mile) |
Non-Methane Hydro-carbons (g/mile) |
PM (g/mile) |
CO2 (g/mile) |
|
MY 2004 DDC Series 50 With EGR and DPX |
.34 |
17.9 |
|
0.003 |
.025 |
3346 |
|
MY 2004 John Deere 6081H CNG with Oxidation Catalyst |
.14 |
9.08 |
10.6 |
0.55 |
.004 |
2173 |
|
CNG Emissions as % of
Diesel |
41% |
51% |
|
18,333% |
16% |
65% |
* Total Hydrocarbons – Methane plus non-methane
hydrocarbons
Source: NREL, 2005
The John Deere CNG buses produced 59% lower CO, 49% lower NOx emissions, 84% lower PM and 35% lower CO2 emissions compared with the MY 2004 DDC diesel buses. Older model Cummins Westport equipment did not perform as well in some respects. However, this was acknowledged by the Consortium and the scope of the sustain-ABILITYTM analysis was defined to exclude pre-2002 equipment.
The claim that CNG engines are ‘cleaner’ than diesel engines is broadly accurate (except with respect to total Hydrocarbons), both in terms of certified engine emissions (at least until 2010 model year) and in-service emissions. The validity of the statement relative to DEH buses is inconclusive as there is no direct comparison available of the CNG and diesel electric hybrid buses in an environment comparable to that of Ottawa.
Where the Consortium claims that stricter emissions standards will be more difficult for diesel engines to achieve, and the need for more aggressive after-treatment will reduce diesel efficiency and drive up costs, third-party data confirms the validity of this claim but the order of magnitude is uncertain as 2007 engines have yet to be certified and tested in-service.
Cummins-Westport has indicated that it intends to certify 2007 CNG engines to the 2010 emissions standard and diesel engine manufacturers will be taking a two-stage approach to meet the new regulations. As presented in Diagram 5, more aggressive after-treatment will also be required to achieve these emissions levels.
Diagram 4 - Emissions Controls in 2007 Diesel and NG Engines
Source: Cummins
Westport Inc.
Other industry sources confirm that CNG engines are expected to be certified to 2010 levels in 2007. Diesel manufacturers are expected to take a two-stage approach to meeting 2010 regulations by taking advantage of an interpretation of the phase-in rules to deliver engines certified to 1.2 g/bhp NOx in 2007, followed by 0.2 g/bhp in 2010. The Consortium claims are confirmed by SwRI (as presented in Diagram 6) and the M.J. Bradley MBTA Report that promotes clean diesel technologies:
CNG engines produced after 2007 are expected to meet the 2010
requirement for no more than 0.2 g/bhp-hr NOx, while diesel engines
produced between 2007 and at least 2010 will produce 1.1 g/bhp-hr NOx.[20]
Diagram 5 - Figure Key Characteristics – Diesel vs. NG

Source:
SwRI, 2006.[21]
The impact of emissions control technologies required to meet ever more stringent emissions standards is discussed in Section 6.1. This analysis shows that it is expected that the current cost gap between diesel and CNG platforms will narrow considerably, if not completely, by 2010. The following table presents costs of diesel and CNG engines with 2010 emissions controls as forecasted by TIAX.[22]
Table 7 - Intermediate Average Annual Costs for Transit Buses in 2010
|
Engine/Fuel |
After-Treatment Option |
Intermediate AAC (NPV, 2005$) |
|
CIDI / diesel |
4-way catalyst |
$ 53,799 |
|
CIDI / diesel |
Catalyzed PM trap, sulphur trap, NOx
trap, and oxidation catalyst |
$ 54,394 |
|
Stoichiometric/CNG |
3-way catalyst |
$ 54,846 |
|
CIDI / diesel |
Catalysed PM trap, SCR-urea, and oxidation catalyst |
$ 55,929 |
Source: TIAX, 2005
The Consortium also cited ULSD fuel requirements driving up costs and potentially reducing efficiency and increasing maintenance costs for any diesel-based platform. ULSD will be discussed in more detail in Section 6.1. It is expected that there may be modestly negative impacts on performance and cost due to the introduction of ULSD. The energy content of ULSD is lower than #2 Low Sulphur Diesel. The lower energy content of the fuel will reduce engine efficiency and fuel economy proportionally.
Ultra Low Sulphur Diesel fuel containing less than 15-ppm sulphur is more expensive than conventional diesel fuel. When the 15-ppm sulphur regulations were enacted for implementation in 2006, the EPA estimated that it would add approximately US$0.05 per gallon for refining and distribution costs. The EPA estimates were confirmed by EIA and are consistent with the industry’s current long-run price expectations. City Staff have confirmed that Ottawa is currently paying a premium of approximately $0.02/litre, which is in line with expectations.
Reduced lubricity due to the additives could also affect engine life and maintenance requirements, particularly in legacy fleets. As noted in Section 6, this could, however, be addressed through the addition of biodiesel. It is also expected that newer engines will utilize materials that are more tolerant of the new fuel specifications.
The Consortium’s claim that there will likely be comparatively higher costs and lower efficiency for diesel technologies to meet the new emissions requirements is therefore valid.
2.4.4
Accuracy
of Conclusions
In
summary, the Consortium case is broadly valid as far as it goes, but is
incomplete and, therefore, cannot be characterised as completely accurate for
the purposes of the City’s evaluation.
The Consortium’s position with respect to providing emissions benefits
now and through the introduction of new engines in the 2007 model year is
accurate … in terms of most regulated emissions. CNG falls short of diesel in
terms of total hydrocarbon emissions due in large part to unburned methane.
This is not considered to pose a significant local air quality issue. Emissions
of methane do, however, show up when greenhouse gas emissions are considered.
The failure to address the greenhouse gas issue adequately is an understandable
concern on the part of City Staff. The City’s Fleet Emissions Reduction
Strategy (discussed in greater detail in Section 5) includes greenhouse gases
and these were not addressed in the Consortium’s proposal. Cummins-Westport
acknowledged that its focus has been on regulated emissions given the relative
size of the United States and Canadian markets and the implementation of new,
lower emissions requirements in 2007 an 2010. The NREL/WMATA data suggests,
however, that emissions of CO2 may be substantially lower in CNG
buses depending on the duty cycle. There is insufficient data available to
directly predict whether CNG or DEH buses would perform better from a GHG
perspective in the Ottawa context.
The impact of new technologies will be discussed in detail in Section 7,
but the suggestion that there is perhaps greater risk and uncertainty with
respect to diesel and hybrid platforms over the next few years is accurate. The
challenges of meeting 2010 regulations mean that diesel engines will take a
two-step approach, introducing new technologies in both 2007 and 2010. CNG will
go to the 2010 package in 2007 and will thus have a three-year lead on diesel.
It should be noted, however, that many of the technical problems experienced
with DPFs were caused by the use of high sulphur fuel and are not expected to
be an issue going forward with the maturing of the technology and mandatory use
of ULSD.
3 The Diesel Electric Bus Business Case in Ottawa
3.1
Description
of the DEH Bus Option from a Financial Perspective
As was the case for CNG buses, the Consortium provided sustain-ABILITY™ with two different models (dated August 2005) as well as two updates of those models (dated December 2005) regarding DEH buses. Identical operating cost forecasts were used for the Pierce and 20% models but an update was made to the diesel fuel costs in December. The following sources were used to form the basic assumptions of the Consortium cost models:
|
Ø
Fuel
Consumption of DEH Buses |
Cummins
Westport Internal Data Ten Years of Compressed
Natural Gas (CNG) Operations at SunLine Transit Agency, K. Chandler, Battelle, April 2003 —
December 2004 |
|
Ø
Diesel
Prices |
Report to the Transportation Committee of the
City of Ottawa, September 7th, 2005 Ron Gillespie, City of
Ottawa (December) |
|
Ø
Facilities
Upgrade |
Bus
Facilities Requirements Study for Alternative Fuel Buses (TTC) McCormick
Rankin Corporation, December 2004 |
|
Ø
Operations
& Maintenance Costs |
"Procurement Authorization - Option to
Purchase 250 40-Foot Low Floor Clean Diesel Buses from Orion Bus
Industries", to the City of Toronto, September 2003 |
The key modelling assumptions made by the Consortium regarding DEH buses are the following:
|
Ø
Fuel
Consumption of DEH Buses |
Diesel hybrid tests generated an efficiency gain of
18% over conventional diesel buses 3.51 miles per gallon |
|
Ø
Diesel
Prices |
78 cents per litre 52.5 cents per km |
|
Ø
Facilities
Upgrade |
$500,000 (Capital costs) |
|
Ø
Operations
& Maintenance Costs |
The cost to
maintain a diesel bus is $0.19/km |
The Consortium models regarding the operating costs of DEH buses are identical in all four presentations. The financial analysis supplied to sustain-ABILITY™ is presented following.
Table 8 - Operating Costs Forecasted by the Consortium for DEH Buses
|
Both Models |
August & December 2005 |
||
|
Cost Category |
$ per km |
$ per |
Total Fleet Cost
($) |
|
Operating Cost |
0.2185 |
16,388 |
3,703,575 |
|
Fuel Cost |
0.4305 |
32,288 |
7,296,975 |
|
Other Costs |
Nil
|
Nil |
Nil |
|
Total Cost |
0.65 |
48,675 |
11,000,550 |
Source: The Consortium, 2005
On a lifecycle basis, that includes capital costs, the Consortium forecasted the following savings when comparing DEH buses to conventional diesel buses:
Table 9 - Lifecycle Costs Forecasted by the Consortium for DEH Buses
|
Both Models |
August 2005 |
December 2005 |
|
Capital Investment |
|
|
|
40-foot bus savings1
(incremental cost) ($) |
27,798,000 |
(16,082,160) |
|
Building and infrastructure incremental
cost ($) |
2,000,000 |
2,000,000 |
|
Operating Cost Savings ($) |
20,136,600 |
20,136,600 |
|
Net Savings of DEH Over
Diesel ($) |
45,934,600 |
2,054,440 |
|
Discounted (6.75%) Savings
of DEH Over Diesel ($) |
36,079,382 |
(4,963,935) |
1 Assuming subsidies from the Government of
Ontario for urban transit vehicles and alternate fuel buses
Source: The Consortium, 2005
In December 2005, the revised Consortium calculations show DEH buses costing nearly $5 million more than conventional diesel buses on a lifecycle basis (after accounting for subsidies and taxes).
3.2
Strengths
and Weaknesses of the DEH Case in Ottawa
Keeping in mind that «the intent of the Consortium’s models was to provide a qualitative, first-order summary of the advantages and disadvantages of CNG», sustain-ABILITY™ reviewed the DEH business case presented in the four models described previously.
3.2.1 Logical Structure
The logical structure of the models developed by the Consortium for DEH buses is essentially the same as that of the CNG business case. It therefore presents the same weaknesses mainly attributable the fact that the City’s internal cost data was not used in its construction. Based on differential costs, the models use various sources to obtain incremental (higher or lower) costs associated with the use of DEH buses as compared to diesel, and eventually CNG buses.
The comments formulated for the CNG business case therefore apply to the DEH business case in as much as the baseline case of the City of Ottawa is different from those used in the model and the use of absolute numbers ($/km) presents the problem that some significant elements of the reference cases are different from those of the City of Ottawa.
In the case of the building infrastructure costs, the Consortium has provided for all four facilities to be converted at a total cost of $2 million. While it follows the City of Ottawa’s intent suits the cause of flexibility, it is inconsistent with the Consortium’s approach where all 226 CNG buses were to be housed at a single facility. From that perspective, the models display logical incoherence between its own CNG and DEH business cases, and consequently have inflated infrastructure cost for DEH buses.
3.2.2 Completeness
The reader is reminded that a model is considered complete when all relevant cost elements have been taken into consideration.
The models submitted by the CNG Consortium asserted that the following elements were taken into consideration:
Ø Fuel Consumption of DEH buses;
Ø Diesel Prices;
Ø Facilities Upgrade (Capital costs);
Ø Operations & Maintenance (O&M)
Costs.
Generally speaking, these represent the major elements of converting a diesel bus fleet to a DEH bus operation. The fuel cost calculations based on fuel consumption, DEH efficiency improvement and price of diesel fuel estimates are complete.
Facilities upgrade costs are not detailed in the documents provided by the Consortium. The source document cited as a reference (MRC 2004) provides some details of specific relevance to the TTC. On that basis, the completeness of this element of the Consortium models cannot be asserted.
References or sources used to calculate the operation and maintenance costs are not detailed in the Consortium model and date back to 2003. There are no references to a major cost element; i.e., traction battery replacement.
An opinion concerning the completeness of this cost category can therefore not be formulated.
3.2.3 Validity of Data
As a reminder, data validity depends on its applicability to the City of Ottawa situation and its accuracy. The cost of diesel fuel used in the Consortium model is based on the following valid assumptions:
Ø SunLine Transit and
TTC estimate the diesel consumption value of a conventional diesel bus at 3.50
miles per gallon or 0.67 litres per km.
An efficiency gain of 18% has been applied to this performance.
Ø Diesel fuel prices used in the models are
based on $0.78/litre provided by the fleet manager of the City of Ottawa.
Data from the City of Ottawa indicates
the diesel fuel price used by the Consortium is valid. The current average fuel consumption of the
conventional diesel buses in Ottawa (0.595 l/km)
is lower than the 0.67 l/km used by
the Consortium.
Tests
conducted by the NRC on 11 Ottawa routes revealed that hybrid buses out-performed conventional
diesel buses. The results vary from a
36% improvement on one stop-and-go route to less than 1.8% improvement on a
rural route. In Seattle, the buses in
the hybrid fleet used 21% less fuel than conventional buses with the same
engines installed in the same generation of buses performing the same duty
cycle. The 18% efficiency
gain is therefore a valid approximation of the average performance of a DEH bus
in Ottawa.
The cost of adapting the City’s facilities to DEH requirements was estimated by the Consortium at $500,000 per facility (including the provision of a proper battery conditioning room equipped with adequate ventilation, gas leak detection, fire detection and suppression and hazardous material recovery).
The Pennant appendix of the NRC Report[23]
provides two detailed cost estimates of equipping one facility with:
Ø A battery conditioning bay (if required);
Ø A battery storage room;
Ø Cranes;
Ø Scaffolding;
Ø High voltage safety equipment;
Ø Storage;
Ø Design and project management.
For the two DEH technologies tested,
detailed cost analyses performed by the NRC[24]
provided estimates of $489,479 and $625,482 (taxes excluded) to enable a
facility to serve the first 100 DEH buses.
In addition, initial
training costs for operators and mechanics as well as the cost of two full-time
employees in Fleet Services to support the new technology while in-service
should be included.
Based on sustain-ABILITYTM’s review of the items included in the Pennant Appendix, the Consortium has underestimated the unit cost of adapting the City’s facilities to DEH bus requirements.
A study conducted in 2004 by MARCON-DDM included detailed cost data relevant to 40-foot buses from 15 transit systems. The average maintenance cost of these systems was $0.60/km. As for fleets of a size comparable to the City of Ottawa, the average cost of maintenance was $0.65/km. The information supplied by the City of Ottawa to sustain-ABILITY™ reveals an O&M cost of $0.80/km for the 40-foot diesel fleet while the information used as a base-case in the NRC Report states $0.78/km and $0.87/km depending on the hybrid technology. The number used by the Consortium may be accurate in the TTC case but is not valid in the case of the City of Ottawa.
The Consortium has allowed for O&M costs of DEH buses 15% lower than those of conventional diesel buses. No data was offered to substantiate that estimate. The NRC Report only states a net increase of $0.03/km or 3.6% increase over the $0.84/km discussed previously. These estimates, however, may be overly conservative as they do not take into consideration the upcoming new 2007 diesel engines and new ancillary systems. The information at sustain-ABILITYTM’s disposal does not afford the formulation of a definite opinion on this aspect of the O&M costs.
The overall validity of the data used in the Consortium models is therefore questionable in this regard and will be revised in Section 4 of this report.
3.2.4 Accuracy of the Original Conclusions
Given the preceding comments relative to data validity, the quantitative conclusions presented by the Consortium are likely inaccurate. The information developed in Section 4 will determine the magnitude of the models’ inaccuracy and its consequence on the conclusions that can be drawn from improved cost forecasting.
3.3
Description
of the Diesel Electric Hybrid Option from an Environmental Perspective
There is no reference to environmental
issues regarding the DEH buses in the Consortium Case. An environmental case for DEH is made by
City Staff in FERS and FERS II. The DEH environmental case is, therefore,
analysed from the perspective of:
Ø City Staff (with reference to the NRC Report, carried out under FERS);
Ø correspondence between City Staff and the Consortium;
Ø correspondence between City Staff and sustain-ABILITYTM as part of this project; and
Ø supporting third-party data.
3.4
Description
of the DEH from an Environmental Perspective
3.4.1 City Staff Position
The City Staff position is that,
notwithstanding engine-based regulations, CNG offers no environmental benefit
compared to hybridisation of the diesel platform, particularly in the context
of the Ottawa duty cycle. Although CNG has long been recognized for its
environmental benefits, particularly when operating in an urban environment,
the City’s research to date indicates that when operated under severe urban
duty cycles, in most cases, hybrid diesel-electric sets the performance
standards for tailpipe emissions and fuel economy.
Additionally, since the ratification of the Kyoto protocol, GHG reduction
is particularly important. When poorer fuel economy for CNG buses under urban
drive cycles and when unburned methane emissions are considered, the GHG
reduction attainable in hybrid diesel-electric buses is significantly better
than that in CNG buses.[25]
3.4.2 Completeness
City Staff have suggested that the Ottawa duty cycle is severe and that under such conditions diesel-hybrids will perform better from an emissions standpoint. The NRC Report characterises a number of Ottawa’s lowest-speed/high stop routes as comparable to a Central Business District (CBD) type drive cycle (~4.3 stops / km). The summary analysis of Ottawa routes in the NRC Report indicates that eight (8) Ottawa routes are 4 stops/km or higher. There are no routes with more than 5 stops/km.[26] As a reference, a New York drive cycle has 11 stops/km. For the purpose of this analysis, however, the Consortium and City Staff have agreed to use the UDDS duty cycle referenced in the NRC Report and described in Section 6, which is a higher speed route than CBD. The NRC Report itself did not directly address environmental issues in the Ottawa context. A sample of duty cycles on different routes was discussed and performance of buses was evaluated on different types of routes, but there was no general characterisation of an “Ottawa Duty Cycle”. It was determined that the applicability of the other duty cycles referenced in the NRC Report and other literature would not be analysed. Although a discussion of the Ottawa duty cycle was outside the scope of this study, the importance of duty cycle on fuel economy and emissions cannot be overemphasized.
NAVC and Environment Canada reports were referenced as supporting the City Staff position. It was agreed, however, that this Study would not deal with pre-2002 technology and the NAVC work precedes this time frame (2001). The Environment Canada documentation looks only at DEH technology and references only dynamometer testing of DEH buses, but is among the best information sources available to date for DEH emissions testing.
3.4.3 Validity of Data
Environmental
Benefit
The Environment Canada analysis of hybrid versus conventional diesel buses in dynamometer testing and the NREL Study of Hybrid Diesel Electric buses in service at King County are the best available resources for independent analysis of hybrid vs. diesel emissions performance.
The following table presents the level of emissions in the two different DEH platforms being considered by the City compared to conventional diesel. The data is from a report published by Environment Canada[27] and referenced in the NRC Report. The relevance of the results of these studies is subject to the fact that an older 2001 model year conventional diesel bus was used for comparison. The use of a MY 2001 platform could work to the detriment of the DEH platform in terms of regulated emissions but may potentially benefit DEH in terms of CO2 emissions. Additional Emission Control Technologies (ECT) usually result in lower efficiency and, therefore, higher CO2 emissions.[28] However, the diesel platform included comparable equipment to newer engines so the impact would not be expected to be significant.
Table 10 -
Emissions
of DEH vs. Diesel Buses
|
Vehicle |
CO (g/mile) |
NOx (g/mile) |
Total Hydrocarbons (g/mile) |
PM (g/mile) |
CO2 (g/mile) |
|
MY 2001 DDC Series 50 With EGR ULSD Fuel |
1.11 |
10.46 |
0.21 |
0.021 |
1737 |
|
MY 2002 New Flyer DE40LF Allison Transmission ULSD Fuel |
0.16 |
11.06 |
.08 |
0.019 |
1337 |
|
Emissions as % of Conventional Diesel |
14.4% |
105.74% |
36.59 |
88.1 |
77% |
|
MY 2004 Orion VII EGR Equipped Cummins ISB ‘02 ULSD Fuel |
0.1 |
7.98 |
.03 |
0.018 |
1589 |
|
Emissions as % of Conventional Diesel |
9% |
76.33% |
14.63% |
85.71% |
91.5% |
Source: Environment Canada, 2004
For the New Flyer, NOx was 5.75% higher, PM was 12% lower, and CO2 was 23% lower in the hybrid bus. For the Orion, NOx was 23.67% lower, PM was 14.3% lower and CO2 was 8.5% lower in the hybrid bus.
The following are the interim results from the NREL-KCMTA testing of new 60-foot buses with identical engines and glider packages[29]. The relevance of the results from this study is subject to the following qualifications: the buses did not operate from the same depots but the routes were characterised as ‘similar’ (without supporting data), the conventional diesel ran on ULSD + B5 while the hybrid ran on ULSD and the UDDS duty cycle was not used. A KCM duty cycle was characterised to reflect the local characteristics. These results are generally consistent with the results of dynamometer testing undertaken by Environment Canada and reported in the NRC Report for the UDDS cycle.
Table 11 -
Emissions
of DEH vs. Diesel Buses at King County
|
Vehicle |
CO (g/mile) |
NOx (g/mile) |
Total Hydrocarbons (g/mile) |
PM (g/mile) |
CO2 (g/mile) |
|
MY 2004 New Flyer DE60LF CAT C9 With DPX ULSD + 5% Biodiesel |
0.66 |
14.74 |
0.04 |
0.108 |
3446 |
|
MY 2004 New Flyer DE60LF CAT C9 With DPX Allison E50 Drive ULSD |
0.27 |
12.11 |
0.02 |
0.187 |
2614 |
|
Emissions as % of Conventional Diesel |
41% |
82% |
50% |
173%[30] |
76% |
Source: NREL Technical Paper 540-39742, 2006
In
this evaluation, for the hybrid bus, NOx was 18% lower, PM was 73% higher and
CO2 was 24% lower.
A complicating factor in assessing GHG emissions reductions is that they are commonly assessed on a ‘well to wheel’ basis, so the impact of upstream processing and distribution can have a significant impact. The requirement to use ULSD and other emissions control technologies may also impact actual GHGs going forward by reducing fuel economy.
Levelton carried out the most in-depth analysis available with respect to lifecycle analysis of GHG emissions in urban transit buses for Whistler and BC Transit during a review of clean energy options for the 2010 Olympics.[31] It should be noted that the data used for this study was based on older model CNG buses and is contradicted in some respects by the results shown on newer model CNG buses in the NREL-WMATA study. In addition, the CNG buses were tested without after-treatment, while the diesel buses were tested with exhaust after-treatment. Based on this analysis, Table 10 suggests that CNG transit buses in use at the time would generate marginally higher CO2 emissions to diesel in operation and result in a 6.1% reduction on a well to wheel basis.
Table 12 -
GHG Emissions in CNG Transit Buses –
2003[32]
|
|
Diesel (g/mile) |
Natural Gas LNG (g/mile) |
Natural Gas CNG (g/mile) |
|
Vehicle operation |
2,009.6 |
2,095.8 |
2,095.8 |
|
Fuel dispensing |
1.2 |
271.3 |
5.9 |
|
Fuel storage and distribution |
26.4 |
102.8 |
81.6 |
|
Fuel production |
215.3 |
106.6 |
106.2 |
|
Feedstock transport |
2.6 |
0.0 |
0.0 |
|
Feedstock and fertilizer production |
315.3 |
31.5 |
31.4 |
|
CH4 and CO2 leaks and flares |
87.4 |
207.2 |
160.3 |
|
Emissions displaced by co-products |
0.0 |
0.0 |
0.0 |
|
Sub total (fuel cycle) |
2,658.0 |
2,815.2 |
2,481.3 |
|
% Changes (fuel cycle) |
— |
5.9 |
-6.6 |
|
Vehicle assembly and transport |
14.6 |
17.5 |
17.5 |
|
Materials in vehicles (incl. storage) and lube oil
production/use |
60.0 |
66.4 |
66.4 |
|
Grand total |
2,732.6 |
2,899.2 |
2,565.2 |
|
% Changes to Diesel |
— |
6.1 |
-6.1 |
Source: Levelton, 2004
The estimate for 2010, once ULSD and tighter emission controls are introduced, is for CNG to offer a 7% reduction in GHG emissions in operation and a 16% reduction on a well to wheels basis.
Table 13 -
GHG Emissions in CNG Transit Buses -
2010
|
|
Diesel (g/mile) |
Natural Gas LNG (g/mile) |
Natural Gas CNG (g/mile) |
|
Vehicle
operation |
2,005.1 |
1,864.6 |
1,864.6 |
|
Fuel
dispensing |
1.2 |
264.1 |
5.8 |
|
Fuel
storage and distribution |
25.9 |
98.7 |
78.2 |
|
Fuel
production |
221.5 |
104.5 |
104.3 |
|
Feedstock
transport |
2.3 |
0.0 |
0.0 |
|
Feedstock
and fertilizer production |
343.8 |
30.9 |
30.8 |
|
CH4 and
CO2 leaks and flares |
83.2 |
176.7 |
148.9 |
|
Emissions
displaced by co-products |
0.0 |
0.0 |
0.0 |
|
Sub total
(fuel cycle) |
2,683.1 |
2,539.4 |
2,232.7 |
|
% Changes
(fuel cycle) |
— |
-5.4 |
-16.8 |
|
Vehicle
assembly and transport |
14.5 |
17.3 |
17.3 |
|
Materials
in vehicles (incl. storage) and lube oil production/use |
57.6 |
63.3 |
63.3 |
|
Grand total |
2,755.1 |
2,620.1 |
2,313.4 |
|
% Changes to Diesel |
— |
-4.9 |
-16.0 |
Source: Levelton, 2004
As shown in the following table, the same study estimated a potential reduction in C02 emissions for DEH buses of 28.6% in operation and 26.8% on a well to wheels basis. The DEH numbers will be negatively impacted by fuel economy penalties resulting from the adoption of required ECT technologies and optimisation of engines for emissions reductions vs. fuel economy. It should be noted that the well to wheel analysis was performed in the Whistler, B.C. context and may not be comparable with Ottawa. GHG analysis for Ottawa, including well to wheel emissions, was not included in the scope of this evaluation.
Table
14 -
GHG Emissions in DEH Transit Buses – 2003[33]
|
|
Diesel (g/mile) |
Diesel (g/mile) |
|
Vehicle
operation |
2,009.6 |
1,435.0 |
|
Fuel
dispensing |
1.2 |
0.8 |
|
Fuel
storage and distribution |
26.4 |
18.8 |
|
Fuel
production |
215.3 |
153.8 |
|
Feedstock
transport |
2.6 |
1.9 |
|
Feedstock
and fertilizer production |
315.5 |
225.3 |
|
CH4 and
CO2 leaks and flares |
87.4 |
62.4 |
|
Emissions
displaced by co-products |
0.0 |
0.0 |
|
Sub total
(fuel cycle) |
2,658.0 |
1,898.0 |
|
% Changes
(fuel cycle) |
— |
-28.6 |
|
Vehicle
assembly and transport |
14.6 |
21.4 |
|
Materials
in vehicles |
60.0 |
81.0 |
|
Grand total |
2,732.6 |
2,000.5 |
|
% Changes (grand total) |
— |
-26.8 |
Source: Levelton, 2004
It is possible to build a case for the Staff position that there is little or no environmental benefit to CNG vs. DEH buses. There are published studies that show rough equivalence or better performance in DEH buses. However, some of these fall outside the parameters agreed to for this study, either being dated or conducted for duty cycles far different from that agreed to for application to this study. Others had serious data acquisition or reporting problems that made them difficult to draw conclusions. These are discussed in Section 2.4.3 above and in Appendix A. There is also ample data available to support the contrary position.
Renewable
Fuel Options
City Staff also preferred the diesel option on the basis that CNG has no renewable fuel option, such as bio-fuels. In fact, there are two renewable fuel options for CNG – biogas and Hydrogen-CNG (HCNG). Renewable fuel options for CNG in the Ottawa context are discussed in Section 6.2.
The use of biogas mixed with natural gas is common practice in many parts of the world. Biogas is commonly collected from wastewater treatment plants, landfill facilities and is produced through biomass gasification. Biogas generally contains less methane than conventional natural gas.
HCNG is a blend of hydrogen in natural gas
in quantities greater than 20% by volume. Hydrogen/CNG blends of less than 20%
are known as **Hythane®. The
addition of hydrogen will reduce emissions proportionate to the energy content
of hydrogen – roughly 4% by energy for each 10% by volume. The fuel will be
‘renewable’ to the extent that the hydrogen is derived from renewable
sources. HCNG is discussed in greater
detail in Sections 5.2 and 6.2.
It
can therefore not be said that there is no renewable fuel option for CNG.
3.4.4 Accuracy of Conclusions
There
is sufficiently inconsistent data in the public domain on either side of the
CNG and hybrid-diesel debate to claim an environmental advantage. With a few exceptions, the positions of the
Consortium and City Staff are valid in principle but uncertain in the Ottawa
context. Given that little has been
done to apply and test the theoretical potential of CNG or DEH in the Ottawa
context, both are incomplete and therefore fall short in terms of complete
accuracy.
The
EPA emissions standards are engine-based, not platform-based. While there is
some pressure from the industry to permit certification of vehicles, rather
than just engines, the EPA does not currently recognize any benefits based on
vehicle platforms. The California Air Resources Board, however, credits hybrid
bus propulsion systems with a 25% blanket reduction in emissions against state
emissions reduction requirements.
Although the data on CNG buses in the
Levelton study is dated, the importance of this analysis is the demonstration
of the potential impact of the well to wheel cycle on emissions. As described
in greater detail in Section 6, the Levelton study indicates that while DEH is
substantially better in operation than diesel, it is neutral in terms of the
full fuel cycle. CNG is neutral in
operation, but substantially better on a well to wheel basis. As noted above,
however, the duty cycle and engine/chassis platform chosen would also have a
very significant impact on actual GHG emissions. The potential variation is
sufficient that CNG or DEH could potentially provide a substantially greater
benefit on a local basis. The data on CO2 emissions reductions is
mixed and results will be highly dependent on drive cycle, but it can be said
that a DEH bus would be expected to perform better on the lowest speed routes,
and be more characteristic of conventional diesel on highest speed routes. Further, a hybrid platform will tend to
perform better than a non-hybrid platform operating on the same fuel.
While a case can be made that, on certain drive cycles, DEH may perform better than CNG, a blanket statement that CNG offers no environmental benefit compared to DEH buses cannot be supported.
4 Reconstructed Business Cases
The reconstruction of business cases consists in providing the missing data or correcting the invalid information of the original cases while maintaining their logical structure and aesthetic form.
4.1
The
CNG Business Case
Seventeen North America transit systems operate Cummins Westport Innovations C Gas-Plus engine-equipped buses in North America. sustain-ABILITY™ sought to obtain data from ten of those 17 CNG bus operating systems (see Appendix B for a list of responding Transit Systems).
Significant data was obtained from five of the ten systems and little or no data from the other five. CNG fuel and fuelling station data was also gathered from the TTC[34]. Only some of the systems have released data publicly. Transit systems were therefore coded with a letter for further reference. The following information qualifies each of the information providers and summarizes the information received.
|
A |
Year 2005 maintenance and fuel data for twenty 2003, NFI C40LF/C Gas-Plus buses put into service in early 2003. |
|
B |
Buses with C Gas-Plus ordered in 2006. |
|
C |
Year 2004 buses with C Gas-Plus, but little data. |
|
D |
Year 2002 Orion VII/DDC S50G buses, put in service late 2003. Data from a comprehensive study for 12 months (late 2004 /2005) on ten of 260 units. |
|
E |
Thirty 2004/5 NFI C40LF/C Gas-Plus buses but little data. |
|
F |
Fifty-two 2006 NFI C40LF/JD buses on order. No field data. |
|
G |
A 250+ CNG fleet with 106 2002 Orion/C 8.3G buses. The data was for 11 months, 2005/6 but is an average for all CNG buses in the fleet. |
|
H |
Forty-one 2005 NFI C40LF/C Gas-Plus. Little data. |
|
I |
A comprehensive 12-month study on five of 164 2001 NFI C40LF/C Gas-Plus that were put into service in mid 2002. The detailed data is for a 12-month period in 2003/4. |
|
J |
Information provided on the TTC Wilson garage fuel station and fuel cost. |
|
K |
A comprehensive study of the maintenance and fuel data for 299 2004 NABI/C Gas-Plus. The data is from mid-2005 to mid-2006. |
Additional data was collected from a variety of published reports listed in the bibliography presented in Appendix C. The data is predominately from two and three-year old NFI C40LF buses with C Gas-Plus engines.
For each cost component, three methods of selecting the data for the model were considered:
·
Medians
·
Averages
·
Logical
Choices
The use of a median or average was generally not relatable to the Ottawa situation. The purpose of this analysis is to determine the most likely costs, specifically related to the City of Ottawa. The statistical options were often not applicable given the small sample size and the fact that the operating situations were not comparable to those of Ottawa.
4.1.1 Capital Costs
As the capital cost structure used by the Consortium was adequate, sustain-ABILITY™ only added one category to the original format to accommodate non-recurring soft costs.
Bus Acquisition
Transit
buses, in terms of engine technology and probably from a price perspective, are
at a turning point. Starting in 2007, transit bus engines must be certified to
comply with reduced emissions levels. The prices obtained in the survey are
generally from 2005/6 tenders and none of these buses are equipped with
2007-compliant engines.
The
post-2006 model diesel powered buses are expected to be more expensive due to
stricter engine emissions requirements. The after-treatment, cooled EGR[35]
and a DPF are expected to add $7,500 (plus applicable taxes) to the price of a
2007-model bus. These additional costs
were appropriately incorporated into the lifecycle cost (LCC) model.
In
sustain-ABILITYTM’s survey, the 2006 base CNG bus prices ranged from
$361,888 to $418,675 per bus, with an average price of $397,241.
In
one case[36], current
(April 2006) tender prices were obtained for a variety of bus types from the
same manufacturer, making the differences between bus types highly valid. These
more recent and relevant prices were used for the purposes of this report. The
prices[37]
are:
Ø
Diesel
40’ LF - $385,840
Ø CNG 40’ LF - $418,273
The CNG bus price
stated above includes a 2007 certified engine.
The diesel price is for a bus with a 2006-certified engine. It is expected that the 2007
diesel engine prices will increase due to the cost of the necessary
after-treatment systems required to make them compliant. Only one manufacturer released a cost
estimate[38] of $7,500
(plus applicable taxes). This additional cost was factored into the model only
from the second year as the City of Ottawa has obtained from its preferred
supplier assurance that, in the event of a diesel-powered bus purchase,
pre-2007 engines would be mounted on the first year delivery of buses[39]. This also means, however, that the City
would, for the first year, be purchasing buses with higher emissions than
others available in the marketplace.
Fuelling Installations
and Equipment
The
cost of CNG fuelling stations varies significantly as a function of several
“site specific” factors. The scope of sustain-ABILITYTM’s mandate
did not include preliminary design and detailed costing, nor did it include
comparing a variety of possibilities for the garages of the City of Ottawa.
Based
on information provided by the City of Ottawa, a Consortium member (Clean
Energy) has developed a budget price for a single fuelling station (capacity of
300 buses) to be located at Merivale. The Clean Energy budget estimate for this
system is all-inclusive and amounts to $7.8M (including taxes). However, this
estimate does not comply with the City’s deployment plan for the new buses.
Nevertheless,
the Clean Energy estimate was evaluated for the accuracy of cost magnitude
using several sources: fuelling station components described in the McCormick
Rankin (MCR) TTC report and actual costs obtained from other locations. The
replies from other locations range from $2.33M to $9.1M. They were built in one
to three stages and the largest could accommodate a 300-plus bus fleet. All are
outdoor facilities.
The
MRC cost projection was largely based on the 1999 Hamilton installation. It is
within the range of the other locations examined. It has been modified to
accommodate two stations for a split CNG fleet. This has yielded an estimate of
$5.4M for each of two smaller stations (125 buses each) and $7.8M for a larger
station, if the entire fleet were to be housed in one garage. These estimates
are for an outdoor facility with a weather protection enclosure (a roof and
partial walls). The adapted modified estimates are presented hereafter:
Table 15 -
Fuelling Station Cost Estimates
|
Component |
Unit $
(1999) |
# |
Cost
per 125-Bus Station ($) |
|
Compressor (1000 scfm each) |
225,000 |
2 |
550,000 |
|
Storage Vessels |
150,000 |
1 |
100,000 |
|
Gas Dehydrator |
200,000 |
1 |
150,000 |
|
Dispenser |
60,000 |
3 |
180,000 |
|
Back-up Generator |
500,000 |
1 |
500,000 |
|
Weather Enclosure |
300,000 |
|
300,000 |
|
Control/Emergency Shutdown System |
100,000 |
1 |
100,000 |
|
Electrical |
250,000 |
|
150,000 |
|
Installation |
650,000 |
|
450,000 |
|
Noise Barrier |
300/m |
30m |
9,000 |
|
Subtotal |
|
|
2,489,000 |
|
Change Orders |
10% |
|
249,000 |
|
Engineering |
20% |
|
498,000 |
|
Contingency |
15% |
|
373,500 |
|
Total |
|
|
3,610,000 |
|
Inflation Adjusted at 2.5% p.a. |
|
|
4,292,000 |
|
Adjusted to CE
(pre-tax) |
|
|
5,400,000 |
Note: The Clean Energy estimate of $7.8M for a 4,800 scfm, 4-skid
station capable of fuelling the complete fleet of 226 buses has been used to
proportionally update the estimate for the two stations for a split fleet.
Source: sustain-ABILITYTM, 2006
Ottawa
is particularly “site specific”. The St-Laurent yard is large and has
complex circulation patterns due to several phases of growth, on and around the
site. It has three major buildings, the transit administration offices and two
operating garages (that include the central major repair shops). The natural gas source (a high-pressure main
line) is located on the Northwest side of the site and there are several areas
where the compressor station could be located (please see Diagram 7). The
existing fuelling lanes are on the Southwest side of the building and, in many
cases, this would entail piping 3000-psi natural gas across the site or
relocating the fuelling and service lanes to a dedicated stand-alone enclosure
type facility on the Northwest side.
There
are four possible locations for the compressor units. The overall price of the installation could vary widely between
those locations as a result of electrical, natural gas feedstock and CNG
routing. The $5.4M estimate would, in all cases, be insufficient to accommodate
the peculiarities of St-Laurent South by 20% to 25%. None of these possible sites have been independently
verified by the Facility Management Division of the City and would be subject
to preliminary and detailed designing work.
Diagram 6 - Possible Location of Compressor Unit at St-Laurent South
Source: sustain-ABILITYTM
The Merivale
yard has limited space around the building that is currently all used for
parking or circulation. In its
proposal, Clean Energy has identified Merivale as the ideal site for the
fuelling station.
Diagram 7 - Ideal Location of Compressor Unit at Merivale
Source: Clean Energy, 2006
In
order to comply with the City’s deployment plan, sustain-ABILITY™ has
incorporated the following assumptions regarding fuelling stations and their cost in its model:
Ø One fuelling station at Merivale with a 125-bus capacity: $5.4 million plus taxes;
Ø One fuelling station at St-Laurent South with a 125-bus capacity: $6.6 million plus taxes;
Ø No fuelling station has been planned at Swansea where engine rebuilding occurs. Bottled CNG will be sufficient to run dynamometer tests.
Facilities Upgrade
The
use of CNG fuel in transit fleet requires several changes to the building
housing NGVs to ensure the safety of personnel and property. Such changes are either dictated by
regulations like the Ontario Building Code (OBC), Fire codes (NFPA), Ventilation
codes (ASHRAE) or determined by the design engineer using various guidelines.
The OBC does not specifically deal with a particular fuel but it refers to
ASHRAE Standard 62 and NFPA that does.
There are two scenarios to consider when analysing
facilities upgrades each having different requirements:
a) indoor bus fuelling- requires a dedicated room
within a building that has other primary functions
b) buses parked or being serviced that are not
empty (not covered by station regulations).
Indoor
Fuelling
In the event of the adoption of CNG powered
buses, the City planned to adapt the existing interior fuelling bays to CNG
while retaining its diesel capability. This would eliminate the weather
protection enclosure but will undoubtedly add to the facility upgrade
ventilation costs. In the absence of applicable codes in this regard, any plan
to co-locate fuelling infrastructure for different fuels, particularly in an
indoor environment, would require consultation with the Authorities Having
Jurisdiction, including the Technical Standards and Safety Authority and the
local Fire Marshall.
In Appendix B of CSA B108-99, the Natural Gas Fuelling Stations Installation Code addresses the requirements for indoor fuelling within a building that has primary functions other than fuelling. The requirements are different depending on whether the transfer of fuel will be equal to or greater than 1000 scf in five minutes. The facility proposed for Ottawa would be considered High-flow Fuelling and, consequently, subject to the requirements of the Code applicable thereto, including a dedicated fuelling room which must:
Ø be designed and constructed to prevent the accumulation of gas in the fuelling room from exceeding 20% of the lower explosive limit of the fuel;
Ø have at least one exterior wall, which may be the entrance door;
Ø have a two-hour fire rating for walls common with the building;
Ø have a ventilation rate that is 20 times the maximum flow rate of the fuelling system;
Ø have a number of air changes sufficient to prevent an excessive accumulation of gas, while fuelling is in progress, as a function of the volume of the fuelling area;
Ø have a roof designed and constructed to prevent the accumulation of gas;
Ø have an appropriate methane detection system and alarm/shutdown system in the event of failure of the ventilation system;
Ø have no pressurized equipment other than dispenser and hose inside;
Ø fresh air intake at ground level to prevent re-entry of exhaust air;
Ø provision for explosion relief (deflagration) according to NFPA 68 (basically, a wall or ceiling must be allowed to blow out to prevent the pressure of an explosion from being contained); and
Ø have an operator trained in applicable safety and operating procedures (there is no minimum qualification for such personnel).
According to B108, the ventilation requirements for the dedicated fuelling room when not fuelling buses is much less stringent than normal building code and health requirements and can therefore be met without regard to the CNG buses.
Indoor Bus Service and Storage
If the CNG buses are serviced or stored indoors, special precautions are required to prevent the accumulation of natural gas. Some transit operations completely empty (de-fuel) a CNG bus before servicing regardless of the system being maintained. This technique requires additional equipment to safely remove the stored gas from the vehicle and to move the vehicle in and out of service areas as it cannot move under its own power without fuel. Storing fully fuelled CNG buses indoors is rarely done. In situations where the bus cannot or is not emptied before coming indoors, extra ventilation is required in case of a leak from the bus.
The OBC does not specifically address specific fuel types, but refers to ASHRAE Standard 62 (Ventilation for Acceptable Indoor Air Quality) which references NFPA Standard 52 (Compressed Natural Gas Vehicular Fuel Systems Code) and FTA Guidelines. The OBC, in 6.2.2 Ventilation, states “Except in storage garages and repair garages covered by Article 6.2.2.3, the rates at which outdoor air is supplied to rooms and spaces in buildings by ventilation systems shall not be less than the rates required by ASHRAE Standard 62, Ventilation for Acceptable Indoor Air Quality.” This means that ASHRAE 62 covers the remainder. ASHRAE Chapter 13, “Enclosed Vehicular Facilities”, covers tunnels, bus terminals, bus garages, etc. ASHRAE deals with specific fuels and references various NFPA codes. Therefore the OBC, indirectly, provides guidelines for the Transitway Stations and the natural gas and hybrid electric aspects of the garages.
In
addition to the OBC and ASHRAE, the following are often used a references by
designing engineers:
·
“Design
Guidelines for Bus Transit Systems Using Electric and Hybrid Electric
Propulsion as an Alternative Fuel” FTA March 2003 (US Department of
Transportation, Federal Transit Administration)
·
“Garage
Guidelines for Alternative Fuels”
·
NFPA
72 (Battery Storage)
· CSA B108-99 (Natural Gas Fuelling Station Installation Code)
·
CSA C22.1-02: Canadian Electrical Code
Part I Safety Standard for Electrical Installations
·
O.Reg.388/97: Ontario Fire Code, as
amended
·
NFPA
88A (Repair Garages)
· DOT 1996 (US FTA CNG facility guidelines) and Design Guidelines for Bus Transit Systems Using Compressed Natural Gas as an Alternative Fuel[40]
While
not all these references have direct jurisdiction in Ontario, the owner and the
designing engineer are responsible for providing a safe environment. In the
absence of codes or regulations directly applicable in Ontario, the
designer/engineer will refer to and use any relevant, valid international
standards and guidelines to achieve this.
Garages
The City of Ottawa has four transit garages in three locations. The main facility on St-Laurent Blvd has two bus garages and an office building. Merivale and Pinecrest are satellite operating and maintenance garages. A fourth (an addition to Swansea) and a fifth (Industrial Avenue) garages are in the planning stage with construction starting in 2007. The Industrial site will be designed for articulated buses and Swansea is a major overhaul facility for all Ottawa vehicles.
The following table is a summary of information relevant to the analysis of NGV implementation.
Table 16 -
City of Ottawa Transit Garage
Comparison
|
|
St-Laurent S |
St-Laurent N |
Pinecrest |
Merivale |
|
Location |
1500
St-Laurent |
1500
St-Laurent |
2550
Queensview |
164 Collonade South, Nepean |
|
Year Open |
1959 |
1987 |
1976 |
1978 |
|
40-foot Bus Capacity |
275 |
207 |
193 |
275 |
|
Functions |
Service/Fuel, Dyno, Repair,
Rebuild, Bus Storage |
Repair, Body, Artic PM,
A/C, Bus Storage |
Service/Fuel, Repair, A/C,
Dyno, Bus Storage |
Service/Fuel, Repair, A/C,
Dyno, Bus Storage |
|
Service Lanes |
2 |
1
(exterior) |
2 |
2 |
|
Fuelling Station |
2 |
1
(exterior) |
2 |
2 |
|
Ceiling Structure |
Pre-cast, close webs 2’ on
centre |
Open web steel |
Pre-cast, webs approx 8’ on
centre |
Open web steel |
|
Potential Gas Pockets |
yes, many |
no |
yes |
no |
|
Gas Detection System |
no |
no |
no |
no |
|
Door/Exhaust Fan Interlock |
no |
no |
no |
no |
|
Heat – Repair -
Fuel -
Storage |
Direct + indirect Forced air Direct |
Direct Direct Direct |
Indirect Indirect Indirect + direct |
Direct Direct Direct |
|
Vent’n – Repair - Storage - Fuel |
code code upgraded |
code code n/a |
code code upgraded |
code code upgrade in progress |
|
Make-up Air Supply Outlet |
Mid-wall |
Mid-wall |
Mid-wall |
Lower third |
|
Exhaust Points |
Ceiling |
Ceiling |
Ceiling |
Ceiling |
|
Electrical Sub |
Room |
Room |
Room |
Room |
|
Sub Capacity |
2000 |
800 |
1200 |
1200 |
|
Emergency Generator |
Yes, no spare |
no |
Yes, small |
Yes, small |
|
Lighting |
Metal halide |
Metal halide |
Florescent, sodium |
Metal halide, florescent |
|
Compressor Space |
NW side possible but fuel lanes
on SW side |
|
N and E sensitive
residential, S area needed for street expansion |
Limited space all currently
used for parking or circulation |
Source: sustain-ABILITYTM, 2006
In order to determine the cost of upgrading the City’s facilities to CNG standards, sustain-ABILITY™ has relied on the most recent information available and performed further analysis of the TTC/MRC report to determine the following cost per square meter:
Table 17 -
Garage CNG Upgrading Costs Parameters[41]
|
Construction
Type |
TTC Comparable Site |
Total Unit
Cost $/m2 |
CNG-Related Unit
Costs $/m2 |
|
Open Web Steel Truss type |
Arrow Road |
$747/m2 |
$542/m2 |
|
Pre-cast Concrete type |
Birchmount |
$855/m2 |
$580/m2 |
|
Specialty Shops |
|
$780/m2 |
$530/m2 |
Source: sustain-ABILITYTM, 2006
In the sustain-ABILITY™ reconstructed model, costs were inflated from 2004 to 2006 at 2.5% annually. Specific site analysis is presented in the following sections.
The City Staff stated that the garages are currently in compliance with current code requirements for diesel[42]. In the event of the adoption of CNG-powered buses, the City would choose to adapt the existing interior fuelling bays to CNG while retaining its diesel capability. This would eliminate the weather protection enclosure but will undoubtedly add to the facility upgrade ventilation costs.
Although there is no specifically applicable code for ventilation for Ontario CNG indoor refuelling facilities[43], Section 6.2.2.3 of the OBC requires a continuous supply of outdoor air at a rate of not less than 3.9 litres/second for each square metre of floor area in an enclosed storage garage and 700 litres/second per internal bay in a repair garage. This generally translates into three air changes per hour for storage and six air changes for the repair operation. The OBC does not specifically refer to a fuel type, but references ASHRAE Standard 62 (Ventilation for Acceptable Indoor Air Quality) which references NFPA Standard 52 (Compressed Natural Gas Vehicular Fuel Systems Code) and FTA Guidelines. The general result is six air changes per hour for the entire CNG garage with a purge capability of 12 air changes per hour.
CSA B108-99, Natural Gas Fuelling Stations Installation Code was amended in 2001 to address indoor fuelling within a building that has primary functions other than fuelling. The requirements for a high-flow fuelling facility such as those required in Ottawa were described in detail in section 4.1.1
St-Laurent South
 St-Laurent South is
the major mechanical repair garage and a full service-operating garage. It has
a pre-cast concrete ceiling with tees approximately two feet on centre. This
creates many potential gas pockets. The heating is direct fire gas units and
the lighting is metal halide. The TTC Birchmount is a similar facility but
slightly smaller.
St-Laurent South is
the major mechanical repair garage and a full service-operating garage. It has
a pre-cast concrete ceiling with tees approximately two feet on centre. This
creates many potential gas pockets. The heating is direct fire gas units and
the lighting is metal halide. The TTC Birchmount is a similar facility but
slightly smaller.
Upgrading the St-Laurent South facility to NGV standards, because of the two-foot pattern of the pre-cast ceiling and the larger area could significantly exceed the TTC Birchmount estimate of $8.4M. Using again the TTC Birchmount facility as a benchmark and adjusting proportionally, the additional cost of upgrading the St-Laurent South ventilation system to CNG standards is estimated at $3.8 million plus taxes.
The total cost of upgrading the St-Laurent South facilities to CNG standards used in the reconstructed model is therefore estimated at $11.8M, exclusive of the fuelling station and taxes.
St-Laurent
North
St-Laurent North is a repair and bus storage garage that houses three central major repair shops – Body Repair, A/C Repair and Interior Clean. It does not have indoor fuelling lanes. The ceiling is open web steel. The heating is direct fire gas units and the lighting is metal halide. The TTC Arrow Road facility is similar but larger. The cost of upgrading the three relevant shops at St-Laurent North would be $3.6M (plus taxes) based on the MRC estimate for the Duncan Shops at TTC. The additional cost of upgrading the St-Laurent North shops’ ventilation system to CNG standards is estimated at $1.7 million plus taxes.
The total cost of upgrading St-Laurent North facilities to CNG standards used in the reconstructed model is therefore estimated at $5.4M, exclusive of the fuelling station and taxes.
Merivale
Merivale is a service/fuel, repair and bus storage garage. The ceiling is open web steel. The heating is direct fire gas units. The lighting is metal halide and fluorescent. The TTC Wilson garage is similar in construction and size. Upgrading this facility to NGV standards could be similar to the TTC Arrow Road facility. sustain-ABILITY™ estimates a cost of $10.7M for this facility. Ventilation upgrade costs are estimated at $4.0M plus taxes based on the TTC Arrow estimates made by MRC.
The total cost of upgrading the Merivale facilities to CNG standards used in the reconstructed model is therefore estimated at $14.7M, exclusive of the fuelling station and taxes.
Swansea
The transit dedicated portion of the Swansea facility is dedicated to rebuilding engines. It is equipped with a dynamometer room (16 m2) and is slated for a 2,400 m2 addition dedicated to partial rebuilds and engine replacements. We have therefore estimated that 2,420 m2 must be CNG compliant, with the bulk being built new at current standards and the dynamometer room having to be upgraded.
Based on comparable scope of work at a comparable facility at TTC (Duncan), sustain-ABILITYTM’s calculations based on the MRC estimates provide a cost of $252/m2 to make the relevant sections (new and old) of Swansea CNG compliant. The cost used in the reconstructed model is $609,840 (plus taxes) and includes all ventilation costs associated with CNG requirements.
No fuelling station has been provided for this facility where low-pressure bottled natural gas (stored outside the room) or a direct feed from the network supply will suffice for dynamometer testing.
The table below provides a summary of the facilities upgrade cost estimates used in the CNG model reconstructed by sustain-ABILITY™:
Table 18 -
CNG Garage Upgrading Costs (including
taxes)
|
Garage |
CNG Only ($) |
Ventilation ($) |
Total Cost ($) |
|
St-Laurent South |
8,633,671 |
4,093,551 |
12,727,222 |
|
--- Partial Areas (included in total) |
|
|
|
|
|
|
|
|
|
St-Laurent North |
|
|
|
|
- Body Shop |
1,854,576 |
874,800 |
5,798,239 |
|
- Interior Clean |
1,684,573 |
794,610 |
|
|
- A/C Repair |
400,680 |
189,000 |
|
|
|
|
|
|
|
Merivale |
11,539,202 |
4,364,458 |
15,903,660 |
|
|
|
|
|
|
Swansea |
658,627 |
|
658,627 |
|
|
|
|
|
|
Total (including taxes) |
24,771,329 |
10,316,419 |
35,087,748 |
Source: sustain-ABILITYTM, 2006
Transitways
As new CNG buses would be required to be available on transitways, three stations will be affected: the St-Laurent Station, the Riverside Station and the Queensway Station. The scope of the study did not provide for the resources required to conduct proper analysis of gas flows. Such analyses determine the quantity of ventilation required for such areas and therefore, it was not possible to obtain quotes on the cost of adapting the three stations. Based on the experience of sustain-ABILITY™ with a similar situation, an approximate amount of $2 million (plus taxes) has been set for adapting the three stations.
4.1.2 Other Soft, Non-Recurring Costs
The
training of maintenance personnel is a routine operation for transit
systems. However, the introduction of a
different technology requires an exceptional, one-time training of all
maintenance personnel. This
non-recurring cost was calculated on the basis of 172 maintenance employees
(those working in the two facilities where CNG buses would be deployed) and 40
hours per employee.
Drivers,
as well, require a training session to familiarize them with the new
technology. As it is not possible to
determine which driver will be assigned to CNG buses for the 18—year life of
the bus, all drivers were considered for a training session of four hours at a
rate of $44.80/hour[44],
a rate that reflects the overtime rate that would apply in such
situations.
Initial
training for all drivers and maintenance personnel has been scheduled in the
first three years and no cost has been attributed for further training as it is
generally included in routine O&M costs.
4.1.3
Summary of Capital Costs
The
following table summarizes all capital investments required. The total cost column
reflects the increases arising from inflation over the period, but not the net
present value of these costs.
Table 19 -
Capital Cost Summary for CNG Case
|
Reconstructed CNG Business Case |
Unit Cost |
Lifecycle |
|
Capital Investment |
|
|
|
40-foot Buses (adjusted for inflation,
including GST) |
$418,273 |
$95.4 M |
|
Building and Infrastructure Cost
(excluding taxes) -
Buildings |
(see table 16) |
$35.1 M |
|
Other Soft, Non-Recurring Costs |
$2,840 per person |
$0.7M |
|
Total Capital Costs |
|
$146.3M |
Source: sustain-ABILITYTM, 2006
4.1.4 Operating Costs
Fuel
Fuel
cost calculations for CNG vehicles must include the following:
Ø Natural gas;
Ø Fuelling station operation and maintenance;
Ø Electricity for the station;
Ø Fuel efficiency and consumption.
The
survey conducted in the context of this study provided CNG fuel costs ranging
from $0.132/km to $0.576/km. The TTC disclosed fuel costs of $0.29/km.[45]
Numerous factors explain this wide variation, including …
Ø The age and type of equipment used in the fuelling station;
Ø The price of natural gas and the manner with which it is being purchased;
Ø The cost of electricity at each site;
Ø The age and type of buses used by the transit systems;
Ø The way drivers use the bus; and,
Ø The duty cycle of the buses used.
All
the information required to undertake a thorough analysis of these cost
variances for each of the transit systems participating in the sustain-ABILITY™
survey is unfortunately not available to sustain-ABILITY™ and is beyond the
scope of this mandate.
Natural Gas
Natural
gas feedstock represents over 85% of the cost of CNG fuel. Four respondents
supplied information on this most important component:
|
Ø Transit System C: $0.667 / DLE |
Ø Transit System F: $0.409 / DLE |
|
Ø Transit System H: $0.634 / DLE |
Ø Transit System I: $0.612 / DLE |
Variability in gas prices is not
uncommon, new, nor is it unique to CNG. In November 2004, 11 members of a transit
users group[46] reported
that their latest diesel prices ranged from $1.32 - $2.20 per gallon. At the same time, their natural gas costs
ranged from $0.86 - $2.02 per diesel-gallon equivalent (DGE). The 55% variance between
transit systems that reported their natural gas prices to sustain-ABILITY™
falls well within the range reported by that group and is reflective of the
following factors:
Ø The volume of natural gas purchased by the transit system;
Ø The location of the transit system;
Ø The natural gas supplier and the specific situation at the time of purchase (capacity utilisation rate of the network, availability of future contracts, etc.);
Ø The source of natural gas (well, gate and distributor);
Ø The timing of the purchase of natural gas;
Ø Foreign exchange rates on currencies;
Ø The method of purchasing natural gas (spot market, vs. long-tem contracts vs. hedging).
The
latter three factors are probably the most important. Natural gas is a widely-traded commodity with the particularity
that its price is much more regionalised than oil-based commodities such as
diesel fuel. Recently, natural gas
prices have been falling from their most recent peak in December 2005, as shown
in the following diagram, to a current price of $6.319/mmBTU (NYMEX, Sept 8, 2006).
Diagram 8 - Recent Natural Gas Prices (2003-2006), in USD
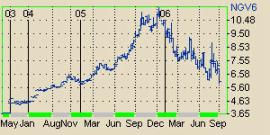
Source: NYMEX, September 9th,
2006
Given
the volatility of the natural gas market, this situation is temporary as
Canadian prices are expected to increase back to $7.50/mmBTU in the last
quarter of 2006 to eventually hover around this level for several years
according to GLJ Petroleum Consultants Ltd.[47],
a well renowned Canadian consulting firm.
Diagram 9 - Natural Gas Prices

Source: GLJ Petroleum Consultants Ltd., http://www.gljpc.com, September
2006
Modelling
and commodity price forecasting far exceed the current scope of this
study. Nevertheless, MARCON has
produced a composite index of natural gas price based on the two most reliable
sources of information available (the Energy Information Agency [IEA] and GLJ
Petroleum Consultants Ltd) in order to ascertain the reliability of a bid
provided by Clean Energy (a Consortium member). The following diagram portrays the combined price variations in
the price of natural gas over the forecast period.
Diagram 10 - Natural Gas Price Variations, 2007-2030 (2007=100)

Source: MARCON, 2006
The
City of Ottawa benefits from a firm bid submitted by Clean Energy[48]
(CE) at a bundled price of $0.56 per DLE for natural gas and compressor
maintenance. Sales taxes are not included on the compressor maintenance portion
of this price and are estimated at $0.0084/DLE. The cost of electricity
required for compression is not included in this estimate and will be discussed
in an upcoming section. The bid is from
Clean Energy valid for a period of 30 days (to October 5th, 2006).
Natural
gas can be purchased in bulk with firm prices valid for as long as ten years.
However, current regulations prohibit Enbridge (the local gas distributor and a
member of the Consortium) from offering a long-term fixed cost contract
directly to the City. This explains the bundling of the natural gas price and
fuelling station maintenance in a quote submitted by a Consortium member in the
context of this project.
The
CE proposal can be advantageous to the City despite the labour issues that may
arise from outsourcing the maintenance of the fuelling station to a third
party.
The
use of prices from CE’s bid in sustain-ABILITYTM’s calculations is
based on the following assumptions:
Ø Potential labour issues arising from the use of a subcontractor for fuelling station maintenance can be overcome;
Ø Other suppliers can provide bids for equivalent goods and services, thereby maintaining a competitive environment favourable to the City of Ottawa;
Ø
Despite the incompleteness of the
information available to the bidder at this time, the prices provided are
sufficiently accurate for the purposes of this study.
sustain-ABILITY™ therefore relied on the Clean Energy bid
over the 20-year period (representing the expected life of the new CNG fleet)
to reconstruct the CNG business case but made adequate changes to reflect
foreseeable implementation conditions.
As the
City will likely be unable to enter into a long-term agreement with a gas
supplier until the first quarter of 2007, the natural gas feedstock component
of the Clean Energy bid has been adjusted to reflect the anticipated market
conditions at that time using the MARCON Composite Index. The price used in the
sustain-ABILITY™ model was calculated as follows:
Ø Current bid
from Clean Energy (bundled) $0.530
/ DLE
Ø Assumed
compressor maintenance cost component $0.060
/ DLE
Ø Natural Gas
feedstock component of CE price $0.470
/ DLE
Ø 2007 MARCON
Composite Index 1.11176987
Ø Adjusted
Natural Gas feedstock price $0.522
/ DLE
Ø Taxes on
compressor maintenance (8%) $0.006
/ DLE
Ø Adjusted fuel
& services cost used by sustain-ABILITY™ $0.589
/ DLE
The CE bid provides for a ten-year period at the same cost with only the differential increase of the inflation rate used as an escalation clause. After the ten-year period, sustain-ABILITY™ assumed that another contract would be negotiated with a supplier for the remaining ten years of the life of the CNG bus fleet. Adjustments in the price of natural gas feedstock were therefore made by sustain-ABILITY™ to reflect the anticipated price variation of the commodity using the MARCON Composite Index.
Calculations made according to these
assumptions are:
Ø Adjusted
Natural Gas feedstock price (2007) $0.522
/ DLE
Ø
2007 MARCON Composite Index (2018) 1.048088706
Ø Adjusted
Natural Gas feedstock price (2018) $0.544
/ DLE
Ø Compounded
inflation to 2018 at 2.5% / yr 28%
Ø Anticipated
impact of age on compressor maintenance cost 20%
Ø Inflated and
adjusted cost of compressor maintenance $0.089
/ DLE
Ø Taxes on
compressor maintenance $0.007
/ DLE
Ø Anticipated
fuel & services cost used by sustain-ABILITY™ (2018) $0.640 / DLE
Compressor Operation & Maintenance
The
sustain-ABILITY™ survey revealed compressor maintenance costs of $0.049, $0.138
and $0.144/km. Among the two most
expensive costs, a transit system from Western Canada currently relies on
outsourcing its fuelling station maintenance to a third-party supplier and
anticipates these costs would increase by as much as 25% if it renewed its
contract in the short term. However, this service contract is not bundled with
a natural gas feedstock contract.
The
variation of compressor maintenance cost is mainly explained by the following
factors:
Ø The age, type and condition of equipment used;
Ø The source of maintenance (transit system personnel vs. sub-contractor);
Ø The maintenance policies of the transit system (ex. Frequency of overhauls);
Ø The provisions of a service contract (ex. on-site personnel or not);
Ø The bundling of maintenance services with other components, such as fuel.
This
last factor can account for a large portion of the cost variance. When services are bundled with fuel, the
contractor benefits from a greater margin of error in its cost estimates as the
services represent less than 10% of the total quoted price of the fuel and
service bundle. Buyers of high volumes of natural gas can easily absorb 10% of
the bundled cost of a contract with a few trades on future contracts. Their ability to secure customers with high
gas volume requirements is much more critical to the success of their business
than the risk of underestimating the cost of maintaining equipment. Providers of long-term bundled contracts
therefore price maintenance services aggressively in order to secure gas supply
outlets for their trading activities.
The
operating cost of modern CNG fuelling systems has been greatly reduced by
automation. In Ontario, compressors of 3.816 or more
Therm-hours are subject to the Operating Engineers Act. The compressors
included in the fuelling stations discussed in section 4.1.1 are all rated at
10.176 Therm-hours (or less) for each station. Their operation must therefore
submit to Regulation 904s 21(2) (a) of the Act, which states they can be
operated 24 hours per day with one person designated
as the operator in charge. The ‘designated operator’ can be a Stationary
Engineer (fourth class) or a Compressor Operator.
The designated operator in charge is not
required to tend to the compressor operation on a full-time basis but he/she
must be on-site. Staff fuelling or cleaning the buses can be certified as shift
operators at a small, one-time cost.
Therefore, sustain-ABILITY™ has not included dedicated stationary
engineers in its calculations. Utilizing existing Staff as the ‘designated operator’ in this way would
not entail significant costs for the City of Ottawa.
Electricity
Calculations performed by the Consortium
in its original business case used Ottawa Hydro’s rates and were accurate. These calculations yielded a $0.016/km
cost. However, sustain-ABILITY™ took
the forecasted increase in the price of electricity into consideration in its
reconstructed model.
The
following increases were applied on an annual basis:
Table 20 -
Forecasted Electricity Price Increases
|
Year |
Cost
increase |
|
2007 |
31.58% |
|
2008 |
-4.00% |
|
2009 |
4.17% |
|
From 2010 |
2.50% |
Source: Delphi
Group[49]
(to 2009) and CPI from 2010
Fuel Efficiency and Consumption of CNG
buses
sustain-ABILITY™ obtained CNG fuel consumption data from 11 different sources. Answers ranged from 0.56 to 1.23 DLE/km with an average of 0.83 DLE/km. This variation can be explained by numerous factors including age of the bus, engine, transmission, climate, payload, duty cycle, bus driver and several more. Three Canadian transit systems provided data. Given that they operate in similar climatic conditions with a duty cycle approximating that of Ottawa, sustain-ABILITY™ considered averaging their fuel consumption as input in the CNG reconstructed model (0.78 DLE/km).
The more recent literature reviewed in the
context of this study confirms that more recent CNG buses considered by the
City display better fuel consumption than earlier models. However, little “in-service” data available
confirms these assertions and sustain-ABILITY™ opted to conservatively retain
the 0.76 DLE/km fuel consumption used by the Consortium (based on TTC data) in
the reconstructed CNG model as the duty cycle of Toronto is assumed to
approximate that of Ottawa. Note that the 40-foot diesel buses currently
operated by the City of Ottawa consume 0.595 litres/km[50].
These are, of course, not equipped with 2007-compliant emission control
technologies.
Fuel
consumption data was used to determine fuel costs. The combination of the
factors described above yielded an all inclusive fuel cost of (0.76 l/km *
$0.586/l) $0.446/km for CNG buses in the first year, slightly less than
conventional diesel buses at $0.480/km. The difference in the cost per kilometre
is mainly explained by the low price of natural gas provided by CE used in
sustain-ABILITYTM’s calculations.[51]
Bus Maintenance
High
quality cost comparisons of CNG vs. Diesel buses are difficult to find in the
literature. The best two studies in that area were conducted by NREL and relate
to NYCT[52]
and KCMT[53]. In the both reports, CNG and DEH buses had
similar total maintenance costs per mile (a 4% lower cost for DEH in KCMT and a
5% lower cost for NYCT). At the date of publication of this report, consistent results from the field are
non-existent, nor is perfectly comparable-to-Ottawa data available.
Bus
maintenance costs are dependent on several variables. Labour rate and
replacement parts and supplies are important components but the duty cycle, the
operator, the transit system maintenance policies and the buses themselves also
account for a substantial portion of maintenance costs. While the replacement parts and supplies
costs are comparable from one site to the other, labour rates vary widely from
one system to the other.
Six
replies to the sustain-ABILITY™ survey included CNG bus maintenance costs,
which ranged from $0.1186 to $0.899/km. Such a wide variation is not unusual as
the MARCON-DDM database contains rates for conventional diesel bus maintenance
that indicate a spread of $0.86/km between the transit system with the cheapest
maintenance cost and the one with the most expensive. Here again, many factors, such as the age of the fleet (typically
lower in the US), the type of bus, the duty cycle of the buses and the hourly
shop rates, have a significant impact on O&M costs.
The
sample obtained by sustain-ABILITY™ in its survey regarding the cost of
maintaining CNG buses provides inconsistent data.
Location
“A” provided the
most detailed data set but much of it is based on pre-2004 experience. For
example, the only information available from this location refers to 1997
diesel buses and 1998 CNG buses.
Table 21 -
Maintenance Costs, Ontario Transit System, 2001-2005
|
Year |
10-1997 Diesel $/km |
20-1998 CNG $/km |
CNG vs. Diesel % |
|
2001 |
0.4876 |
0.6266 |
+13.9% |
|
2002 |
0.5008 |
0.859 |
+35.8% |
|
2003 |
0.5954 |
0.7695 |
+17.4% |
|
2004 |
0.738 |
0.6637 |
-7.4% |
|
2005 |
0.7742 |
0.8759 |
+10.2% |
|
Average: |
+14.0% |
||
Source: sustain-ABILITYTM, 2006
Given the
progress made by CNG engine manufacturers since 1998 and the scope of this
mandate (pertaining to post-2002 buses only), this data set was considered
irrelevant to the analysis.
The only
information available for post-2002 engine technology is based on six and nine
months of data gathered from the first year of service of 20 CNG and 32
diesel buses from the same engine manufacturer. The results indicated that CNG
buses cost 42.6% more than
conventional diesel buses to maintain.
As shown above, there is a wide variability of results from one year to
the next and the rate of increase for each technology is different. Predicting
Ottawa’s maintenance costs on the basis of these results is very difficult.
Location
“D” reported[54]
cost data from their maintenance system on ten 2002 Orion VII/S50G for a period
of eight months from 2004-2005 and nine 1999 Orion V buses for a period of 12 months
in the same years. Detailed results are
presented in the following table:
Table 22 -
NYC Maintenance Operations Economics
|
|
WF Diesel |
WF CNG
(Evaluation) |
MCH Diesel |
MCH Hybrid
(Evaluation) |
|
Total Scheduled Repair
Cost per Mile |
0.30 |
0.29 |
0.30 |
0.29 |
|
Total Unscheduled Repair
Cost per Mile |
1.97 |
1.01 |
1.45 |
0.90 |
|
Total Maintenance Cost per
Mile |
2.27 |
1.30 |
1.75 |
1.19 |
Source: NREL Technical Report 540-38843, 2006
This
transit system reports that CNG buses cost between
35% and 75% less to maintain than their diesel-powered counterparts. The
typical duty cycle of buses in that transit system is usually much more
demanding than Ottawa’s but the CNG buses used in test were not equipped with
C-Gas Plus type engines.
Location
“I” results presented below focus on
the evaluation periods for each study group of buses: diesel buses, 12 months
(9/2001-8/2002); CWI CNG buses, 12 months (6/2003-5/2004); Deere CNG buses, six
months (4/2004-9/2004).
Table 23 -
WMATA Bus Maintenance Costs
|
|
Diesel |
CWI CNG |
Deere CNG |
|||
|
System |
Cost/mi |
Percent (%) |
Cost/mi |
Percent (%) |
Cost/mi |
Percent (%) |
|
PMI |
0.170 |
29 |
0.121 |
23 |
0.139 |
24 |
|
Engine/Fuel-Related |
0.122 |
20 |
0.135 |
26 |
0.126 |
22 |
|
Cab, Body,
Accessories, and Hydraulics |
0.104 |
17 |
0.109 |
21 |
0.170 |
29 |
|
Brakes |
0.067 |
11 |
0.034 |
6 |
0.066 |
11 |
|
HIVAC |
0.039 |
7 |
0.034 |
6 |
0.030 |
5 |
|
Transmission |
0.035 |
6 |
0.030 |
6 |
0.005 |
1 |
|
Air,
General |
0.016 |
3 |
0.003 |
1 |
0.003 |
1 |
|
Frame,
Steering, and Suspension |
0.015 |
3 |
0.026 |
5 |
0.006 |
1 |
|
Tires |
0.013 |
2 |
0.010 |
2 |
0.010 |
2 |
|
Lighting |
0.006 |
1 |
0.017 |
3 |
0.006 |
1 |
|
Axles,
Wheels, and Drive Shaft |
0.004 |
1 |
0.003 |
1 |
0.015 |
3 |
|
Total |
0.590 |
100 |
0.522 |
100 |
0.576 |
100 |
Source: NREL Technical Paper 540-37626, April 2006, p. 24.
Table 21
shows that the CNG fleet has average maintenance costs of $0.549/mile versus
the conventional diesel buses at $0.590/mile, thereby indicating that CNG buses
cost 7.5% less than diesel to
maintain[55]. When
considering total engine/fuel related items only, the CWI CNG buses had costs 11% higher and
the Deere CNG buses had costs 3% higher than the diesel buses.
Location
“K” gathered
maintenance data for the largest number of buses. The test lasted 12 months between mid 2005 and mid 2006. The system’s 299 CNG - 2004 NABI/C-Gas+
equipped buses cost $0.594/mile to maintain while the 193 conventional 2004
Neoplan/Cat ACERT diesel buses showed a $0.325/mile cost. In this case, CNG was 82.7% more expensive
than diesel.
However, the entire difference in ECD
versus CNG costs is not attributable to the differences in the CNG engine and
fuel system compared to the ECD engine and fuel system. The majority of these
costs are related to differences in the quality of the Neoplan and NABI buses,
and are shown in the higher running repair and maintenance campaign costs
required on the NABI fleet. Focusing solely on engine/fuel system related
maintenance, inspections and preventative maintenance, the CNG buses cost
$0.179 per mile to maintain compared to $0.107 per mile for the ECD buses. In this case the cost of the
engine systems and the preventative inspections were analyzed independently. Approximately $0.07/mile, were attributable to the differences
between CNG and ECD engine/fuel technology. Taking these into consideration still yielded
a difference in cost of 40% in favour of
diesel buses.
Additional
information on future maintenance costs is provided by TIAX[56]. It estimates that CNG buses will be 0.5% to 6.14% less expensive to
maintain than diesel-powered buses equipped with SCRs or NOx traps
respectively. In the case of the City
of Ottawa, these technologies would not come into the diesel-powered fleet
(standard or DEH) until 2008.
A recent
study of the previous CNG engine generation at location “K” (MBTA[57])
showed that overall maintenance on CNG buses was 83% more expensive than conventional diesel buses. Further
examination of the results revealed that the propulsion systems however
resulted in CNG being only 11% more
expensive than diesel buses to maintain.
In
the sustain-ABILITY™ sample, four of the systems provided a shop rate for
maintenance labour in the context of the recent survey conducted by
sustain-ABILITY™ ranging from $50/hr to $77.95/hr. The City’s shop rate is
currently $71/hr. Normalizing the data based on the actual fleet costs in
Ottawa and on the assumption that the labour to parts ratio is 73% to 27%[58]
provides a range of maintenance costs per kilometre from $0.11 to $1.08/km for
CNG buses. The following diagram is a bar chart illustrating the adjusted
maintenance rates.
Diagram 11 - CNG Bus Maintenance Costs in $ per Kilometre

Source: sustain-ABILITYTM, 2006
A critical assessment of these
adjusted results favours the elimination of the high and low results because
the duty cycle of the former (D) system is exceptionally difficult and because
the data provided by the latter is based on the highest hourly rate and inexplicably
results in the lowest maintenance cost.
In the final analysis, CNG buses will be maintained by the City to the same standards, using the same tradespersons, as are the existing diesel buses. The maintenance cost of a CNG bus should therefore be proportional to that of existing diesel buses. While the additional bus weight, ignition system, fuel system and fire suppression system normally generate increased maintenance costs for CNG buses, these additional costs are not substantial.
On the other hand, the advent of emission control technologies on 2007-compliant diesel engines is also expected to generate added maintenance costs for 2007-compliant diesel engines. In confidential discussions with a manufacturer of diesel and CNG engines, sustain-ABILITY™ was told that planned maintenance costs on CNG engines are expected to remain somewhat higher than those on conventional diesel engines, but that the gap observed in the past will close.
In
view of the above information, sustain-ABILITY™ considers the data provided by
NREL regarding NYTC and KCTC as the most reliable information available, in
addition to being the most recent.
After factoring the expected increase in maintaining 2007-compliant
diesel engines, sustain-ABILITY™ has
set the O&M bus cost at $0.805/km, slightly above (1%) that of conventional
diesel engines.
Summary of Operating
Costs
The
following table presents a summary of annual operating costs. Total fleet costs
do not include increases pertaining to inflation, fuel price variations or net
present value.
Table 24 -
Operating Cost Summary – CNG Fleet
|
Reconstructed |
August 2006 |
Lifecycle |
|
|
Operating Costs (taxes included) |
$ per km |
$ per bus |
Total Fleet Cost
($) |
|
O&M Cost (excluding fuel) |
0.805 |
47,620 |
193.9 M |
|
Fuel Cost (NG only) |
0.446 |
26,396 |
112.1 M |
|
Compressor Maintenance Cost |
|||
|
Electricity |
0.016 |
946 |
6.3 M |
|
Total Cost (not discounted) |
|
|
319.0
M |
Source: sustain-ABILITYTM, 2006
The
$0.446/km cost of fuel results from multiplying the price of CNG ($0.589/DLE including compressor
maintenance) by the anticipated fuel consumption of CNG buses (.76 l/km).
Penalties for the use of ULSD and ECTs are also applied in the sustain-ABILITY™
model but not shown in the preceding table.
4.1.5 Renewable Fuel Option
Users of CNG buses have several renewable fuel options. Natural gas (or methane) can be reclaimed from various biomasses including common landfill sites and animal waste. These renewable fuel options are discussed in more detail in sections 3.4.3, 5.2 and 5.4 but do not represent a reliable supply source in Ottawa at the time this study is published or in the short term.
In part because the FERS is intended to bring the Ottawa fleet toward zero emission alternatives, the use of hydrogen (H2) in a gas blend known as Hythane™ or HCNG has been considered and is discussed hereafter. The scope of this study does not, however, permit detailed consideration of other renewable fuel options for CNG.
This section is only intended to provide a high-level assessment of the incremental costs and savings that could result from the use of a renewable fuel, a hydrogen-methane blend generally known as HCNG, in transit buses in Ottawa. Cost estimates offered in this section are presented strictly as a general indication of the additional capital investments and operating costs involved in using this environmentally improved option. This section is not intended to enable the City to make a final decision regarding the use of HCNG as further investigation would be necessary to verify the accuracy of these estimates in Ottawa.
Hydrogen can be obtained from several sources and several processes, as described in the following diagram.
Diagram 12 - Sources of Hydrogen for HCNG blend

Blender
![]()
Source: MARCON-DDM, 2006
The production of so-called «Green Hydrogen» is only possible using renewable electric power for water electrolysis, reclaimed methane for methane reforming or by-product hydrogen obtained from a manufacturer that would normally vent or burn it.
Given the number of buses considered by the City and the relatively small quantity of hydrogen required, several factors make self-production of hydrogen unattractive in the short term for the City of Ottawa. In order of importance, they are:
Ø The capital cost of hydrogen production units;
Ø The resulting cost of hydrogen (per DLE);
Ø The on-site area required for on-site production of hydrogen; and,
Ø The social acceptability of building on-site hydrogen generators in some of the locations considered for the HCNG fleet.
Should the City decide to make a commitment to hydrogen buses within the next few years, the quantity of hydrogen required by the fleet would likely justify the cost of implementing an on-site hydrogen production unit. This unit can be added at any time during the 18-year life of the 226 buses currently considered by the City but, in the short term, outsourcing the delivery of hydrogen remains the most reasonable option.
Capital Costs
The use
of a hydrogen-CNG (HCNG) blended fuel requires slight modifications to the
conventional C-Gas Plus engine and auxiliary systems in the CWI HCNG
platform. Collier, a manufacturer that
has developed such a technology, indicates that «Assuming that a large number of stock HCNG engines were produced, the
incremental cost per engine would be very low compared to bus costs. For 1,000
produced engines, the cost would be less than (US)$5,000.»[59].
Conservatively, a cost of $10,000 has been used in sustain-ABILITYTM’s
forecasts as fewer than 10,000 engines have been produced to date.
In
addition to the engine, the fuelling station must also be modified in such a
way as to permit the blending of the fuels, their metering and dispensing. There are a number of options available to
obtain hydrogen on site. For the reasons described more particularly in Section
6.2, it is most likely that, in the near term at least, hydrogen would be
purchased from a third party and delivered and stored on site in liquid form[60].
From
that point, two technical options are possible:
1. Vaporized liquid hydrogen (LH2)
is mixed with natural gas before entering the compressor (option 1).
2. Vaporized liquid hydrogen (LH2)
is compressed separately from the natural gas and mixed with CNG using a
blending dispenser (option 2).
From
an incremental perspective, the investments required to upgrade a CNG fuelling
station to a HCNG fuelling station are, commonly and for each option, the
following:
- Cost elements common to
both options:
- Feedstock LH2 and
transportation of LH2 to Ottawa
- LH2 storage
on-site (including initial engineering and civil works) and equipment
maintenance
- Vaporizer and piping
- Security and safety
systems
- Costs elements specific
to option 1 (pre-compression blending)
- Natural gas compressor
upgrade (to accommodate H2)
- Blending-related control
systems
- Costs elements specific
to option 2 (post-compression blending)
- Additional H2
compressors
- Buffer tank for
high-pressure hydrogen
- H2 piping (to
dispenser)
- Upgraded mixer-dispenser
- H2 metering
and controls systems
- H2 gas
detection systems
Not
unlike natural service providers, industrial gas merchants can supply most of
the equipment required for such operations at a very competitive price. Although the equipment can be purchased, gas
merchants encourage their customers to enter into bundled contracts that include
all three elements: equipment, maintenance and H2.
Few
HCNG stations exist in the world and none are of comparable size to that which
Ottawa would require for its fleet of 226 transit buses using a 20% blend of
HCNG. Air Liquide Canada provided a rough estimate for such a project.
The
common costs described above range from $1.5M to $2.0M. Option 1 adds an additional $2M to the
project while the added costs required by option 2 could vary from 2M$ to $5M
for a high-end installation (top quality redundant compressors, for example).
Provided
that two stations are required in the mode of operation dictated by City Staff,
the common costs would double (totalling $3M) and the option 1 alternative
would add $1M per facility while option 2 would require $3M per site. In its calculations, sustain-ABILITY™
incorporated $6M in additional infrastructure costs.
Other infrastructure costs beyond those described above are deemed immaterial.
Operating Costs
 Assuming a 20% hydrogen blend, two metric tons of hydrogen would be
required every day (one delivery per two days on average). The current price for such quantities of
hydrogen is approximately $4/kg, to which a transportation charge of $1.65/km
per load must be added. The nearest H2
production facility of green hydrogen
is located in Bécancour (Québec), 644 km away from Ottawa[61]. The total delivered cost of hydrogen from
this Air Liquide plant would therefore be $4.27/kg or $1.29/DLE.
Assuming a 20% hydrogen blend, two metric tons of hydrogen would be
required every day (one delivery per two days on average). The current price for such quantities of
hydrogen is approximately $4/kg, to which a transportation charge of $1.65/km
per load must be added. The nearest H2
production facility of green hydrogen
is located in Bécancour (Québec), 644 km away from Ottawa[61]. The total delivered cost of hydrogen from
this Air Liquide plant would therefore be $4.27/kg or $1.29/DLE.
Hydrogen
prices usually follow the trend of natural gas prices because a dominant
proportion of the hydrogen commercially available is produced by reforming
methane. The price increase calculated by sustain-ABILITY™ over the forecast
period assumes that 48% of the price of H2 will vary according to
natural gas price fluctuations while the remaining 52% will increase at the
rate of inflation.
Table 25 -
Hydrogen Prices 2007 – 2027 (in $/DLE)
|
Year |
2007 |
2008 |
2009 |
2010 |
2011 |
2012 |
2013 |
2014 |
2015 |
2016 |
2017 |
|
|
$/DLE |
1.306 |
2.051 |
2.029 |
2.005 |
1.979 |
1.973 |
1.983 |
1.993 |
1.985 |
1.984 |
1.995 |
|
|
Year |
2018 |
2019 |
2020 |
2021 |
2022 |
2023 |
2024 |
2025 |
2026 |
2027 |
|
|
|
$/DLE |
2.009 |
2.025 |
2.036 |
2.048 |
2.064 |
2.076 |
2.092 |
2.107 |
2.122 |
2.124 |
|
|
Source: sustain-ABILITYTM, 2006
There are
very few HCNG buses in service on the market and therefore, little data is
available regarding bus performance. UC
Davis[62]
performed dynamometer tests using the CBD 14 cycle and obtained a fuel economy
improvement of 16% compared to CNG buses. The energy density of the HCNG
mixture being lower, a 20/80 H/CNG blend has shown to reduce the range of buses
by approximately 10%[63]. A study of HCNG and Hythane in city buses in
Malmo, Sweden showed reduction of fuel consumption of 14% with 8% hydrogen by
volume and 4% with 25% hydrogen.[64]
In a test
conducted by NREL[65],
the fuel economy of HCNG buses varied from 0.7 to 1.0 DLE/km or only 79%
of the performance of the best CNG bus on a comparable duty cycle as
illustrated in the following diagram:
Diagram
13 -
In-Service
Fuel Economy

Source: NREL Technical Paper 540-38707, 2005
The
preceding diagram shows an average 12.3% fuel economy reduction based on the
in-use data. Chassis dynamometer emissions testing, later in the project,
indicated fuel consumption penalties for HCNG buses of 10% and 14% on different
test schedules despite the fact that equivalent fuel economy was obtained for
CNG and HCNG engines in the laboratory engine dynamometer tests.
In view
of conflicting information from the sources identified (both of which use
limited samples in our opinion), the sustain-ABILITY™ reconstructed model input
for HCNG has been set at a fuel consumption rate for HCNG buses equal to that
of CNG buses.
The cost
of electricity for compressors was conservatively increased by 50% from the
estimate for CNG to account for the presence of H2 compressors.
Other
operating costs associated with the use of HCNG, in addition to those estimated
for the CNG business case, are insignificant.
Indoor fuelling using a 20% HCNG blend, for example, can be performed in
exactly the same way as it would be using CNG.
Table 26 -
HCNG Lifecycle Costs
|
|
Lifecycle Cost ($) |
|
Capital Investment Costs |
|
|
Bus acquisition |
99,337,387 |
|
Building and infrastructure costs |
56,687,748 |
|
Other soft, non-recurring costs |
692,074 |
|
Total capital costs: |
156,717,209 |
|
|
|
|
Operating Costs |
|
|
O&M cost (excluding fuel) |
193,902,965 |
|
Fuel cost |
168,398,799 |
|
Electricity (Compressor) |
9,440,099 |
|
Battery replacement cost |
n/a |
|
Other costs |
n/a |
|
Total operating costs: |
371,741,863
|
|
|
|
|
Non-discounted Total Cost |
528,459,072
|
|
|
|
|
Discounted Total Cost |
385,302,544 |
Source: sustain-ABILITYTM, 2006
This option is the most costly choice for the City of Ottawa, but should be examined in more depth as the scope of the project does not permit a more in-depth investigation of some cost elements and the in-service experience is insufficient to enable the determination of operating costs with certainty.
4.2
The
DEH Business Case
The original DEH business case was built by the NRC and Pennant Canada Limited and was presented in a study[66] conducted for the benefit of the City of Ottawa. Several assumptions have been changed to harmonise the DEH business case to that previously developed for the CNG buses. The New Flyer Allison technology was chosen as a reference case in this study as it is currently the preferred choice of the City according to City Staff. Further changes were made to the Pennant cost projections as some of the data used was of “low quality”[67] and the forecast was deemed «very soft»[68] given that Pennant qualified its confidence level with four of the eight key data elements as «low». All changes made by sustain-ABILITY™ are described and explained in the following sections.
4.2.1 Capital Costs
Bus Acquisition
In
one case[69], current
(April 2006) tender prices were obtained for a variety of bus types from the
same manufacturer, rendering the differences between bus types highly valid.
These are used for comparative purposes in this report. It should be noted that
prices include all taxes, as DEH
buses are not eligible for a PST rebate.
Subsidies have not been taken into consideration. The prices are:
Ø
Diesel 40’
LF - $385,840
Ø DEH 40’ LF - $596,748
This
is a considerable difference with the NRC Report based on an acquisition cost
of $740,000 per unit. It should be
noted that the diesel engines on board these buses are not 2007-compliant. The industry expects Cool-EGRs and
particulate traps will be the technologies favoured by engine
manufacturers. Consequently, $7,500
(plus applicable taxes) per bus was added to the $596,748
price
of DEH buses for the second and third waves of acquisition (years 2 and 3).
Facilities Upgrade
Upgrades
to the garages and their equipment hosting the DEH fleet include the following:
Ø Cranes;
Ø Scaffolding fall protection equipment;
Ø Battery storage room;
Ø High voltage safety equipment;
Ø Specialty tools.
The
estimate provided by Pennant in the NRC Report was based on a contingent of
only 68 buses housed in a single garage where existing bays were to be modified
and power systems were adequate. As it was the case for CNG buses, two
facilities will be required for the 226-bus fleet and each one will accommodate
113 DEH buses, almost twice as many as in the reference case. No engineering studies have been conducted
but a close examination of the infrastructure costs provided by Pennant reveals
that they are “volume sensitive”. The
unit cost provided by Pennant was therefore increased by 60%. Specialty tool
costs have also been included.
sustain-ABILITYTM’s
estimate of these costs is $816,326 (plus applicable taxes) per facility.
Other Soft, Non-Recurring Costs
The
training of maintenance personnel is a routine operation for transit
systems. However, the introduction of a
radically different technology requires an exceptional, one-time training of
all maintenance personnel. This
non-recurring cost was calculated on the basis of 361 maintenance employees and
16 hours per employee.
Drivers,
as well, require a training session to familiarize them with the new
technology. As it is not possible to
determine which driver will be assigned to DEH buses for the 18—year life of
the bus, all drivers were considered for a training session of eight hours at a
rate of $33/hour.
Initial
training for all drivers and maintenance personnel has been scheduled in the
first three years and no cost has been attributed for further training, as it
is generally included in routine O&M costs.
Summary of Capital Costs
The
following table summarizes the impact of the costs described in the preceding
sections. The total cost reflects the
impact of subsequent year increases and inflation, but not the net present
value.
Table 27 -
Capital Cost Summary – DEH Fleet
|
Reconstructed DEH Business Case |
Unit Cost (August 2006) |
Total (non discounted) |
|
Capital Investment (including applicable taxes) |
|
|
|
40-foot Buses |
$596,748 |
$ 139.8 M |
|
Building and Infrastructure cost |
$881,632 |
$ 1.8 M |
|
Other Soft, Non-Recurring Costs |
|
$ 1.0 M |
|
Total Capital Costs |
|
$ 142.5 M |
Note: Taxes are included in the above numbers where applicable
Source: sustain-ABILITYTM, 2006
4.2.2 Operation Costs
Fuel
Service
tests conducted by the NRC on eleven Ottawa routes allowed Pennant to develop
two scenarios (low and high speed). As
the hybrid buses would likely be called to serve in an urban district duty
cycle, the low-speed scenario[70]
was selected as reference. Fuel consumption
metered during the NRC tests yielded a fuel consumption rate of 60.3 litres per
100 km[71]
for DEH compared to 82.6 litres per 100 km[72]
for conventional diesel buses running the same duty cycle. Ottawa’s fleet average 59.5 litres per 100
km[73].
In
order to ensure comparability of results, the fuel consumptions for
conventional and DEH buses taken from the NRC Report were used for the
reconstructed (base) diesel and DEH cases.
It must be noted that CNG buses are not ideally suited for the
low-speed/frequent-stop duty cycle and are somewhat penalized in this
comparison. It should also be noted
that the common practice of cycling buses through various duty cycles as they
age would penalize DEH buses in the later stage of their life. These factors have not been taken into
consideration in sustain-ABILITYTM’s calculations as such an
exercise exceeds the scope of this study.
To
ensure comparability, the fleet average distance per bus per year (59,156 km)
was used for the CNG and diesel and DEH buses.
Diesel fuel price forecasts are based on the annual price increase forecasted by the Energy Information Administration (EIA)[74] applied to the current price paid by the City of Ottawa. Prices change every year as City contracts are usually 12 months in duration. The switch to ULSD occurred in 2006, bringing a $0.02/litre[75] increase to the price of fuel in that year.
The introduction of lower-emission engines and ULSD will have an impact on the fuel efficiency of the buses. As a result, their fuel cost will increase by as much as 5% (on buses procured in 2008 and 2009) because of reduced fuel efficiency due to after-treatment and the increased cost of ULSD. The impact of ECT on fuel economy is discussed in detail in section 6.1.
The
above factors yielded a starting fuel cost of $0.49/km based on adjustments
made to the current fuel price paid by the City of Ottawa.
Bus Maintenance
In
the NRC Report, Pennant calculated a lifecycle maintenance cost of $0.76/km[76]
for the New Flyer–Allison DEH buses.
From this number, sustain-ABILITY™ noted a few items having been
excluded. Minor adjustments were therefore made to the following items:
Ø Taxes on parts (Parts were 21.4% of the cost of O&M)[77];
Ø Supplies;
Ø Non-scheduled traction battery replacement.
The
DEH reconstructed model therefore includes an additional 8% on the cost of
maintenance parts as well as $38 per bus per year for maintenance supplies.
The
treatment of battery cost was more extensive.
Unscheduled battery replacement cost was estimated at $23 per bus per
year based on estimates provided by Pennant in the Appendix to the NRC Report[78].
The
OEM recommends (scheduled) battery replacement every four to six years. A
recent study[79] confirmed
that «nickel metal hydride batteries are estimated
to last about six years» but offered no test results to support this claim. New York City
Transit estimated the service life of batteries at five to seven years[80].
The middle range
of the OEM’s claim has been selected for inclusion in the reconstructed DEH
model (five years) as opposed to the Pennant calculations (in the NRC Report)
based on the maximum OEM statement. sustain-ABILITY™, however, opted to
maintain the cost of batteries constant during the forecasting period (no
inflation) to reflect the anticipated reduction in cost of Nickel Metal Hydride
(Ni-MH) batteries as demand increases during that period.
The
introduction of new technologies to make diesel engines 2007-compliant is
anticipated to increase maintenance costs.
Of course, no experience or data is available on this topic and, based
on experience with similar introductions in the past, sustain-ABILITYTM
has estimated that the replacement of the DPF filters could occur on a six-year
cycle at $5,000 a piece.
Summary of Operating
Costs
The
following table summarises the annual cost of operating a 226-bus DEH fleet at
the beginning of the forecast period.
Table 28 -
Annual Operating Cost Summary – DEH
Fleet
|
Reconstructed |
August 2006 |
Lifecycle |
|
|
Operating Costs (including taxes) |
$ per km |
$ per bus/yr |
Total Fleet Cost
($) |
|
O&M Cost (excluding fuel) |
0.76 |
44,958 |
182.9 M |
|
Fuel Cost |
0.49 |
28,986 |
163.4 M |
|
Scheduled Battery Replacement |
n/a |
n/a |
25.5 M |
|
Others |
n/a |
n/a |
5.1 M |
|
Total Cost |
|
|
376.8
M |
Source: sustain-ABILITYTM, 2006
4.2.3 Renewable Fuel Options
The use of biodiesel as fuel for the diesel engine constitutes the most likely renewable fuel option for the DEH buses. Ethanol-diesel, a specific form of biodiesel fuel, is also an alternative, at least technically, but the City rejected its use in 2004 because of the absence of government subsidies.
One major advantage of biodiesel relative to other low-emission fuels is that it can use the current diesel technology with no or minimal modifications. Experience with vehicle modifications is still sparse, with costs varying depending on whether the bus is new or used, the fuel system to be accommodated, and the daily operating range required. However, experience shows that when retrofits were deemed necessary, their cost ranged between $4,000 and $6,000 per vehicle. Recently, both the TTC and the Société de Transport de Montréal (STM) conducted experiments with biodiesel fuel without incurring any significant cost. Also, new “biodiesel-ready” bus price premiums are negligible and so, sustain-ABILITY™ has not modified the price of standard DEH buses for this option.
No change is mandated to the facilities or the on-ground fuelling and handling system. It is recommended, however, that dedicated new ground storage systems be used or, as a minimum, that existing ground storage be thoroughly cleaned for use with new cleaner fuel formulations. New or additional maintenance equipment to test and repair the on-board system are not required either.
The
market price of biodiesel fuel calls for a premium of $0.03 to $0.06 per litre
over conventional low-sulphur diesel fuel.
Despite claims from potential and existing suppliers that the cost of
biodiesel should be the same as that of regular diesel fuel in the near future,
a $0.045 per litre premium was used in sustain-ABILITYTM’s
calculations. The City of Ottawa currently purchases relatively small
quantities of biodiesel fuel for a $0.03 per litre premium.
Experience
has also shown that buses operating on biodiesel have identical performances
and fuel consumption as those using conventional diesel fuel. Some precautions must be taken to ensure
proper blending of conventional and biodiesel fuels, particularly in the
winter, in order to avoid added maintenance costs attributable to more frequent
fuel filter replacements. Again here,
sustain-ABILITY™ made no provisions for added O&M costs when using
biodiesel.
The annual cost of operating the 226-bus
DEH fleet with biodiesel is presented in the following table.
Table 29 -
Operating Cost Summary – Bio-DEH Fleet
|
Reconstructed |
August 2006 |
Lifecycle |
|
|
Operating Costs (taxes included) |
$ per km |
$ per bus/yr |
Total Fleet Cost
($) |
|
O&M Cost (excluding fuel) |
0.76 |
44,958 |
182.9 M |
|
Fuel Cost (not taxable) |
0.536 |
37,717 |
183.3 M |
|
Battery Replacement Cost (excluding taxes) |
N/A |
N/A |
26.9 M |
|
Others |
N/A |
N/A |
6.0 M |
|
Total Cost (non discounted) |
|
|
399.1
M |
Source: sustain-ABILITYTM, 2006
No
changes were made to the capital cost forecast developed for DEH buses for
using biodiesel.
5 Review of the Environmental Case
5.1 Emissions of CNG buses
5.1.1 Compliance with Standards
In late 2000, the EPA adopted very aggressive new emissions standards for model year 2007 and later heavy-duty highway engines, as follows:
Ø PM - 0.01 g/bhp-hr
Ø NOx- 0.20 g/bhp-hr
Ø NMHC - 0.14 g/bhp-hr
The PM emission standard will take full effect in the 2007 heavy-duty engine model year. The NOx and NMHC standards will be phased in for diesel engines between 2007 and 2010. As noted above, the phase-in will be on a percent-of-sales basis: 50% from 2007 to 2009 and 100% in 2010.[81]
With Detroit Diesel pulling out of the CNG engine market, the two main North American suppliers of heavy-duty CNG engines for transit buses are Cummins-Westport and John Deere. Volvo also has a heavy-duty CNG engine technology that is widely used in Europe and is being tested in the United States with Mack.
As described in Diagram 4, Cummins Westport Inc. has indicated that it will be certifying its new 2007 ISL G engine to 2010 emissions of NOx at 0.2 g/bhph. The new ISL G engine will be a stoichiometric engine with cooled EGR using a 3-way catalyst vs. the current lean burn platform using an oxidation catalyst.
John Deere 8.1l heavy-duty bus engines were certified to minimum 2007 regulations of 1.2g NOx+NMHC in 2005.[82] Deere also plans to go to stoichiometric with three-way catalyst to meet 2007 regulations.
While the new 2007 engines have not yet been certified (expected Q1 2007), the representations made by CWI and Deere are supported by SwRI which has been involved in the development and testing of 2007 engine platforms for a number of manufacturers (please see Diagram 6), and Bradley (see Note).
5.1.2 Performance
The EPA UDDS cycle has been developed for chassis dynamometer testing of heavy-duty vehicles (CFR 40, 86, App.I). The FTP heavy-duty transient cycle is currently used for emissions testing of heavy-duty on-road engines in the USA [CFR Title 40, Part 86.127]. The transient test was developed to take into account the variety of heavy-duty trucks and buses in American cities, including traffic in and around the cities on roads and expressways. The FTP transient test is based on the UDDS chassis dynamometer driving cycle. The FTP cycle consists of four phases: the first is a New York Non Freeway (NYNF) phase typical of light urban traffic with frequent stops and starts, the second is LANF (Los Angeles Non Freeway) phase typical of crowded urban traffic with few stops, the third is a LAFY (Los Angeles Freeway) phase simulating crowded expressway traffic in Los Angeles, and the fourth phase repeats the first NYNF phase. It comprises a cold start after parking overnight, followed by idling, acceleration and deceleration phases, and a wide variety of different speeds and loads sequenced to simulate the running of the vehicle that corresponds to the engine being tested. [83]
The fuel economy and emissions performance
of buses for 2007 has been investigated through the use of materials supplied
by the Consortium and publicly available information from conference
papers/presentations and press releases as well as discussions with engine
manufacturers. The process included a
thorough review of projected characteristics of CNG engines but not buses. There may be vehicle changes in systems that
could have a significant impact on both fuel economy and emissions. Sections 6 and 7 describe technology changes
that might affect in-use performance of CNG buses including: high-pressure
direct injection which could improve combustion and therefore reduce unburned
methane in the exhaust, and hybridisation which would reduce the amount of
part-load on the engines (the weakest performance for gas engines is at part
throttle) and would be expected to produce comparable performance enhancements
as the DEH to Diesel.
Fuel Consumption
Fuel consumption is vehicle and route specific but standard tests are used to compare various vehicle and engine combinations. For CNG buses, fuel consumption is closely related to fuel-air blending strategy and operating modes from very lean (excess air) to rich (excess fuel) have been used by different manufacturers.
Manufacturers of CNG engines and vehicles are not supplying precise estimates of fuel consumption for 2007 or 2010-compliant engines. However, the general indications from manufacturers and engine development and testing labs are that the engine fuel consumption will be at least equivalent to previous generations of engines. In the NREL-WMATA analysis discussed above, the energy equivalent (Diesel Gallon Equivalent (“DGE”) fuel economy of the Deere CNG buses was 16% lower compared with the diesel buses. This fuel economy difference is better than previous DOE/NREL studies of CNG and LNG transit buses, which showed natural gas bus fuel economy to be 20–30% lower than diesel bus fuel economy.
Emissions of CO2
are a function of the carbon content of the fuel, as well as fuel consumption.
The volume of fuel consumed determines the amount of energy that is generated.
The volume of fuel consumed also determines the amount of carbon dioxide
released. To be equivalent in carbon emissions, 19.95/14.47 = 1.38 times more
natural gas must be consumed than diesel.[84]
That means that
38% more natural gas can be consumed to travel the same distance, without
emitting higher levels of CO2.
A CNG engine should, therefore, generate lower CO2 emissions compared to
diesel to the extent by which its fuel economy penalty is lower than 38% on a
DGE basis.
In its analysis of the comparative cost of diesel and CNG technologies, TIAX concluded that CNG fuel economy was relatively insignificant in the overall economics[85]. It stated that the possible range of fuel economy for the CNG engines (as discovered during the research) is small enough that other factors, such as CNG fuel price and duty cycle, have a comparatively greater impact. Diagram 14 shows the scale of economic impact of the major characteristics considered in the study. It is clear that the variation of CNG fuel economy is largely immaterial in the big picture compared to, for example, the cost of crude oil.
Diagram
14 -
Sensitivity of Lifecycle Cost

Source: TIAX, LLC
The report goes on to conclude that the transit bus application is particularly insensitive to fuel economy
changes because of the base assumption that the NG engine has 95% of the fuel
economy of an equivalent diesel engine. This fuel economy penalty is cancelled
out in their analysis by the assumption that CNG is between 80% and 90% of the
cost of diesel.
The tests at WMATA showed that CNG fuel economy
has improved significantly over the last few years. The energy equivalent fuel economy of the CWI CNG buses
was 18% lower, and the energy equivalent fuel economy of the Deere CNG buses
was 16% lower compared to diesel buses. This fuel economy difference is better
than previous DOE/NREL studies of CNG and LNG transit buses, which showed
natural gas bus fuel economy to be 20%–30% lower than
diesel bus fuel
economy. This is consistent with the assumptions used in TIAX.
The switch by CWI to stoichiometric engine
technology suggests that fuel consumption could rise again (lean burn means
lower fuel to air mixture ratio than stoichiometric) but the realised benefits[86]
may, in fact, contradict this simple assumption. CWI claims for 2007 are …
Ø Lowest emissions with use of simple
passive TWC;
Ø
Higher
efficiency with combustion enhancements;
Ø 8.9 litre stoichiometric EGR engine
with ratings 250-320 hp;
Ø
34%
improved clutch engagement torque;
Ø
Improved
fuel economy;
Ø
Reliability/Durability;
Ø
Many
common Cummins diesel parts.
Emissions
Engines sold for use in transit vehicles must be certified to be compliant with regulations. The likelihood that CNG engines will meet the 2007 requirements for regulated emissions is discussed in Sections 2.4.3 and 5.1.1.
The non-regulated emissions include CO2 and methane and are relevant for Ottawa.
CO2 emissions are largely a function of vehicle efficiency – the more fuel consumed, the more CO2 emitted. In this respect, greater fuel economy will reduce CO2 emissions. CNG engines for 2007 should have similar or reduced CO2 emissions due to equivalent or slightly better fuel economy.
Levelton demonstrates a relative comparison
of CO2 emissions but with an important qualifier that suggests the
difference could be much greater in favour of the CNG vehicle:
Ø
The
natural gas engine did not have a catalyst so there is not an “apples to
apples” comparison to the diesel tests;
Ø
The
fuel economy differences were not reported but the carbon dioxide emissions for
the natural gas engine were from 2.0% to 18.7% lower than the diesel with a
catalyst and 3.8% to 21% lower than the engine equipped with a CRT
(Continuously Regenerated Trap).[87]
It should be noted that THC emissions include both
non-methane hydrocarbons (NMHC) and methane. Only NMHC is considered in
certification testing for heavy-duty engines, including diesel and natural gas
engines. Commercial natural gas is approximately 95% methane. Based on previous
test results, it is likely that the majority of THC emissions from natural gas
buses is unburned methane. These methane emissions are of little concern from a
local air quality perspective as methane is not reactive in the atmosphere and
does not contribute to the formation of ground-level ozone.
5.1.3 Greenhouse Gases
The Ottawa FERS (discussed in greater detail in section 5.5) discusses
the importance of CO2 emissions reductions in the overall context of
reducing GHGs by 20% for the City of Ottawa.
Greenhouse gas emissions from CNG buses include CO2 and
Methane. C02
comprises 79% of Canadian GHG emissions and the trend is increasing. Methane
comprises 12.7% but stable as a percentage of all GHG emissions.
Diagram 15 -
Canada’s Greenhouse Gas Emissions
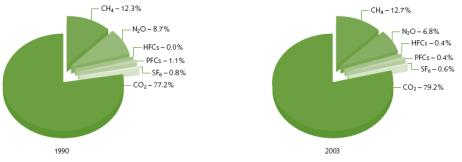
Source: Environment Canada[88]
While CO2 is the primary target
for GHG reductions in Canada and globally (and targeted by FERS), methane is
not insignificant. Methane (CH4) is a greenhouse gas that remains in
the atmosphere for approximately 9-15 years. It is over 20 times more effective
in trapping heat in the atmosphere than carbon dioxide over a 100-year period
and is emitted from a variety of natural and human-influenced sources.
Human-influenced sources include landfills, natural gas and petroleum systems,
agricultural activities, coal mining, stationary and mobile combustion,
wastewater treatment, and certain industrial processes. However, mobile sources accounted for less than ½ of
1% of methane emissions.[89]
As
discussed above, the major factors impacting GHG emissions are carbon content
of the fuel and efficiency/fuel economy, only the latter being variable in a
direct comparison of diesel to CNG technologies. Consequently, variables that
impact engine efficiency and vehicle fuel economy will directly impact GHG
emissions. A number of such variables
are identified in the relevant sections of this report including: emission
control technologies, fuel composition, vehicle weight and vehicle duty cycle.
5.2 Renewable Fuel Options
While biogas and HCNG are both viable renewable fuel options for the CNG platform, the stakeholders in this report agreed to review the HCNG option in greater depth. HCNG is the addition of more than 20% hydrogen blended with CNG. Work done by Collier Technologies suggests that the ‘knee’ in the emission reduction curve for NOx is at roughly 30% blend of hydrogen in natural gas, by volume. The energy content of hydrogen at 30% in an HCNG fuel is about 12%. This is relevant because GHG emission reductions will be a function of the displacement of CNG by energy content. Utilizing more hydrogen can further reduce GHG emissions proportionately.
There are two main proponents of modern HCNG engine technologies for transit buses in North America: Citi Engines/Collier Technologies and Cummins Westport Inc. Each has reported test results with credible third parties over the past two years. These studies used pre-commercial prototypes and did not involve testing to certification cycles, or multi-unit comparative testing, so the results should be considered indicative rather than absolute.
With funding from the U.S. Department of Energy through NREL and SCAQMD, SunLine Transit Agency initiated a project to demonstrate two buses operating on a mixture of natural gas and hydrogen (HCNG or Hythane®). SunLine asked Cummins Westport Inc. (CWI) to upgrade the CWI B Gas Plus engine rated at 230 horsepower. The following diagram shows the pre-catalyst emissions results normalized compared to the original natural gas operation. It shows that NOx and NMHC emissions are reduced by 50%, while CO and CH4 emissions are slightly reduced. As expected, CO2 emissions are reduced by 7%, consistent with the hydrogen energy content, and with the maintained fuel consumption.
Source: Cummins Westport[90]
UC Davis conducted another recent study.[91] Its Hydrogen Bus Technology Validation Program, ICAT project, was to demonstrate whether hydrogen enriched natural gas (HCNG) engines could meet the strict new CARB standard of 0.2 g/bhp NOx. For this evaluation, Collier Technologies, Inc. modified a John Deere 8.1 litre engine to operate on HCNG fuel. When the engine control was set to minimize emissions, the NOx emissions were below 0.2 g/bhph (the 2007 standard) for all measured torque-speed points.
A number of bus driving cycles were used to estimate bus performance. NOx emissions were significantly less for the HCNG bus compared to CNG buses. For the CBD14 drive cycle, HCNG bus NOx emissions were 6.6 grams/mile compared to 70.1 grams/mile for CNG buses. The fuel economy was 3.2 miles/gallon of diesel equivalent (2.7 miles/gallon of gasoline equivalent) for HCNG buses compared to 2.7 miles/gallon of diesel equivalent (2.3 miles/gallon of gasoline equivalent) for CNG buses.
Table 30 -
Emissions Reduction in HCNG Bus
|
|
HC |
CO (g/mi) |
NOx |
MPGDE (g/mi) |
|
CBD14 |
|
|
|
|
|
CNG bus |
21.08 |
1.15 |
70.15 |
2.70 |
|
HCNG bus |
23.34 |
7.36 |
6.58 |
3.18 |
|
Change |
2.225 |
6.21 |
-63.57 |
0.4 |
Source: UC Davis
Volvo CNG buses have also run on Hythane and HCNG in Sweden. Laboratory and on road tests performed by Lund University engineers on blends of 8% and 25% hydrogen by volume yielded both efficiency gains and reductions in CO2 emissions of 10-15% and 28% respectively compared to CNG. The testing also reported significant reductions in HC emissions and a much better HC/NOx trade–off than pure CNG.[92]
5.3 Emissions of DEH Buses
5.3.1 Compliance with Standards
As noted above, diesel engine manufacturers are planning to take a two-stage approach to meet 2010 emissions regulations. This approach requires some interpretation of the EPA regulations but will permit diesel manufacturers more time to adopt and perfect strategies to meet the 0.2 g/bhp NOx standard. By 2010, the incremental cost is estimated to be US$15,000 to US$25,000[93], attributable in part to the cost of selective catalytic reduction units (and outstanding issues relating to the availability of make-up urea and anti-avoidance requirements).
5.3.2 Performance
As noted above, engine manufacturers will not provide fuel economy numbers as they are very much dependent on the chassis. For diesel engines, in lieu of precise estimates from manufacturers, the fuel consumption for 2007 can be based on 2005 products adjusted for the additional Emission Control Technologies (“ECT”) required to comply with regulations. In Section 6, there is a discussion of the potential impact of ECT on diesel engines. Literature and operator experience suggest that fuel consumption may increase by up to 14% once all ECT for US2010 compliance are implemented. While different manufacturers will experience different performances, it is expected that the fuel economy penalty due to active particulate traps will be 2.5–5%, 1-5% from the use of cooled EGR and 3-5% from SCR systems. [94] The lower energy content in ULSD fuel, required to enable new ECT, will also reduce fuel economy by a proportional amount, all other things being equal. While the refining industry lobbied against the mandatory introduction of ULSD on the basis that it could reduce fuel economy by up to 5%, more recent reports from the industry suggest a reduction in fuel economy of 1–2% is more likely due to the use of fuel additives. That said, this is within the range of variability of standard diesel fuel (up to 3%) so the impact may not be noticeable in all cases.
For DEH, there could be other factors that affect fuel economy over time. Improvements in drivetrain components such as batteries, battery management and power delivery algorithms could dramatically affect fuel economy. The improvements compared to emissions controlled diesel for in-service DEH buses is very much drive-cycle dependent and results reported from one transit operation may not be directly applicable to another.
5.4 Renewable Fuel Options (Biodiesel
in DEH Buses)
5.4.1
Biodiesel
Diesel fuel
derived from the oil of plants and animals is collectively referred to as
“biodiesel” as opposed to conventional diesel fuel that is refined from crude
oil.
The potential benefits of biodiesel are summarized following[95]:
Ø
Biodiesel
can be used in any diesel engine with few or no modifications;
Ø
Biodiesel
can produce large reductions in particulate matter (10% with B20) with
significant reductions in carbon monoxide (11% with B20) and hydrocarbons (21%
with B20);
Ø
NOx
can increase slightly (2% with B20) with the use of biodiesel (not all
environmental impacts are positive and a balanced view is required);
Ø
Higher
lubricity may offset poor lubricating qualities of ULSD;
Ø
From
an operational standpoint (at STM in Montreal), using biodiesel did not result
in any incident compromising continuity of service;
Ø
No
variation in fuel consumption can be substantiated from the data as a whole;
Ø
Mechanical
maintenance was unproblematic during and after the cutover to biodiesel for
most buses;
The following
table describes potential improvements in emissions using B20[96]:
Table 31 -
Potential Emissions
Reduction from Use of B20 Biodiesel Fuel
|
|
Percent
Change in Emissions |
|
NOx |
+2.0 |
|
PM |
-10.1 |
|
HC |
-21.1 |
|
CO |
-11.0 |
Source: Levelton, 2005
Greenhouse gas emission reductions when using biodiesel are dependent on a number of factors in the full lifecycle of the fuel and vehicle. The Ottawa power mix and logistics of distributing fuel will impact life cycle emissions and may be different than those used for BC in the report, but the preceding table is indicative of the potential benefits.
Table 32 -
GHG Reductions from Different Sources of
Biodiesel
|
|
Canola
Biodiesel |
Soy Biodiesel |
Animal Fat
Biodiesel |
|
|
% Reduction GHG vs. petroleum diesel |
% Reduction GHG vs. petroleum diesel |
% Reduction GHG vs. petroleum diesel |
|
B2 |
-1.2 |
-1.2 |
-1.8 |
|
B20 |
-11.9 |
-11.9 |
-18.1 |
|
B100 |
-63.0 |
-63.2 |
-93.5 |
Source: Levelton, 2005[97]
As shown in the preceding table, biodiesel produced from animal fats produces the largest reduction in GHG emissions due to the lack of emissions associated with production of the feedstock. However, there are currently only a few sources of “animal fat biodiesel” in Ontario and the distance from the source to the point of end-use must be changed in the GHG model when analysing the environmental impact. A full analysis of the sources of biodiesel is beyond the scope of this evaluation.
It is clear from the report that the benefit of using biodiesel over crude-based diesel is significant even at low displacement rates (20%). These environmental benefits would be in addition to any reduced fuel consumption as a result of a hybridisation of diesel powertrains. As the fuel consumption goes down, the relative benefit of biodiesel decreases but the absolute gain is greater because total emissions are lower. It is important to note that most of the testing done on biodiesel in the United States may not be directly applicable to Ottawa as the temperatures seen in regular service are not reflective of the conditions in central Canada.
The Canadian
Petroleum Products Institute notes that ULSD and biodiesel may be an issue for
cold climates:
“ULSD and biodiesel fuel have different properties. In particular,
as the ambient air temperature drops, biodiesel creates waxes sooner than
petroleum-based diesel. Therefore, special care needs to be taken when blending
the two fuels together, especially in cold weather because, without proper
blending, the bio-based component may separate in the fuel tank and could
potentially plug filters and hence cause engine problems.”[98]
5.4.2
Ultra
Low Sulphur Diesel
The EPA has mandated ULSD in an effort to reduce emissions from all diesel vehicles regardless of vintage and technology.
“In December 2000 the U.S. Environmental Protection Agency (EPA) issued
a final rulemaking on Heavy-Duty Engine and Vehicle Standards and Highway
Diesel Fuel Sulphur Control Requirements. The purpose of the rulemaking is to
reduce emissions of nitrogen oxides and particulate matter from heavy-duty
highway engines and vehicles that use diesel fuel. The rulemaking requires new
emissions standards for heavy-duty highway vehicles that will take effect in
model year 2007. “The pollution emitted by diesel engines contributes greatly
to our nation’s continuing air quality problems,” the EPA noted in its
regulatory announcement. “Even with more stringent heavy-duty highway engine
standards … these engines will continue to emit large amounts of oxides of
nitrogen (NOx) and particulate matter (PM), both of which contribute to serious
public health problems in the United States.”[99]
The primary driver for requiring the use of ULSD fuel is to facilitate the use of new emissions control technologies that can be damaged by high levels of sulphur in fuel. In theory, ULSD on its own can also reduce emissions:
”Using ULSD fuel without particulate filters or oxidation catalysts
could provide up to a 13 percent reduction in particulate matter (PM), a 13
percent reduction in hydrocarbons (HC), a 6 percent reduction in carbon
monoxide (CO), and a 3 percent reduction in nitrogen oxide (NOx).”[100]
However, depending on the region, the fleet, the fuel delivery method and a number of other factors, ULSD may not provide a significant positive impact in existing vehicles. Levelton[101] concludes that for the specific location, fleet and fuel delivery methods, ULSD provides no positive environmental impact whatsoever (except sulphur, of course). And, as shown in the table below[102], the use of ULSD and related emissions control technologies may result in slightly higher GHG emissions as the fuel consumption may increase.
Table 33 -
Emissions Impact of ULSD
|
Parameter |
Impact |
|
Operating Cost |
+0.019/Km |
|
Particulate Matter |
-2.4% |
|
Sulphur emissions |
-95% |
|
NOx emissions |
No change |
|
HC emissions |
No change |
|
Air Toxics |
No change |
|
GHG emissions |
+2.6% |
Source: Levelton, 2005
“Ultra low sulphur diesel
fuel will have slightly higher greenhouse gas emissions than the current
product. GHGenius projects this to be 2.6% higher for the full lifecycle. This
assumes no difference in the emissions from the vehicle. Some of the
technologies that are enabled by ULSD also result in lower engine efficiency so
the GHG emissions from diesel vehicles in 2007 is expected to be significantly
higher than the current emissions.”[103]
There are few direct comparisons available for similar vehicles, on the same route and in the same conditions using traditional diesel, LSD and ULSD. City Staff claim that the City has experienced no difference in the fuel economy of its buses using ULSD fuel.
In establishing its position on ULSD, the Canadian Petroleum Products Institute states:
“Generally, the processes that remove sulphur
also reduce aromatics and the density of fuel which may lower energy content
per litre by about 1% ... under typical operating conditions there should be no
noticeable impact on the overall power of the vehicle. The reduction in energy
[of ULSD] content could result in a similar reduction in overall fuel economy. Engine and vehicle manufacturers expect ULSD to be fully compatible with
the existing fleet and are not anticipating that current owners will have to
make any changes to their equipment to operate with the new fuel.“[104]
Some
manufacturers have expressed concerns about the use of ULSD. A recent
presentation by Deere expressed doubt as to the positive impacts of ULSD
suggesting the likely impact would be … [105]
Ø Increased Capital & Maintenance Costs;
Ø Increased Fuel Consumption;
Ø Reduced Reliability;
Ø Additional Training;
Ø 15 ppm does not clean up PM;
Ø A Technology Enabler.
The collective wisdom of the diesel community has identified a number of issues related to ULSD that should be considered during the transition:
Fuel
Economy. The
processing required to reduce sulphur levels in diesel fuels to less than
15 mg/kg can also reduce the aromatics in the fuel. On a volumetric basis,
the energy density of aromatics is significantly higher than other components
of diesel fuel. Reducing the concentration of aromatics in a fuel will result
in less energy per unit volume.
Seal
Compatibility.
While newer engine designs would take seal compatibility into consideration,
there are at least two possible reasons why seal compatibility may be a concern
with ULSD fuels for some older engines:
·
Desulphurization
can also remove naturally occurring antioxidants from middle distillate fuels.
The antioxidants can prevent the build-up of peroxides in the fuel. If these
antioxidants are not replaced, peroxides could build up in the fuel if it is
stored for long periods of time. Peroxides can cause the embrittlement of
neoprene and nitrile elastomers and possibly lead to seal failure.
·
Aromatic
fuel components can cause some elastomer materials to swell. Fuel systems that
have been designed to accommodate seal swelling may not create a tight seal
between metal parts and prevent fuel leakage with fuel low in aromatics.
Elastomers may even shrink and crack in some cases.
Deposits. Fuel chemistry changes can affect
the way fuel interacts with existing deposits in storage and vehicle fuel
tanks. Depending on the solvency of ULSD, some deposits may be removed from the
tank resulting in the need to change fuel filters ahead of their regularly
scheduled intervals.
According
to Lubrizol, loss of antioxidants and the subsequent increase in peroxides can
eventually lead to the formation of insoluble polymers in the fuel. These
polymers could potentially build up on sensitive fuel system components, such
as injectors, and affect their performance.
Static
Dissipation. Fuel
processing to remove sulphur also removes polar compounds that give diesel fuel
electrical conductivity and prevent the build up of static electrical charge.
Discharge of static electricity can occur during bulk fuel handling if fuel
conductivity is not sufficient. This can cause serious damage if a flammable
mixture is also present. This type of accident is most likely to occur in tanks
being switch-loaded from gasoline to diesel fuel. The previous gasoline load
leaves a combustible mixture of fuel vapour and air in the tank. If a load of
diesel with poor conductivity is then loaded and a static discharge occurs, an
explosion can result. ULSD will likely require the use of static dissipater
additives.
Low temperatures can reduce the conductivity of diesel fuels that may have sufficient naturally occurring conductivity at higher temperatures (this is one reason the Canadian diesel fuel standard has a minimum conductivity specification).[106]
In summary,
the adoption of ULSD will bring benefits and drawbacks from an environmental
perspective. New ECT will be enabled, but fuel economy may be reduced slightly
and ULSD may negatively affect fuel systems of older vehicles and result in
higher maintenance costs.
5.5 Fleet Emissions Reduction
Strategy
Since 1991, the City of Ottawa has been committed to reducing greenhouse gas emissions. In 2002, the corporate emissions inventory, previous monitoring efforts and commitments to action were consolidated for the amalgamated City of Ottawa and a Fleet Emissions Reduction Strategy (FERS) was adopted. FERS was based on a study commissioned by the Fleet Services Branch to review current technologies and to make recommendations regarding a cost effective emissions reduction strategy for the City fleet. Approximately 95% of the automotive fuel consumed by the City is diesel. Over 80% of City fuel is used in transit buses, hence the study focus on transit applications. The ultimate goal of the strategy, within a 20-year horizon, is a zero-emission bus fleet.[107]
The report outlines a short, medium and long-term strategy for reducing emissions from the City’s fleet. Implementation of the recommended initiatives was expected to contribute to reduced air and greenhouse gas emissions for the City of Ottawa. In particular, these measures were expected to contribute to the City’s commitments as a member of the Partners for Climate Change program to reduce corporate greenhouse gas emissions by 20%.
It was recommended at the time that Council
approve a long-term (11- 20 years) strategy to convert the urban transit bus
fleet to near-zero emission fuel-cell technology and a mid-term (5-10 years)
strategy to convert the urban transit bus fleet to hybrid diesel-electric
technology, and conduct preparatory work to implement the long-term strategy.
The short-term recommendations were not relevant to this evaluation.
FERS Update
FERS was reviewed and updated in 2004. Both air quality and climate change are addressed and regulated emissions (Nitrogen Oxides (NOx), Sulphur Oxides [SOx], Particulate Matter [PM], Volatile Organic Compounds [VOCs] including Hydrocarbons [HC] Carbon Monoxide [CO] as well as CO2) were targeted for further reduction. With respect to greenhouse gases, it states that CO2 is targeted as it represents 95% of GHGs produced by the transportation sector.
The centrepiece of the report was a recommendation to proceed with a four-phase plan to implement procurement of diesel electric hybrid buses beginning in 2007. The report also confirmed the 2002 recommendation not to acquire CNG buses.
This four-phase plan included:
- Hybrid Technology and Feasibility Study completion (the NRC Report referenced herein);
- Hybrid bus acquisition;
- Preparations for introduction (infrastructure modifications, equipment upgrades, training etc.);
- Performance analysis.
Procurements in New York City and Seattle were cited in support of the recommendation. Potential emissions reductions of 38% for CO2, 49% for NOx, 60% for PM, 38% for CO and fuel consumption reductions of 59% were also cited based on testing performed by Environment Canada. The emissions testing results from Environment Canada are referenced in Section 3.4.3 and Table 10.
Factors in the decision to rule out CNG included:
- Infrastructure costs;
- On-board storage limitations;
- Special training and licensing requirements for mechanics;
- Storage and maintenance safety requirements to accommodate lighter than air fuel.
The City Staff report also cited:
- Clean diesel technology diminishing the emissions advantage of CNG buses;
- The higher capital costs of CNG buses;
- Rising costs of natural gas; and
- CNG offering no strategic advantage over hybrid diesel electric in the transition to fuel cells.
Many of these factors were not noted or emphasized in the current City Staff position.
The NAVC report discussed in Section 3.4.2 above was referenced as demonstrating the proposition that emissions reductions from hybrid electric diesel buses are comparable to CNG and sometimes better in the context of severe duty cycles like Manhattan. The TTC's decision to pursue hybrid diesel vs. CNG was also cited.
6 Other Issues Related to Alternate-Fuel Buses in Ottawa
6.1 Impact of New Technologies on CNG and DEH Buses
The EPA US2010 emissions regulations being phased in from January 1st, 2007 will bring
significant change to the engines and vehicles used in transit operations. The combination of new fuel and new
technologies creates uncertainty for the operator. Because there are a number of unknowns about the future of
drivetrain systems, this section is designed to raise awareness about several
of the options available to engine and vehicle configurations that might have
an impact on Ottawa.
6.1.1 Emissions
Control Technologies
Before discussing specific
impacts of new ECT, an introduction to the basics of combustion and emissions
may be helpful to provide some context.
The table below presents an overview of the main technologies and
impacts.
Table
34 -
Emissions Control Technologies
|
Parameter |
Impact |
|
Operating Cost |
+0.019/Km |
|
Particulate Matter |
-2.4% |
|
Sulphur emissions |
-95% |
|
NOx emissions |
No change |
|
HC emissions |
No change |
|
Air Toxics |
No change |
|
GHG emissions |
+2.6% |
Source: Levelton 2005
The material contained in
this section is organised as follows:
Ø
Combustion introduction (with additional future
combustion enhancements in 2007);
Ø
After-treatment for particulate matter (plus
hydrocarbons and CO);
Ø After-treatment
for NOx reduction.
All three of the ECT
methods listed can be applied to diesel-fuelled and CNG-fuelled engine systems
but each of the following sub-sections describes the most relevant near-term
use and highlights performance-related issues.
Combustion
Emissions from combustion
processes can be reduced and controlled but not eliminated. The best technique to reduce emissions is to
reduce fuel consumption. However, a
certain amount of fuel is required to move the vehicle.
The diesel combustion
process results mainly in the formation of carbon dioxide and water. Carbon
monoxides, hydrocarbons and particulate matter are products of incomplete
combustion. In the combustion chamber, under influence of high temperature and
pressure, nitrogen in the charge air is oxidized to nitrogen monoxide and
nitrogen dioxide (NO2). In the exhaust system, part of the NO is further
oxidized to NO2, which is the main contributor to the formation of
smog and acid rain. The process of NO to NO2 oxidation
continues in the atmosphere under the influence of atmospheric conditions.[108]
Most of the engine-out emissions improvements over the period up to 2000 were achieved by emission-conscious engine design, such as through changes in combustion chamber design, improved fuel systems, implementation of low-temperature charge air cooling, and special attention to lube oil consumption. Since new regulations for clean air have come into effect, exhaust gas after-treatment has become the predominant technique for emissions control. There is, however, ongoing research into combustion control techniques and there is discussion of Homogeneous Charge Compression Ignition (HCCI) which is a relatively new combustion technology that should provide significant emissions reductions in the 2020 time-frame.[109] It is a hybrid of the traditional spark ignition (SI) and the compression ignition process (such as a diesel engine) that promises to reduce incomplete combustion thereby reducing the burden on after-treatment devices. Much work still needed to determine production feasibility of HCCI as a 2010 emissions strategy.[110]
Technologies Used to Reduce
Particulate Matter
There are two main after-treatment devices being
used to reduce PM, HC and CO from engine exhaust: oxidation catalysts and
particulate filters.
Oxidation Catalysts
An oxidation catalyst converts CO and HC to CO2 and H2O. It also reduces PM by oxidizing heavy
hydrocarbons adsorbed on carbon particles, at low temperatures. Unfortunately,
oxidation catalysts do not affect black carbon particles, the core components
of particulate matter.
There are many varieties of Oxidation Catalysts
depending on the fuel, the capacity and the application. A Diesel Oxidation
Catalyst (DOC) is different from the one used for CNG engines but both are
used. Almost every CNG bus over the
last 15 years has had a version of the oxidation catalyst technology to control
hydrocarbon emissions but the trend is toward an integrated three-way-catalyst
(TWC) operating on the same passive principle.
At typical engine exhaust temperatures, a catalyst
would normally reduce CO and HC in the order of 80%, and particulate matter by
approximately 25%. These devices have been used for over 20
years and have provided major reductions in diesel emissions. But the original simple DOC devices tended
to create sulphates. Consequently, new
advanced catalysts were developed in the early 90s to favour the chemical
oxidation of CO and HC over that of the SOF (soluble organic fraction - from
the sulphur in #1 and #2 fuels) portion of diesel particulates.
With ULSD, DOCs have regained their popularity and will continue to be an important part of the particulate matter reduction strategy for diesel engine manufacturers. They also offer significant PM reduction in older engines when used with ULSD.[111]
However, designers of DOCs must continue to focus on the long-term performance of the devices as they can gradually deteriorate due to poisons introduced primarily from lubricants.[112] In addition, the temperature over which the DOCs operate must be controlled as they are ineffective at low (part-load engine operation) and elevated temperatures (depending on the sulphur content of the fuel).
Particulate Filters
To decrease particulate matter emissions, the carbon
particles in the exhaust stream must be removed. This can be achieved by the
use of particulate filters, where a filter media captures the particles. The
filter media collects particulate matter then the collected material is
oxidized in a reaction with oxygen. The higher the temperature, the higher the
amount of carbon burnt. This process of oxidizing collected PM is called filter
regeneration.
Modern filters are capable of reducing emissions of
PM by approximately 90 - 95%.
In a passive filter system, the particulate matter is being burned off continuously without any additional energy. In an active system, additional energy is used to commence the regeneration process. It can be achieved through injection of fuel in the exhaust, which increases exhaust temperature or through the use of catalytically active fuel additives, which promote low-temperature catalytic oxidation. The following diagram presents an overview of the regeneration techniques. In Section 7, there is additional information about advanced research into regeneration techniques including hydrogen from onboard reforming of the primary fuel and hydrogen stored onboard or mixed into the fuel.
Diagram 17 -
Particulate Filters
Source:
Technical Guides 2006, http://www.dieselnet.com/
In general, DPFs have performed well on diesel engine systems delivered by OEMs over the last 15 years. But with highly variable fuel composition and climates, several users of vehicles fitted with DPFs have had issues related to plugging. Detroit Diesel Corporation (DDC) has recalled hundreds of engines with turbocharger and diesel particulate filter problems.
The diesel particulate filters fail to regenerate
and plug with particulate matter, thus requiring frequent cleaning to remove
the accumulated soot.[113]
Most of the progress over the last few years leading
up to configurations for compliance with 2007/10 regulations has focused on
controls for determining regeneration rates and timing. Most diesel engine systems sold for this
compliance period will use ULSD and will therefore have better performing DPFs
with active regeneration.
Technologies Used to
Reduce NOx
EGR - Exhaust Gas Recirculation
Exhaust Gas Recirculation (EGR) technology has great
potential for reducing emissions of NOx
from diesel and CNG engines. The
following diagram illustrates the basic principle of EGR but there are many
variations on the basic idea including: High-Pressure EGR (exhaust manifold and
inlet manifold (downstream of an intercooler) and Low-Pressure EGR (exhaust
system tail pipe [downstream of a PM filter] and turbocharger inlet (downstream
from an air filter).
Diagram 18 -
Exhaust Gas Recirculation

Source: Technical Guides 2006, http://www.dieselnet.com/
When part of the exhaust gases are re-circulated to
the intake air, the oxygen content is decreased and the heat capacity is
increased resulting in lower peak combustion temperature and lower NOx formation. Cooling the re-circulating gas reduces the peak combustion
temperature and alters the combustion characteristics, improving the emissions
profile.
SCR - Selective Catalytic Reduction
Selective Catalytic Reduction (SCR) of NOx means reducing it to nitrogen (N2) and oxygen (O2) over a specially formulated catalyst in
the reaction with a reductant. The most
commonly used reducing agent is ammonia (NH3) in the form of urea and has been used
in Europe and other regions for years with great success in reducing NOx from diesel engines. Although high
levels of NOx
reductions can be achieved, this technology presents several practical
challenges. Urea for SCR has infrastructure and ongoing operational issues that
pose a significant barrier to widespread adoption in North America. There is currently no
infrastructure in place for the distribution of urea. Several engine manufacturers are working on infrastructure
development plans for liquid urea as part of the plan for on-road continued
compliance with emissions regulations. The urea infrastructure for a transit
operation is much simpler and more manageable than for over-the-road trucks.
The technical challenges include complicated urea handling and dosing
system, requirement for high temperature exhaust for a catalyst to be
efficient, control of ammonia slip during transient conditions and large volume
of catalyst required.[114]
Technically, there are additional hurdles in the
transition from the well-established stationary engine use of urea to mobile
sources (especially for transit applications) and they include:
·
catalyst selection for transient
duty cycles with great variation of mass flow, exhaust temperature, and NOx
concentration;
·
control strategy for transient
operation to control the ammonia slip and other secondary emissions (including
N2O, NH4NO3).[115]
Other issues remain to be addressed, including
freezing of the urea solution in extreme weather conditions as well as operator
compliance.
NOx Adsorbers
Certain compounds can adsorb NOx in the exhaust gases and these materials
(catalysts mounted on structures) are mounted in a device called a NOx adsorber (or lean NOx trap). These devices have limited
storage capacity, however, and have to be regenerated in order to regain
activity. The regeneration is usually done under stoichiometric conditions and
the adsorbed NOx
dissociates to nitrogen.
Using conventional catalyst technology, the
fuel-rich cycle for regeneration reduced fuel efficiency by up to 4 % because
extra fuel was used for reduction of the sulphur in the exhaust stream. Almost all NOx adsorbers require
ULSD to maintain performance but with the mandatory use of ULSD from 2006, this
is no longer an issue.
Different sources of energy and versions of the
regenerative step in many ECT are under development. These include using hydrogen (generated or stored onboard) as the
regenerative agent for many different ECT devices.
Unfortunately, there are few new reference documents available on the successful implementation of NOx adsorbers as the technologies employed for diesel engine systems are constantly evolving.
6.1.2
Impact on Emissions and Fuel Economy
Few manufacturers have made public announcements relating to certification, pricing or availability for engine systems to meet 2007/10 regulations. The rising price of oil and diesel fuel has caused the manufacturers to focus on reducing the potential fuel economy penalty of the extra ECT. Operating costs tend to be one of the most important purchase decision criteria and so fuel economy gains can be made at the expense of a slightly higher capital cost.
General
Test data on 2007 engines is still considered proprietary by major manufacturers so the actual impact of the ECT is very difficult to quantify. However, the literature suggests that fuel economy penalties may be substantial. 2007-model diesel engines are expected to use a combination of cooled EGR, three-way catalyst and active particulate filters. SCR is expected to be added to achieve US2010 requirements. The EPA originally estimated that there would be an approximately 4% reduction in fuel economy due to the introduction of US2010 regulations. The EPA is now estimating a reduction of as much as 7 to 14% once diesel engines are fully compliant: 1 to 4% due to EGR, 3 to 5% due to regeneration of active particulate filters and 3 to 5% from SCR.[116]
EGR
Although the EPA stated (during the rulemaking for 2007/10) that implementation of cooled EGR would achieve most of the necessary emission reductions, they anticipated increases in fuel consumption due to pumping losses. They believed that advanced turbochargers, advanced combustion chamber design and electronic controls would also be used to overcome losses in efficiency.[117] While recovery of engine efficiencies is expected to be a major priority going forward, as noted above, the EPA is still expecting a 1-4% reduction in fuel economy in 2007 EGR systems.
DPFs
The fuel consumed to regenerate the diesel particulate filter does not contribute to vehicle motion and is therefore a penalty. Operator experience with the deployment of DPF technologies has shown fuel economy penalties ranging from 1% to 10%. A consortium of leading technology groups in Europe has recently reduced the fuel penalty it applies to DPFs in its well to wheels analysis from 4% to 2.5%.[118] Even the most optimistic assessments of the potential impact of DPF by the diesel industry range from 1-2%.[119]
SCR
While the early
implementation of SCR would have a substantial impact on NOx emissions, due to the additional cost,
fuel economy penalties and UREA management issues, it is assumed that buses
will be procured in the 2007 to 2009 timeframe without SCR.
As described above, the EPA believed that ECT systems would create a penalty in fuel consumption and there are two elements to the penalty: efficiency loss and lower energy fuel.
While it is expected that there will be substantial development work undertaken to reduce the fuel economy impact of ECT the range of potential impact of ECT, even if only partially implemented in 2007, will be 2 – 8%. Subject to more current data being released by manufacturers, for the purpose of this analysis, a 4% fuel economy penalty would appear reasonable; being the bottom end of current EPA expectations and consistent with the most recent literature.
As discussed in detail in Section 5.4, due to
changes in refinery processing, ULSD fuel will have lower aromatics and energy
density, and therefore less energy content than 500-ppm diesel. In its
submissions to the EPA when the 2010 rulemaking was being considered, the
National Petroleum Refiners Association submitted a letter to the EPA stating
that the energy loss to be incurred to produce 15 ppm diesel could be upwards
of 5%. More recent indications are that the impact is more likely to be in the
1-2% range depending on additives that may be used to recover energy density in
the fuel. City Staff provided fuel specification sheets from Suncor indicating that
the specifications on LSD and ULSD are alike with respect to minimum Cetane
number and maximum density. Because the specification sheet provides only
minimum and maximum numbers, sustain-ABILITYTM contacted Suncor to obtain a more firm
indication of any differences in LSD and ULSD. David McMillan, from Suncor,
confirmed that the values shown on the sheets are generic compliance numbers
and have been designed to allow multiple sources of fuel. The fuel delivered to OCT is from a variety
of refineries in the Toronto to Montreal area and is currently not a Suncor
product. In general, a slight decrease in energy content would be expected (not
directly measured) for ULSD over #2 diesel.
The resulting fuel economy penalty is unknown but could be in the 1-4%
range. However, if switching from #1 diesel, the difference would be much
smaller. For the past few years, #1
fuel in most of Canada has been made with the same processes that are now used
for ULSD. Suncor was reluctant to go on
record with respect to the chemistry of its ULSD product, but the expected
energy loss was greater than 1.8%.
While Cetane enhancing additives can address the loss in energy density, the impact of lower aromatics is not as easily addressed. The Canadian Petroleum Products Institute[120] and Chevron have recently gone on record backing the representation that the impact on energy content and fuel economy is likely to be in the 1% range. And, because Ottawa is currently using #1 LSD diesel, for the purpose of this evaluation, the value of 1.0% will be used as a penalty for 2007 engines over 2005 engines. The impact on the lifecycle cost is, in any event, very minor.
Diesel Engines
Although not specifically related to bus engines,
Volvo has indicated that fuel economy will be “equivalent” for 2007-compliant
diesel engines and that they will be more expensive. Volvo
Trucks North America unveiled its new family of heavy-duty diesel engines—the
11-liter D11, 13- litre D13 and 16- litre D16—meeting the US 2007 emission
standards. The engines will use “high-performance cooled exhaust gas
recirculation” and diesel particulate filters to achieve the new emissions
standards. The engines are expected to
deliver fuel economy equivalent to the current engines. Volvo will apply a $7,500 surcharge on
invoices for 2007-compliant trucks with both Volvo and Cummins ISX engines to
cover the cost of development work to meet the 2007 emissions requirements.[121]
Detroit Diesel has indicated that it expects
2007-compliant engines to cost $7,000 – 10,000 more to cover the additional ECT
equipment installed.
CNG Engines
Cummins Westport has reported on the evolution of CNG emissions control strategies in several publications and has indicated that it will release 2010-compliant engines in 2007, three years in advance. Expected fuel economy figures or costs have not been publicly released.
The 2004 John Deere CNG engines performed well in testing at WMATA and have represented that fuel economy, much-improved in newer-model CNG engines, will not be affected by new ECT systems[122]. Deere indicated in June[123] that changes in fuel strategy, from lean burn on the 8.1L to stoichiometric on the 9L has some added benefits in the form of power and even lower emissions, expecting the new engine platform will be characterised by:
Ø
Stoichiometric
engine with three-way catalyst;
Ø
Increased
power rating-320 hp / 1100 lbft. Torque;
Ø
0.2 g NOx production - Fall 2006.
6.1.3
Getting to 2010
CNG engines from Deere and CWI to be shipped in 2007 are expected to be compliant with 2010 regulations. With an early start to long-term testing (in-use service), both companies should be able to report on actual fuel economy, emissions and use the data to incrementally improve performance while maintaining certification.
Diesel engines will require continued research and development to comply with 2010 regulations. There continues to be uncertainty about the exact methods for obtaining the very low NOx numbers but most manufacturers have indicated that they expect evolutionary improvements in current techniques will be sufficient.
According to tests and reports from SwRI[124],
the potential paths for engine manufactures are multiple and a combination of
ECT and better in-cylinder combustion control will lead to compliance. SwRI has indicated that it expects the
following changes to diesel technologies 2007-2009, compared
to the 2006 base engine technology:
Ø Increased Exhaust Gas Recirculation Flow
o
Additional
cooling
o
Requires
additional boost from turbocharger
Ø Fuel and Combustion
o
Injection
system and bowl optimisation
o
Advanced
combustion
o
Low sulphur
fuel in place
o
Active
Particulate Filter
o
Post
injection or secondary injector for regeneration - fuel penalty
Ø Crankcase Ventilation System
The following diagram provides an overview of the
two competing technology paths to 2010 NOx compliance.
Diagram 19 -

NOx Compliance Pathways
Materials presented by SwRI also suggest similar
paths will be followed beyond 2010 as discussed in more detail in section 7.3.
6.1.4
Summary
Each manufacturer has made general claims about fuel economy impact but very few have been specific or forthcoming with test data. Consequently, some of the details have been included in this section to give an indication of the complexity of the issue and general technical direction. Until certification results are released (Q4 2006 and Q1 2007) and OEM platforms with the new engines are tested, some uncertainty will remain. For the purpose of this report, greater emphasis has been placed on representations from SwRI and the EPA, both of which are well respected, have good access to data, and have made summaries of information from several manufacturers.
The use of an average efficiency penalty will mask the potential advantages of one system over another and a more detailed analysis of each ECT strategy utilized for different manufacturers should be performed.
6.2
Procurement of Renewable Fuel
Sources in Ottawa
As discussed earlier, both HCNG and biogas are possible renewable fuel options for Ottawa. General and qualitative discussion on the possibility of using renewable or waste sources of methane and hydrogen in the Ottawa context follows.
6.2.1 HCNG
HCNG is considered a renewable or lower-emission fuel to the extent that the hydrogen added is derived from renewable or waste sources of hydrogen. To be practical in the Ottawa context, the hydrogen must also be capable of being produced in quantities sufficient for use in transit fleet applications. If 30% hydrogen were used, quantities of up to 10 – 15 kg per bus, per day would be required. In these quantities, renewable hydrogen could practically be produced today from water electrolysis utilizing renewable or zero-emission electricity or from synthesis gas from gasification of waste or biomass. Renewable electricity at this scale may be available in the Ottawa region from hydro-electric generation plants. While the grid mix in Ontario includes significant amounts of coal-fired electricity, on-site production using excess power at Ontario Power Generation or Hydro-Québec facilities could be used, or green tags could be used to ensure a direct link for hydrogen produced from grid electricity on or near the point of consumption.
Renewable or zero-emission hydrogen could also be produced locally by purifying synthesis gas streams from gasification or pyrolisation of biomass, landfill or other waste streams. The potential benefit of this pathway includes a potential reduction in methane emissions from the feedstock. Processes to produce hydrogen in this manner are not widely used today but nearing commercialisation. An Ottawa-based company, Plasco Energy Group, is one of the companies pursuing related technologies. From an overall energy efficiency and emissions reduction standpoint, a good argument can be made to use the bio-methane itself unless the prime mover requires hydrogen.
Zero-emission hydrogen could also potentially be produced from nuclear power. Given the proximity of Ottawa to major hydro-electric facilities and the near zero-emission Québec grid, and the significant cost of transporting hydrogen long distances, nuclear hydrogen is unlikely to be a near or medium-term option.
The final, and potentially most cost-effective and practical source of zero-emission hydrogen in the near term is likely to be merchant hydrogen derived from waste hydrogen streams from industry. There are two major facilities within two hours of Ottawa, an Air Liquide facility in Bécancour, Québec and a BOC facility in Magog, Québec. Up to 8,000 tons of by-product hydrogen from the production of caustic soda and chlorine production by PCI Chemicals is sold to Air Liquide for liquefaction and merchant sale. Approximately 5,100 tons of by-product hydrogen from the production of sodium chlorate by Eka Chemicals is sold to BOC for liquid hydrogen production.[125] Hydrogen from one or both of these plants could be contracted from the merchant gas companies to provide hydrogen for HCNG fuel in Ottawa.
6.2.2 Biogas
The Partners for Climate Protection Program[126] and the City of Ottawa’s Air Quality and Climate Change Management Plan target reduction of methane emissions, principally from landfills, as a target for GHG reduction.[127] Several projects have already started in the Ottawa region to use locally collected waste/bio-methane to displace pipeline natural gas energy. For example, the Trail Road landfill site has been adapted to use the renewable methane that is normally flared, to create electricity for export to the grid.[128] The City has entered into a partnership agreement with Energy Ottawa to utilize the gas from the Trail Road and Nepean landfill sites. This project was expected to produce 5 MW and reduce a large amount of GHGs representing 6 to 12% of community emissions from 1990 levels. The City has also identified private landfill sites, such as Carp, with the potential to produce 4 MW.
It is also possible to clean up landfill methane for use as a transportation fuel. In Sweden, biogas is used in transit buses in blends of up to 100% biofuel, and is commonly added to conventional natural gas in the gas pipeline. While more study would be required to determine the cost of such a program in Ottawa, the feasibility of delivering biogas from suburban landfills to City transit facilities has been established.
6.3
Future
Considerations Regarding the Use of New Buses in Ottawa
6.3.1 General
Engine and vehicle manufacturers have expressed the view that there will be many different fuel options available for heavy-duty fleets (including transit) for the next 40 years (please see the IVECO “Roadmap” in Diagram 20). With 2700 buses using their engines, IVECO is one of the largest suppliers of CNG engines in the world. IVECO continues to promote its technology choice because “In the case of stoichiometric mixture combustion (preferred engine technology for 2007 CNG for IVECO and other major manufacturers), exhaust pollutants are well below the levels of the EEV (Enhanced Environmental Vehicle), very near the fuel cell level.”[129]
6.3.2
Evolution of the CNG Technology
While the direction of post-2010 emissions regulations is uncertain, the following provides an overview of the likely evolution of CNG technology.
There are several paths that CNG can take in the
future for bus applications. They can be categorized as follows:
1.
CNG
high-pressure injection (direct injection into combustion chamber)
2.
LNG to CNG
onboard (storage of LNG with conversion to gas before combustion)
3.
Biogas as a
source of renewable methane (station and supply issue only)
4.
Blending
natural gas with hydrogen (onboard or before dispensing)
5.
Hybridisation
of CNG with electric or other drivetrains
Paths 1 and 2 are currently under investigation or
testing and show emissions and economic advantages. Path 2 is a commercial product for other market applications like
other Class 8 heavy-duty vehicles and in limited use in transit buses. Path 3 is currently commercially used in
both stationary power and transportation applications, and is sometimes blended
in a conventional methane stream for general consumption. Biogas is a “feedstock technology” that
improves the lifecycle emissions of the fuel by providing renewable methane
from many sources including crops, residues, waste and animals. To date, biogas
has been used primarily for stationary power generation in North America but
this may change as waste and emissions reduction programs further develop in North
America.
Path 4 is being used in transit buses and CNG vehicles in Malmo, Sweden. It has also been tested in transit buses at SunLine Transit in Palm Springs, California and will soon be tested at LA MTA[130] and in Vancouver at Translink[131]. Please see Section 6.2.1 for a more detailed discussion of HCNG.
Path 5 is a logical progression for CNG vehicles as
the cost of hybrid drivetrain systems drop. The potential benefit from
hybridisation applies to whatever engine/fuel package is utilized as the
reduction in GHG emissions accrues primarily from a reduction in fuel
consumption due to the use of a smaller engine, augmented by the electric
drive. While this study focuses on a non-hybrid CNG bus versus a diesel hybrid
bus, the potential benefits of a hybrid CNG bus would be expected to be
equivalent to the advantage of DEH vs. conventional diesel. CNG hybridisation could provide all the
benefits of partially electric drivetrains (as in the DEH) and have very low
emissions and reduced fuel inventory leading to much lower station and vehicle
fuel costs. Very recently, ISE Corporation, in conjunction with CARB and San
Diego, has committed to building and testing advanced CNG hybrid buses.[132]
The main thrust of the HCNG direction is to enable CNG engines to meet 2010 emissions without exhaust after-treatment and the cost and efficiency loss that it entails. Guaranteeing the lifetime of ECT is also a major issue for manufacturers.
Advances in direct injection technologies developed for CNG are being adapted[133] for hydrogen in large and small engines and this development also advances the use of blended fuels.
Westport’s H2DI technology has been in testing at
Ford, and has shown the potential to provide high power and engine torque with
diesel-like efficiency and very low emissions.
Once 2010 regulations are met, the focus in CNG
engine technology, as with diesel, will be on efficiency improvement. For
example, at Volvo, improved efficiency is being explored using Variable Valve
Actuation (VVA) technology to remove the throttle and optimise valve events.
The throttle is the main contributor to efficiency loss with CNG engines. 2007-CNG engines are moving to a more common
platform with their diesel counterparts, so much of the work planned to regain
efficiency losses due to emissions control technologies will accrue to CNG
engines.[134]
6.3.3 Evolution of the Diesel Electric Technology
In the case of a parallel hybrid drivetrain, where the engine powers the drive wheels directly and charges batteries, the technology evolution is even more complicated than with a direct wheel drive. In this section, the two systems (power generation from an engine and electric power transfer to the wheels) are addressed separately. Any improvement in diesel engines will be applicable to diesel hybrids but the commercial availability may not be universal due to the lower volume of DEH vehicles and different engine platforms used. Similarly, any improvements in hybrid drivetrains (both mechanical and electrical) will be equally applicable to any vehicle, regardless of fuel. Until complete buses (chassis testing) are tested for compliance with regulations, as is done with light-duty vehicles, DEH emissions performance will be dependent on engine certifications. All diesel engines for transit buses are emissions certified independently from a vehicle.
The focus for DEH bus evolution fits into certain categories of change:
Ø engine performance improvements
Ø fuel consumption reduction through higher efficiency
Ø higher specific power resulting in smaller, lighter and more efficient engines
Ø emissions control improvements
Ø reduction in the amount of unburned gases in the exhaust
Ø reduction and trapping of any particulates and NOx
Ø electric drivetrain improvements
Ø improved batteries and battery management systems
Ø more flexible and adaptive power delivery systems (for a variety of duty cycles)
Ø more aggressive and effective regenerative braking systems
Ø drivetrain weight and volume reductions to improve fuel consumption.
Each of the preceding items will have a different impact on emissions and performance. It is difficult to tell at this early stage of DEH development which, if any, will become the dominant area for progress.
Improvements in Diesel Engine &
Emissions Controls Performance
Diesel engine manufacturers will continue to make improvements in the areas of engine operation and performance. The improvements are expected to result in lower emissions, higher efficiency and broader fuel capabilities (bioliquids). ECT will continue to evolve and there are possible revolutionary technologies that may potentially change the landscape for heavy-duty diesel engines in the future.
The following summarizes the stated direction of a leading diesel engine manufacturer and is important to consider.
In summarizing the challenges in complying with regulations, Detroit Diesel Corporation (DDC) clearly stated that “Substantial effort is still required before these concepts can evolve into viable commercialization strategies”.[135] Specifically, DDC sees the following as important:
Ø NOx reduction technologies for 2010 are likely to include a combination of in-cylinder combustion-based approaches integrated with NOx after-treatment
o Proportion of NOx reduction targeted via in-cylinder combustion optimization versus that via after-treatment devices depends on lifecycle cost and engineering margin considerations
o Multiple-mode combustion concept is emerging and it seeks to optimize combustion across the engine speed and load range
Ø Urea-based SCR devices are a viable NOx after-treatment choice for several worldwide applications including US2010, Euro IV, Euro V and JP05
o Model based control systems with feedback sensors will enhance NOx conversion efficiencies, determine plausibility, and help detect NH3 slip, failure modes and tampering
It is almost certain that engine combustion AND emissions controls will continue to receive the bulk of attention, because in February of 2005, the US DOE announced almost $90M in funding for “Projects to Increase Engine Efficiency” focusing on two areas: advanced combustion and exhaust energy recovery. The 2006 Diesel Engine Efficiency and Emissions Research Conference also focused more on the theme of engine efficiency post-2010.
Advanced Combustion Developments
Caterpillar and its research team will work with
Homogenous Charge Combustion Ignition (HCCI) using a combination of enhanced
engine sensors, intelligent engine controls, variable compression ratios and
fuel composition.
Cummins and its team are developing variable valve timing and premixed charge compression ignition (PCCI) technologies. The project includes the demonstration of engines for both passenger and commercial vehicles and the compatibility of the technology with renewable fuels.
Detroit Diesel is working to combine several processes that enhance engine combustion individually into one system that enables high-efficiency clean combustion. The team will also investigate fuel matrix effects, including renewable fuels. NOx reduction technologies for 2010 are likely to include a combination of in-cylinder combustion-based approaches integrated with NOx after-treatment. The proportion of NOx reductions targeted via in-cylinder combustion optimization versus that via after-treatment devices depends on lifecycle cost and engineering margin considerations. A multiple-mode combustion concept is emerging that seeks to locally optimize the combustion event across the engine speed and load range. Urea-based SCR devices are a viable NOx after-treatment choice for several worldwide applications including US2010, Euro IV, Euro V and JP05. Model-based control systems with feedback sensors will enhance NOx conversion efficiencies, determine plausibility and help detect NH3 slip, failure modes and tampering.
GM Powertrain is working with variable valve timing technologies to support HCCI operation with respect to both spark ignition (gasoline) and diesel engines.
International Truck and Engine is researching the development and application of HCCI combustion over as large an operating range as possible by integrating commercial or near-commercial fuel, air and engine technologies (variable valve timing, variable compression ratio, variable nozzle turbocharging and fuel injection equipment) with advanced controls.
John Deere will develop a stoichiometric compression-ignition engine with low-pressure loop cooled exhaust gas recirculation (EGR) and a diesel particulate filter followed by a three-way catalyst.
Mack Trucks will develop and demonstrate a diesel-compressed-air hybrid with a projected improvement in fuel efficiency of 15%. During braking, the air-power-assist (APA) engine is expected to utilize braking energy to work as a compressor, pumping compressed air into an on-board tank.
As part of a presentation made to Clean Cities in
2006[136],
SwRI provided insight as to the general direction of technologies for engines
beyond 2010.
Diesel Technologies Post-2010
(Base 2007)
1. Fuel and Combustion
a. Possible improved strategies for reduced in-cylinder emissions
2. NOx After-treatment
a. Selective Catalytic Reduction (SCR) & SCR Catalyst
b. Urea injection system
c. Diagnostics
d. On-vehicle urea tank
e. Urea distribution
f. Vehicle operation limited with no urea
3. Lean NOx Adsorber
a. Unlikely candidate for heavy-duty vehicles
Despite the SwRI general claim that lean NOx systems are unlikely candidates, the development of hydrogen-related technologies could offer hope in the near future.
Additional information on post-engine technologies is provided below.
Exhaust Energy Recovery Development
Caterpillar will develop a new air management and
exhaust energy recovery system for commercial diesel engines. Electric
turbo-compounding and high-efficiency air system technology will be key
technology building blocks that will be developed.
Cummins will develop a waste heat recovery system to support clean and efficient combustion and reduce heat rejection.
Detroit Diesel will evaluate and cull a variety of engine-based technologies to partially recover and convert exhaust energy into useful mechanical and electrical work.
John Deere will develop turbo compounding in heavy-duty applications including both agricultural tractors and on-highway trucks.
Mack Trucks will integrate a turbocharger and compounded turbine into an overall system that is expected to include a continuously variable transmission (CVT) to optimize performance.
It is clear from the work proposed and successfully completed that there is still considerable change in store for the diesel engine.[137]
Other Post-Engine Technologies
Delphi has developed[138] an onboard diesel reformer to create hydrogen to be used as a regenerating agent for the lean NOx trap (LNT is an alternate name for NOx adsorber) that opens the door to other uses of the hydrogen rich stream.[139]
Other major suppliers are supporting this concept of completely different ECT devices. For example, Arvin Meritor is looking at a broad range of uses for hydrogen generated onboard from a plasma reformer.[140]
Improvements in Drivetrain Performance
Alternatives and enhancements for hybrid drivetrains include different ways of recovering, storing and delivering energy. Instead of using electrochemical devices like batteries, developers have used liquid or hydraulic and gas (air or nitrogen) systems in a number of ways. The simplest method is to store the kinetic energy normally dissipated as heat during stopping. A reservoir is pressurized by the “braking system” and the stored pressure is used to assist with vehicle launch. This reduces the heavy load on the engine during starts and is particularly effective in high start-stop duty cycles such as those found on urban delivery vehicles, where the technology was first applied.
As described by the EPA and UPS in the delivery vehicle's unveiling, a more advanced version of a hydraulic hybrid vehicle (HHV) may offer an improvement in fuel economy of up to 60-70% and a reduction in CO2 emissions of 40% or more compared to a conventional diesel-powered truck. In this version of the technology (which is closer to the battery hybrid of today's DEH buses), the hydraulic series hybrid uses an engine/pump to pressurize and transfer hydraulic fluid to the rear drive pump/motor and/or high-pressure accumulator. The hydraulic drivetrain replaces the conventional drivetrain and eliminates the need for a conventional transmission.
When comparing hybridisation techniques, it is important to remember that electric motors are faster; less expensive to build and maintain; and potentially more environment-friendly. Hydraulic actuators are, on the other hand, stronger and offer the advantage of continuously variable control. Until further engineering and testing is completed, it has not been determined if either liquid or gas hybrid systems will be suitable for urban transit.
Advances in battery technology could improve the performance and lifetime of the current electric hybrid architecture by reducing total weight (Lithium-based batteries), increasing energy density (Nickel Metal Hydride and Lithium) and extending the number of cycles before replacement is required. The mass, volume and cost of batteries are currently the limiting factors to improving overall economic performance of hybrid drivetrains.
No matter what fuel the engine uses, greater energy storage and delivery techniques through liquids, gases or better batteries will lower emissions and improve efficiency.
6.4
Common Practices of Transit
Systems Adopting Alternate Technologies
The adoption of alternate fuel technologies by transit
systems always begets changes in its operational habits. As a rule, the more “exotic” technologies
are, the greater the changes in operations will be.
Indeed, the introduction of new technologies imposes a
certain number of unavoidable changes to current operations just as it does to
equipment and facilities. For a system equipped with a conventional diesel
fleet, the following areas of operation are typically affected:
Table 35 -
Typical Operational Changes Associated with
Alternate-Fuel Buses
|
Type of change |
Magnitude of Change |
|
|
CNG |
DEH |
|
|
MANDATORY CHANGES IMPOSED BY TECHNOLOGY |
|
|
|
Ø Service bus operation (driving) |
Minimal |
Minimal |
|
Ø Fuelling |
Minimal |
Nil |
|
Ø Engine maintenance |
Minimal |
Substantial |
|
Ø Transmission maintenance |
Nil |
Substantial |
|
Ø Fuelling station maintenance |
Substantial |
Nil |
|
|
|
|
|
OPTIONAL CHANGES AIMED AT OPERATIONS OPTIMIZATION |
|
|
|
Ø Bus deployment (routes) |
Desirable |
Desirable |
|
Ø Bus deployment (maintenance facilities) |
Desirable |
Unwarranted |
|
Ø Maintenance schedules & practices |
Desirable |
Unwarranted |
Source:
sustain-ABILITY™, 2006
In the business cases developed in Section 4 of this
report, costs associated with the changes described in the preceding table have
been calculated only when absolutely warranted by the technology change – the
mandatory category. In practical terms,
few transit systems would proceed on this basis. Additional changes would be carried out to minimize costs further
and choices would be made based on a trade-off between flexibility and costs.
Most transit systems would not implement CNG buses in two
facilities at once when only one site could handle the quantity of buses
purchased. This would avoid important
capital costs in the short term and allow the transit system to better evaluate
their commitment to the CNG technology before investing in fuelling stations
and garage upgrades in several locations.
In the case of DEH buses, the savings resulting from a
possible concentration of buses in a single location are not as
substantial. Fewer maintenance
personnel would require training and only one facility would require the added
tooling and equipment required for DEH buses.
The avoided costs may not be worth the loss of operational flexibility
in this case.
The introduction of new technology and the choice of
facility or facilities where new buses are to be serviced also affords transit
operators the opportunity to upgrade current installations or build new
ones. The cost of upgrading certain
facilities to meet the requirements of new technologies is sometimes
prohibitive, especially when the current facilities are older or are located in
a location where space can no longer accommodate future expansion.
The scope of the sustain-ABILITY™ mandate does not include
a broader examination of the Ottawa situation, nor a longer-term one. The
Section 4 reconstructed models used current plans for bus deployment without
attempting to determine the appropriateness of their maintenance facility
allocation. The potential cost savings (or added expenditures) associated with
other facility assignments to existing or upcoming facilities have not been
determined and the cost-benefit analysis of a dedicated facility has not been
considered. These options must be
considered within a longer-term context and a view of the transit system that
includes all its operations, current and future.
6.5 National and
International Transit Acquisition Trends
In Canada, few
transit systems operate or have operated CNG buses: Toronto, Hamilton,
Mississauga, London, Burlington, Kitchener, Cornwall and Vancouver.
Among these,
Hamilton Street Railway (HSR), the largest CNG bus user in Canada, has recently
(fall 2006) purchased a few diesel-electric buses. Translink (Vancouver) has
announced it will purchase approximately half of this year’s total requirement
equipped with CNG technology. Mississauga no longer operates CNG buses and
London has not been renewing its aging fleet.
The American
transit fleet has increased by only 9% over the last 10 years. While the number of diesel buses (including
clean diesel buses) has grown by 1.5%, the quantity of CNG buses (including
those using blends) rose by 302% in that same period and the fleet of buses
equipped with electric drives (including hybrid ones) has become 24 times more
numerous than it was in 1996. These
proportional increases can be misleading as they reflect, to a large extent,
the large installed base of diesel buses and the relatively smaller installed
base of the other technologies.
In relative
terms, diesel buses now represent 81% of transit buses in America, CNG 13% and
electric 1.9%. In 1996, diesel buses
represented over 95% of the U.S. transit fleet of buses.
Table 36 -
Transit Buses in Service in the United
States
|
Year |
DIESEL & CLEAN DIESEL |
CNG & BLENDS |
ELECTRIC
& OTHER |
OTHERS |
TOTAL |
||||||
|
|
# |
% |
# |
% |
# |
% |
# |
% |
# |
% |
|
|
1996 |
48,050 |
- |
1,074 |
- |
41 |
- |
1179 |
- |
50,344 |
- |
|
|
1997 |
47,177 |
-2% |
1,562 |
45% |
24 |
-41% |
1078 |
-9% |
49,841 |
-1% |
|
|
1998 |
47,174 |
0% |
2,148 |
38% |
33 |
38% |
1092 |
1% |
50,447 |
1% |
|
|
1999 |
47,745 |
1% |
2,494 |
16% |
41 |
24% |
1328 |
22% |
51,608 |
2% |
|
|
2000 |
49,249 |
3% |
3,072 |
23% |
68 |
66% |
1075 |
-19% |
53,464 |
4% |
|
|
2001 |
49,743 |
1% |
4,137 |
35% |
80 |
18% |
1230 |
14% |
55,190 |
3% |
|
|
2002 |
50,894 |
2% |
5,497 |
33% |
113 |
41% |
1311 |
7% |
57,815 |
5% |
|
|
2003 |
49,755 |
-2% |
6,178 |
12% |
146 |
29% |
1382 |
5% |
57,461 |
-1% |
|
|
2004 |
48,545 |
-2% |
6,035 |
-2% |
181 |
24% |
1480 |
7% |
56,241 |
-2% |
|
|
2005 |
47,332 |
-2% |
6,873 |
14% |
606 |
235% |
1839 |
24% |
56,650 |
1% |
|
|
2006 P |
44,508 |
-6% |
7,149 |
4% |
1,022 |
69% |
2064 |
12% |
54,743 |
-3% |
|
(a) Includes bio/soy fuel, biodiesel, hydrogen and HCNG
Source: APTA survey (approximately 300 properties)
In 2006, the sale of electric buses is expected to surpass those of CNG buses for the first time with 416 new electric buses expected to go into service compared to 276 CNG buses. Predicting future sales exceeds the scope of this mandate.
Presentations made by the representatives of Orion and New Flyer confirm that DEH buses represent the fastest growing segment of the industry in North America. With increasing sales, prices are expected to decrease in the future. It should be noted that all bus purchases in the United States are heavily subsidized by the US Federal Transit Administration (FTA) and, given the fact that the acquisition price of DEH buses is the single most important hurdle to their adoption, such a program favours the sale of DEH buses more than that of CNG buses. In addition, the FTA subsidizes infrastructure and R&D for DEH buses as well as for CNG buses through the Clean Fuels Program and the R&D University Program.
On the other hand, new CNG fleets have become exceptional in the recent past. Most transit systems buying CNG buses in the last few years have done so because they benefit from an existing infrastructure. As it is the case with several new technologies, such as hydrogen and fuel cell buses (Sunline, Chicago Transit Authority, BC Transit, AC Transit, etc.), systems that have adopted CNG often benefited from government assistance to support, at least in part, the added infrastructure cost. From an economic perspective, systems already operating CNG buses have a much better business case for the expansion of CNG fleets in light of new emissions standards. This situation explains a share of the recent sales of CNG buses.
6.6
Other Considerations Regarding the
Adoption of Alternate Technologies
The analyses performed by sustain-ABILITYTM were done under a set of parameters determined by the City of Ottawa to minimize the impact of introducing new technologies on operations and to obtain results on the CNG option from a base as comparable as possible to that used by the NRC in its August 2005 study. While utilizing this approach provided boundaries for the current study, it removes the possibility of examining more realistic options to introducing CNG buses in the City fleet.
Most transit systems would not bring CNG buses into their largest and oldest facility, as is the case for the St-Laurent South garage in this study. First, the cost of upgrading the facility is usually prohibitive. Second, the necessary construction and renovation activity results in too much operational disruption. And finally, the result is invariably a compromise between capital cost and operational efficiency.
If at all possible, transit systems would much prefer to use the opportunity of introducing this new technology to build a new facility or vice-versa. The marginal cost of building a new garage to CNG standards (or lighter-than-air gaseous fuel standards) under such circumstances is approximately 10% to 15% higher. In the particular case of the City of Ottawa, which is currently planning the construction of a new garage, there would be further savings (compared to the business case presented in Section 4) as one facility could suffice in hosting the whole CNG fleet, thereby requiring only one fuelling station. If a new garage meets lighter-than-air gaseous fuel standards, it can also accommodate hydrogen/fuel cell vehicles when the City is ready to take the next step towards a zero-emission fleet.
Many transit systems that introduced CNG buses in their fleet often started with smaller quantities of vehicles than the 226 buses considered by the City and sometimes ran parallel in-service experiments on two competing technologies (CNG and DEH for example). This strategy allowed its users to measure precisely the benefit of each technology under their own operating conditions and in their own service territory.
The City Staff accurately suggested that «If we are going to trial CNG in Ottawa, using the new garage is probably the only workable solution, as it would avoid the operational and costs disruptions of converting older garages. It would be more attractive, if for example, the CNG consortium would pay the differential infrastructure costs for the new garage, as their commitment to a cleaner environment. A trial fleet of CNG could also be benchmarked against a new fleet of hybrids, operating out of the same new garage, with the older garages dedicated to clean diesel technology. It would have the potential for the ultimate apples-to-apples comparison and, as such, perhaps eligible for new federal dollars, as well as lots of good PR. Just as Translink is keeping CNG intact, albeit somewhat reduced, to allow continuous technology evaluations on the road to hydrogen, Ottawa could do the same». sustain-ABILITY™ fully agrees with this position.
6.7
Pathway to a Zero-Emission Fleet
Most industry experts believe that zero-emissions fleets will operate hydrogen-powered vehicles in the future. Whether these vehicles are fuel cell[141] buses or fuel cell hybrid buses, they share two common technologies: hydrogen fuel and electric drives. In this context, both CNG and DEH buses represent transitory technologies.
The following table illustrates two of the possible pathways from conventional diesel buses currently in use to fuel cell-powered buses. A third, much less popular or likely pathway known as the liquid fuel pathway, entails the use of liquid hydrogen (LH2). Its implementation is very expensive (mainly due to the cost of liquefaction) and highly complex as LH2 is difficult to handle (storage and refuelling). Similarly, the use of a liquid carrier such as methanol requires complex equipment added to the already intricate fuel cells as a reformer is required on-board vehicles to produce the hydrogen needed by the fuel cell. Such reformers operate at very high temperatures and therefore require peripherals that make such an option rather space consuming. Moreover, current hydrogen reservoir prototypes permit the storage of very high pressure (10,000 psig and more) gaseous hydrogen at densities approximating that of LH2 at a much lower cost, thereby making the use of LH2 even more unlikely.
Yet a fourth, the solid fuel pathway is also theoretically possible. It involves the use of nanostructures and of an adsorption process to store hydrogen. Research results relating to this pathway have been disappointing for the automotive industry so far, mainly because the weight of the material involved and the small quantity of hydrogen it can store (2% to 3.5% of total weight) make it inappropriate for transportation purposes so far.
Consequently, only the two most likely pathways are discussed in this section.
Using the two most likely pathways, evolving towards fuel cell-powered buses can be done in small incremental steps that include the elements summarized in the following table:
Table 37 -
Two Pathways to Fuel Cell-Powered
Buses
|
Gaseous Fuels Pathway |
Electric Drive Pathway |
|
Conventional Diesel /
Biodiesel Buses |
|
|
CNG |
DEH / Bio-DEH[142] |
|
HCNG: CNG buses using a gas mixture of 20-30% hydrogen[143] |
|
|
H2ICE: Internal combustion engine buses running on 100% gaseous hydrogen fuel |
|
|
H-H2ICE Hybrid: buses (similar to DEH ones) equipped with an internal combustion engine running on 100% hydrogen and batteries and/or ultracapacitors |
|
|
Fuel cell-powered |
|
Source: sustain-ABILITY™, 2006
The choice of a pathway will dictate the City’s level of preparation over time for the adoption of fuel cell buses. The major areas that the City will have to be prepared for include:
Ø Fuel
o Sources, in terms of volume, economics, environmental sustainability
o Physical and chemical properties
o Safety
o Training
o Regulation and compliance
Ø Technology
o Fuel storage
o Pressure vessels
o Prime mover and major components
o Diagnostics, Tooling
Ø Infrastructure
o Fuelling
o Buildings (planning for tomorrow must begin today)
o Properties (number, location, size)
o Utilities (electricity, water, feedstock)
Ø Policies and procedures
o Operational
o Occupational health and safety
o Regulatory compliance
Ø Human resources
o Skills
o Numbers
o Training
o In-house or outsourced
Ø Pace of progress toward objectives
o Speed
o Achievement of short and long-term goals
At this time, the City of Ottawa is likely to follow one of these two pathways to its zero-emission transit fleet. Each of the two pathways presents risks and benefits.
 Considering these options from a short-term perspective favours DEH
buses as they likely represent the easiest and least costly road and offers an
immediate solution because they do not require substantial investments in
facilities. However, retraining mechanics
into electrical technicians may not prove easy, or efficient. The demography of the workforce and scale of
proposed deployment should therefore be taken into consideration. It may be
more appropriate to wait for qualified personnel to graduate from the numerous
professional training programs currently making their appearance on college
campuses in many areas of the country than a massive retraining of an aging
team to handle electric powertrains while introducing new emission treatment
systems for diesel engines. It should also be noted that the battery handling
equipment and facilities as well as the skills to handle and maintain batteries
on DEH buses would not likely be of any use when adopting fuel cell or fuel
cell hybrid buses in the future.
Considering these options from a short-term perspective favours DEH
buses as they likely represent the easiest and least costly road and offers an
immediate solution because they do not require substantial investments in
facilities. However, retraining mechanics
into electrical technicians may not prove easy, or efficient. The demography of the workforce and scale of
proposed deployment should therefore be taken into consideration. It may be
more appropriate to wait for qualified personnel to graduate from the numerous
professional training programs currently making their appearance on college
campuses in many areas of the country than a massive retraining of an aging
team to handle electric powertrains while introducing new emission treatment
systems for diesel engines. It should also be noted that the battery handling
equipment and facilities as well as the skills to handle and maintain batteries
on DEH buses would not likely be of any use when adopting fuel cell or fuel
cell hybrid buses in the future.
The CNG or gaseous fuel pathway offers the advantage of requiring limited change in current servicing and maintenance procedures. This minimizes the probability of buses failing due to maintenance personnel performance and enables transit systems to maintain a quality of service comparable to that afforded by a conventional diesel fleet. The adoption of CNG buses however requires considerable capital investment in facilities and safety systems, costs that could be mitigated in large part in the context of building new facilities or at least upgrading more recent ones. The experience gained by working with familiar engines in a lighter-than-air gaseous fuel environment will be essential to operating the hydrogen fleet of the future. This pathway is particularly attractive if new facilities are being considered to host the fleet, thereby reducing the capital costs forecasted by sustain-ABILITY™ and making it possible to build a hydrogen-ready garage at a reasonable cost and preparing for the not so distant future.
From
an economical viewpoint, the CNG pathway may carry more financial risk for the
City, primarily because of infrastructure costs. Existing natural gas infrastructure cannot be totally
adapted for hydrogen because of the unique properties of hydrogen including
small molecular size leading to permeation and sealing problems, low energy
density and lower compressibility at high pressure, increased flammability
range, and hydrogen embrittlement/hydrogen-induced cracking in metals that come
in contact with hydrogen.
It should be noted that whatever the eventual pathway, fuel cell buses will use an electric-propulsion technology similar to that used in DEH today.
As sustain-ABILITY™’s mandate is limited to considering the impact of two technologies within current operating conditions, longer term considerations and alternative solutions that may prove more cost efficient to the City in the long term were not examined or evaluated.
7 Summary of Findings and Conclusions
The main objective of this evaluation originally was the validation of the financial and environmental components of the CNG Option. In the course of the project, the Steering Committee agreed to widen the scope of this study to enable, to the extent possible, a fair comparison of both technologies, CNG and DEH.
The preceding sections provided an independent assessment of the CNG Option (Section 2) as well as a review of the DEH Option (Section 3). Two sections were dedicated to the reconstruction of the business (Section 4) and environmental (Section 5) cases. This chapter summarizes sustain-ABILITY™’s findings and provides conclusions based on these analyses.
7.1 Financial Components of the CNG and DEH
Options:
The Lifecycle Cost of CNG and DEH Buses at the City of Ottawa
In order to further pursue the objectives set in its FERS, the City of Ottawa can integrate CNG or DEH buses in its transit fleet. This section discusses the financial consequences of using either technology and uses the alternative of procuring conventional diesel buses as a basis for comparison.
The DEH case benefits from specific field tests reported in the NRC study and, according to the agreement made by the Stakeholders, sustain-ABILITY™ has based its analysis of the DEH business case on the best scenario described by the NRC for DEH buses. This scenario is described as the low –speed model.
Equivalent testing was not conducted for the CNG buses. sustain-ABILITY™ therefore used the average performance and costs of the Ottawa fleet for its analysis of the CNG business case.
7.1.1 Summary of Financial and Operational Hypotheses
The general assumptions applied to the analysis of both technologies were:
Ø Inflation rate (CPI): 2.5%
per annum
All costs were increased annually unless otherwise specified
Ø
Discount
rate: 5.25%
Based on the current cost of capital of the City of Ottawa[144]
Ø Bus requirement 226 40-foot buses
Ø Bus deliveries 2007:68, 2008:80, 2009:78
Ø Average km/bus/year 59,156
Ø Subsidies were not taken into consideration
Ø Sales tax rate (PST only) 8%
Ø US$ to CA$ exchange rate (July 2006) 1.135
Ø Ratio of parts & supplies to labour on maintenance 1 / 1
Ø Average shop rate (maintenance) $ 71
Ø Average driver salary (hourly) $29.87
Some cost elements were not taken into consideration as they were deemed to be sufficiently similar for all technologies under scrutiny, included in the City’s overhead costs and/or not material for the planning period of 18 years used for this evaluation. This is the case of project management costs for the implementation of the various technologies. The following table describes specific cost assumptions.
Table 38 -
Forecasting Assumptions for Main Bus Types
|
Hypotheses |
Diesel |
CNG |
DEH |
|
|
Capital costs (including taxes where applicable): |
||||
|
Bus prices |
$385,840 |
$418,273 |
$596,748 |
|
|
Bus price increase |
$7,500 from year 2 + inflation |
Inflation only |
$7,500 from year 2 + inflation |
|
|
Infrastructure |
|
|
|
|
|
Merivale
|
Nil |
$15,903,660 |
$881,632 |
|
|
St-Laurent North Shops
|
Nil |
$5,798,239 |
Nil |
|
|
St-Laurent South |
Nil |
$12,727,222 |
$881,632 |
|
|
Fuelling stations: -
Merivale |
Nil |
$6,156,000 |
Nil |
|
|
Swansea shops |
Nil |
$658,627 |
Nil |
|
|
Transitway Stations
(3) |
Nil |
$2,160,000 |
Nil |
|
|
|
||||
|
Operation & Maintenance costs (including taxes where applicable): |
||||
|
Maintenance costs |
|
|
|
|
|
General maintenance
cost / km |
AVG: $0.800 Low Speed: $1.02* |
$0.805 |
$0.760 |
|
|
Battery replacement |
n/a |
n/a |
5-year cycle |
|
|
Other costs |
|
|
|
|
|
PST (8%) on parts |
Included in routine O&M |
Included in routine O&M |
Parts @ 21.4% of O&M |
|
|
Supplies (omitted in the Pennant estimates) |
Included in routine O&M |
Included in routine O&M |
$38/bus/yr |
|
|
Unscheduled battery replacement (omitted in the Pennant estimates) |
Included in routine O&M |
Included in routine O&M |
$24/bus/yr |
|
|
Cost of safety devices
maintenance |
Immaterial |
|||
|
Fuel cost |
|
|
|
|
|
Fuel consumption
(l/km) |
0.595 0.826 |
0.76 |
0.603 based on NRC Road tests for low speed routes |
|
|
ULSD cost impact
(premium per litre) |
$0.02 |
Nil |
$0.02 |
|
|
Starting fuel price
basis (per litre or diesel litre equivalent) |
$0.7684 |
$0.589 |
$0.7684 |
|
|
Base fuel (diesel and
NG) price increase during the period |
Yearly |
Clean Energy Bid adjusted after 10 yrs based on GLJ
Petroleum Consultants forecast |
Yearly |
|
|
Impact of new
emissions control technology on fuel consumption |
4.0 % increase from 2008 only |
Nil |
4.0 % increase from 2008 only |
|
|
Impact of using ULSD
on fuel consumption (all buses) |
1.0 % increase |
Nil |
1.0 % increase |
|
|
Electricity cost
(compressor) / km |
Nil |
$0.016 (Ottawa Hydro) |
Nil |
|
|
Cost of compressor
maintenance / km (included in fuel price basis) |
n/a |
$0.06 (sustain-ABILITY™ estimate) |
n/a |
|
|
Fuel cost / km (year
1) |
$0.67 |
$0.446 |
$0.49 |
|
|
Refuelling labour cost
|
Identical for all technologies |
|||
|
Training |
|
|
|
|
|
Training (Staff to
train)[145] |
Nil |
172 mechanics |
361 O&M |
|
|
Training time**** |
n/a |
Mechanics: 40 hrs |
Mechanics: 16 hrs |
|
Source:
sustain-ABILITYTM, 2006
Notes:
* Calculations
based on NRC data for maintenance costs - Low Speed/Frequent Stops base case
for conventional diesel buses
-operating on that particular cycle at an average of 75,396 km (years 1
through 12) and 35,000 km for the remaining 6 years. The total lifecycle
maintenance cost provided by NRC ($1,137,472, See NRC, Annex B, p. 66) was
therefore divided by the mileage used by NRC (61,930 km/yr average) to provide
the data indicated above ($1.02/km).
** The Clean Energy bid is comprised of a “take-or-pay” bundled
price of fuel that includes an all-inclusive compressor maintenance component.
The minimum quantities are below the average consumption of current diesel
buses at the City of Ottawa. The procurement schedule of buses was done on an
annual basis and therefore, fuel consumption estimates for the first three
years of the reconstructed model are likely higher than they will be in reality
unless all new buses are delivered each year on January first and put into
service immediately.
*** MARCON has developed an Index based on EIA[146] forecasted variations for
Industrial Natural Gas Prices and GLJ Consultants[147] forecasts for Alberta Gate
Prices. The index was used to calculate
the price variation of the natural gas feedstock portion of the price supplied
by Clean Energy and to make the price adjustment in year 11.
**** Training time estimates based on experience from HSR and
consultation with Ottawa City Staff
Data pertaining to conventional diesel buses was mostly supplied directly or indirectly (through the NRC Report) by City Staff to sustain-ABILITY™. Information relative to low-speed performances and costs of these buses was largely obtained from the NRC Report. It should be noted that the NRC Report conclusions are based on slightly different data regarding the conventional diesel buses base case. In the NRC Report, the distance attributed to buses was 75,000 km for the first 12 years and 35,000 km for the remaining six. Bus acquisition costs and fuel costs per litre were also different.
The following tables
summarizes the differences between the NRC diesel case and that used by
sustain-ABILITY™ in its calculations as explained in Chapter 4:
Table 39 -
NRC and sustain-ABILITY™ Base Cases
for Diesel Buses
|
|
PER BUS |
|
|
|
NRC/Pennant |
sustain-ABILITY™ |
|
Capital Investment
Costs |
|
|
|
Bus acquisition |
440,000 |
398,711 |
|
Building and infrastructure cost |
Nil |
Nil |
|
Other soft, non-recurring costs |
Not applicable |
Not applicable |
|
|
|
|
|
Operating Costs |
|
|
|
O&M cost (excluding fuel) |
1,137,472 |
852,649 |
|
Fuel cost |
1,209,213 |
990,155 |
|
Electricity |
||
|
Others |
||
|
|
|
|
|
Non-discounted Total Cost |
2,786,685 |
2,481,514 |
Source:
sustain-ABILITYTM, 2006 and NRC 2006
Fuel costs represent
an important element in the rationale used in sustain-ABILITY™ in its
analysis. Critical information
regarding the determination of fuel cost is therefore summarized hereafter.
Forecasts pertaining to the cost of diesel fuel are based on the Annual Energy Outlook prepared by the Energy Information Administration, an independent statistical and analytical agency within the U.S. Department of Energy. It is, by far, the most quoted source on energy price forecasts. However, energy price forecasting by any organization has never been totally accurate and has often been wrong. Too many unforeseeable factors influence the price of oil and gas, such as geopolitical tensions and conflicts, to enable accurate forecasting. General trends are normally reliable, and, in the long term, both oil and gas are affected in comparable proportions by these factors.
The following table describes the anticipated price behaviour of diesel for the forecasting period:
Table 40 -
Annual Variation in Diesel Prices
2007-2028
|
Year |
2007 |
2008 |
2009 |
2010 |
2011 |
2012 |
2013 |
2014 |
2015 |
2016 |
2017 |
|
|
Annual
∆ |
9.00% |
3.00% |
1.29% |
1.52% |
7.51% |
4.30% |
2.05% |
3.44% |
4.66% |
1.65% |
0.39% |
|
|
Year |
2018 |
2019 |
2020 |
2021 |
2022 |
2023 |
2024 |
2025 |
2026 |
2027 |
2028 |
|
|
Annual
∆ |
2.10% |
2.59% |
2.23% |
1.03% |
1.02% |
1.04% |
-1.49% |
1.13% |
3.38% |
1.00% |
0.00% |
|
Source:
Annual Energy Outlook (Distillate fuels), December 2005
The CNG business case was reconstructed from a variety of sources also identified in Chapter 4. In terms of fuel prices, Clean Energy provided a price for natural gas in a firm bid to the City of Ottawa. sustain-ABILITY™ validated the assumptions of that offer and elected to modify its contents. First, the CE bid price was valid for only 30 days and sustain-ABILITY™ made adjustments for a 2007 contract by inflating the cost of natural gas by 11% from the first year. Second, provincial sales tax was added to the maintenance component of the bid. Finally, adjustments were incorporated in the reconstructed case to allow a fuel price correction after ten years using an index developed by MARCON on the basis of IEA and GLP Petroleum Consultants forecasts. As a result, the natural price component of the Clean Energy bid was increased by a further 4% in 2019. The fuelling station maintenance cost was also increased at that time using a compounded inflation rate of 2.5% per annum.
Finally, the DEH case
reconstruction was based on the NRC Report with minor adjustments and current
data. For example, the introduction of new technologies to make diesel engines
2007-compliant is anticipated to slightly increase fuel consumption. In addition to the replacement of DPF
filters on a six-year cycle ($5,000 each) for buses procured in 2008 and 2009,
sustain-ABILITYTM estimated that a 4.0 %
increase (from 2008 only) in fuel consumption would occur. The price of diesel fuel used by DEH buses is, of
course, the same as that used by conventional diesel buses described above.
7.1.2 Calculation Results for the CNG Option
Taking into consideration all the relevant and substantial factors described in Section 4 of this study provided the results presented in the following table.
Table 41 -
Total Lifecycle Cost of CNG Buses vs.
Conventional Diesel Buses
|
Fleet Average |
DIESEL |
CNG |
Diesel vs. CNG |
|
|
|
|
|
$$$ |
% |
|
Capital
Investment Costs |
|
|
|
|
|
Bus
acquisition |
90,108,581 |
95,366,244 |
5,257,663 |
5.83% |
|
Building
and infrastructure cost |
0 |
50,207,748 |
50,207,748 |
|
|
Other
soft, non-recurring costs |
0 |
692,074 |
692,074 |
|
|
Total capital costs: |
90,108,581 |
146,266,066 |
56,157,485 |
62.32% |
|
|
|
|
|
|
|
Operating
Costs |
|
|
|
|
|
O&M
cost (excluding fuel) |
192,698,598 |
193,902,965 |
1,204,366 |
0.62% |
|
Fuel
cost |
161,193,810 |
112,051,396 |
-49,142,414 |
-30.49% |
|
Electricity
(compressor) |
0 |
6,293,399 |
6,293,399 |
|
|
Total operating costs: |
353,892,408 |
312,247,760 |
-41,644,649 |
-11,77% |
|
|
|
|
|
|
|
Non-Discounted Total
Cost |
444,000,989 |
458,513,826 |
14,512,837 |
3.27% |
|
|
|
|
|
|
|
Discounted Total Cost |
302,108,366 |
333,267,256 |
31,158,891 |
10.31% |
Source:
sustain-ABILITYTM, 2006
For the next 18 years, if CNG buses were deployed indiscriminately out of the two maintenance facilities mentioned earlier in Ottawa, their use would cost the City 10.3% more than using conventional diesel buses in the same manner. Much information required to assess the cost of using CNG buses in their optimal duty cycle is not available, as no in-field tests have been performed in the context of this study. It would however be reasonable to assume that if they were operated in their optimal duty cycle, CNG buses would perform better and therefore cost less to operate than the amount presented in the preceding table.
From a non-discounted perspective, the $56 million difference attributable to the cost of adapting two existing garages to CNG and the higher price of CNG buses is partly offset by lower operating costs ($42 million). Since infrastructure costs are incurred in the first few years of the 18-year life of the project, the discounted total cost difference is calculated at $31.5 million in favour of conventional diesel buses.
The Consortium estimated cost savings generated over the diesel alternative are therefore inaccurate.
The inaccuracy of the Consortium findings is mainly explained by a logical flaw in the Consortium models (the use of $/km data from other transit systems), missing cost elements (such as the cost of adapting transitways to CNG) and inexact capital costs (the cost of adapting garages to CNG and providing fuelling stations for example).
7.1.3 Calculation Results for the DEH Option
Using the hypotheses and cost assumptions described in this chapter and supported by the analysis described in chapter 4 provides the following results:
Table 42 -
Total Lifecycle Cost of DEH Buses vs.
Conventional Diesel Buses
|
Low Speed / Frequent Stops |
DIESEL |
DEH |
Diesel vs. DEH |
|
|
|
$$$ |
% |
||
|
Capital
Investment Costs |
|
|
|
|
|
Bus
acquisition |
90,108,581 |
139,816,714 |
49,708,134 |
55.16% |
|
Building and infrastructure cost |
0 |
1,763,264 |
1,763,264 |
|
|
Other soft, non-recurring costs |
0 |
955,283 |
955,283 |
|
|
Total capital costs: |
90,108,581 |
142,535,262 |
52,426,681 |
58.18% |
|
|
|
|
|
|
|
Operating Costs |
|
|
|
|
|
O&M cost (excluding fuel) |
246,834,752 |
182,890,809 |
-63,943,943 |
-25.91% |
|
Fuel cost |
223,774,936 |
163,361,122 |
-60,413,815 |
-27.00% |
|
Battery replacement cost |
0 |
25,481,952 |
25,481,952 |
|
|
Other costs |
0 |
5,078,268 |
5,078,268 |
|
|
Total operating costs: |
470,609,689 |
376,812,151 |
-93,797,537 |
-19.93% |
|
|
|
|
|
|
|
Non discounted Total Cost |
560,718,269 |
519,347,413 |
-41,370,856 |
-7.38% |
|
|
|
|
|
|
|
Discounted Total Cost |
373,459,512 |
365,250,148 |
-8,209,365 |
-2.20% |
Source:
sustain-ABILITYTM, 2006
By assigning DEH buses to routes where they perform best, the substitution of conventional buses used on low-speed/frequent-stop routes in the City of Ottawa would procure the City with savings of $8.2 million dollars (2.2%). Despite the substantially higher purchasing price of the DEH buses and the added cost of related infrastructure ($52 million, not discounted) compared to conventional diesel buses, fuel and maintenance costs saving of nearly $100 million (not discounted) are possible.
In the NRC Report
foreword, City Staff outlined the following cost benefits:
Ø
2/3 bus
capital cost subsidy of the hybrid system under the Ontario Transit Vehicle
Program, subject to annual renewal since 2002 by the Government of Ontario
Ø
fuel cost
savings of approximately 25% based on annual new bus mileage of 75,000 km at
current fuel cost of $0.70/L with an annual increment of 4%
Ø
reduced
maintenance costs due to engine and brakes of approximately 2% to 5%
For
a recommended purchase of 226 hybrid buses, a total life cycle savings of
$59 million is predicted, generated through operational savings and 2/3
funding by the CSTT-HVC-TR-093
Province
of Ontario for the incremental hybrid capital cost component.
In August 2006, the
Ontario government terminated the Ontario Transit Vehicle Program and the RST
rebate program does not apply to hybrid electric buses. The City of Ottawa will
therefore not benefit from any subsidy if it acquires DEH buses. However, based on recent sales to another
Ontario transit system, the price of NFI DEH buses now appears substantially
lower than what is used in the NRC Report.
Fuel costs have been
discussed at length earlier and are predicted to be over 11% lower than what
the City Staff anticipated in their foreword. The cost of maintenance predicted
by sustain-ABILITY™ is also substantially less than what the Staff predicted at
almost 26% less than what conventional diesel buses would cost.
When 2007-compliant engines are introduced to the market, the benefit of lower emissions or regulated pollutants are expected to be somewhat offset by lower efficiency, increased capital cost, and increased costs of operation (fuel) and maintenance (added emissions control technologies).
7.1.4 Sensitivity of the Results
The variation of many inputs can influence the outcome of the models reconstructed by sustain-ABILITY™ for the purposes of this study. Unfortunately, performing quantitative sensitivity analysis is beyond the scope of this study. It must be understood however that the 2.2% savings calculated for DEH buses falls within the margin of error of sustain-ABILITY™’s calculations.
The following paragraphs are offered to help the reader understand the vulnerabilities of the models developed in the context of this study.
Fuel-Related
Issues
The single most important variability factor in this study is also the least predictable one: the price of fuel. Diesel fuel prices vary widely and their level will depend on market conditions as the City operates on annual contracts renewable for two years. Despite their popularity and frequent usage, EIA forecasts are not and cannot be accurate. The CNG price forecasts are no more accurate than diesel ones but the possibility of locking prices in for as long as ten years provides a good measure of stability to the model. sustain-ABILITY™ took a conservative approach by increasing the natural price component of the CE bid by 11% and yet, geopolitical events could make this provision insufficient. In such an event, the price of oil would also be affected, thereby maintaining a relative balance in the model forecasts.
In order to ensure
comparability of results, the fuel consumption assumption for conventional and
DEH buses was taken from the NRC Report using the low-speed / frequent-stop
duty cycle. The buses used by the NRC on DEH buses to perform tests on behalf
of the City of Ottawa were not equipped with 2007-compliant engines. Consequently, in-service performances will
likely vary from the results obtained by the NRC. The quality of fuel used also
has a measurable impact on engine performance that cannot be predicted in the
context of this study.
CNG buses are not
ideally suited for very low-speed and frequent-stop duty cycle. Their
assignment to some routes in Ottawa may affect their performance. The use of data from another similar transit
system (TTC) to determine fuel consumption in Ottawa is all sustain-ABILITY™
could do within the scope of this mandate. Where the data set used for DEH
buses was chosen for an optimal duty-cycle, an average of the fuel consumption
of Toronto’s buses has been selected for comparative purposes and somewhat
penalizes CNG buses.
As well, the common
practice of cycling buses through various duty cycles as they age would
penalize DEH buses in the later stage of their life. This factor was not taken into consideration in the NRC
calculations, nor was it in sustain-ABILITY™’s as the tests necessary to
provide additional data on this issue exceeded the scope of this study.
Maintenance-Related Issues
Bus maintenance data
used by Pennant in the NRC Report for its analysis of DEH buses for the City of
Ottawa was provided by King County (Seattle) for one month of maintenance
transactions and NYC for a limited time period. Pennant notes that Hybrid
Electric Drive source data for the New-Flyer-Allison is “of low quality”[148]. Given this weakness, actual costs in-service could
be above the $0.76 per kilometre provided by NRC/Pennant and used by sustain-ABILITY™. In addition, there is obviously no data
available on the new 2007-compliant diesel engines, as they have not yet made
their market entry. Their supplementary
emissions control technologies will likely increase maintenance costs substantially,
at least for the first generation of buses the City is considering buying.
CNG engines have now
matured and already meet 2007 standards, but data on CNG bus maintenance is
also poor. This is attributable to the wide disparity of answers provided by
respondents to the sustain-ABILITY™ survey, the various inclusions and
exclusions in the calculation methods used in various reports published to date
and the general lack of data on post-2004 engine models.
General Issues
Learning curve
benefits have not been considered in the course of this study. In addition to being beyond the scope of
this study, data currently available on post-2004 CNG buses and 2007-compliant
diesel-powered buses (conventional and hybrid) could not facilitate such
calculations. It should be expected
that several areas of operation will initially cost more than the average
amounts used in sustain-ABILITYTM’s long-range forecasts.
7.2 Environmental Components of the CNG and
DEH Options:
Environmental Impact of Using Alternate-Fuel Buses in Ottawa
7.2.1 Environmental Performances
The relative environmental performance of buses is a function of comparability of equipment in terms of model and technology used, the duty cycle on which it is deployed, and the regulatory environment in which it was introduced. This evaluation was conducted on the basis of existing technologies that will undergo fundamental change to comply with 2007 and 2010 regulations, so the applicability of historical data is indicative but limited.
There is, unfortunately, no directly comparable analysis of new CNG buses to DEH buses available. The data sample on emissions from newer CNG buses is limited but indicative of relative performance to diesel. The best available sample of in-service testing is from WMATA. The NREL/WMATA study demonstrated a trend in the CNG buses toward improving emissions performance and better fuel economy.
Table 43 -
Emissions
of CNG vs. Diesel Buses at WMATA
|
Vehicle |
CO (g/mile) |
NOx (g/mile) |
Methane (g/mile |
Non-Methane Hydro-carbons (g/mile) |
PM (g/mile) |
CO2 (g/mile) |
|
MY 2004 DDC Series 50 With EGR and DPX |
.34 |
17.9 |
|
0.003 |
.025 |
3346 |
|
MY 2004 John Deere 6081H CNG with Oxidation Catalyst |
.14 |
9.08 |
10.6 |
0.55 |
.004 |
2173 |
|
CNG Emissions as % of Diesel |
41% |
51% |
|
18,333% |
16% |
65% |
* Total Hydrocarbons – Methane plus non-methane hydrocarbons
Source:
NREL, 2006
The John Deere CNG buses produced 59% lower CO, 49% lower NOx emissions, 84% lower PM and 35% lower CO2 emissions compared to the MY 2004 DDC diesel buses.
The UDDS duty cycle, upon which this evaluation is based, is very similar to the EPA, FTP Transient, certification cycle. The following table presents a comparison of USEPA 2006 emissions certifications for comparable Cummins diesel and CWI CNG engines. Unfortunately, the engine certification testing only covers NMHC + NOx and PM emissions and the NREL and Environment Canada studies report emissions in g/mile versus g/bhp-h. The USEPA and Environment Canada results for diesel versus DEH are, therefore, not directly comparable.
Table 44 -
Diesel
vs. CNG Emissions on FTP Transient Cycle
|
Vehicle |
NOx + NMHC (g/bhp-h) |
PM (g/bhp-h) |
|
MY
2006 Cummins 6CEXH0505CAW Diesel |
2.8 |
.07 |
|
MY 2006 Cummins-Westport 6CEXH0505CBK CNG |
1.8 |
.01 |
|
CNG Emissions as % of Diesel |
64% |
14% |
Source: USEPA, 2006 Model Year Certificates of
Conformity
These numbers are generally consistent with the WMATA results.
The only report available on DEH buses on this cycle is based on the Environment Canada testing discussed in Section 3.4. The comparable data based on WMATA, Environment Canada, and the NREL study of 60-ft buses at KCMTA is also discussed in Section 3.4. Table 10 is reproduced here for comparative purposes. As noted previously, any comparison on this basis should be viewed as purely indicative.
Table 45 -
Emissions of DEH vs. Diesel Buses
|
Vehicle |
CO (g/mile) |
NOx (g/mile) |
Total
Hydrocarbons (g/mile) |
PM (g/mile) |
CO2 (g/mile) |
|
MY
2001 DDC
Series 50 With
EGR ULSD
fuel |
1.11 |
10.46 |
0.21 |
0.021 |
1737 |
|
MY 2002 New Flyer DE40LF Allison Transmission ULSD fuel |
0.16 |
11.06 |
.08 |
0.019 |
1337 |
|
Emissions as % of conventional Diesel |
14.4% |
105.74% |
36.59 |
88.1 |
77% |
|
MY 2004 Orion VII EGR equipped Cummins ISB ‘02 ULSD fuel |
0.1 |
7.98 |
.03 |
0.018 |
1589 |
|
Emissions as % of conventional Diesel |
9% |
76.33% |
14.63% |
85.71% |
91.5% |
Source:
Environment Canada
On a UDDS-type cycle, then, CNG compares favourably to diesel and DEH on a percentage basis. The favourable variance in NOx emissions will tilt considerably more heavily in favour of CNG in the 2007-2009 model years. A direct comparison of CO2 emissions is, however, not available at this time. As discussed above and in the NRC Report, the in-service performance of different technologies, and different manufacturers of the same technologies, can differ substantially depending on duty cycle. Other factors, including weather, bus specifications, exhaust after-treatment and even driving style, can have a significant impact on fuel economy and CO2 emissions.
Because the realization of the potential environmental benefits of CNG or DEH technologies is so dependent on duty cycle, it is not possible to conclude that one technology or the other will deliver superior results, or value for money, in the absence of more detailed analysis. The data presented in the NRC study and the economic analysis in this Report suggest that, on the lowest speed routes, DEH buses may provide significant environmental benefits and value for money relative to traditional diesel buses on the lowest speed routes in the City. There is insufficient data to conclude that 226, or 163, buses could be deployed in a way that would achieve superior environmental or economic benefits to the deployment of CNG buses.
7.2.2 Consistency with FERS
The analysis performed by City Staff and their consultants for FERS and FERS II was based on information available at the time and will not be revisited here. A few key points of note suggest, however, that in the 2007 to 2009 model years, the compatibility of CNG with FERS may be stronger than it was when FERS was developed and last evaluated. FERS clearly addresses both regulated emissions (NOx and PM) and non-regulated emissions (CO2). For the model years in question, CNG will have an advantage over diesel and DEH hybrids in both of these regulated emissions. It can be argued that both CNG and DEH will provide better performance than diesel with respect to CO2 emissions. How much better depends largely on duty cycle and there is insufficient information in the data available to sustain-ABILITYTM to reliably assess this issue without more detailed analysis. For the purpose of this evaluation, if the UDDS cycle is used, it is not clear whether DEH buses would, in fact, perform to their maximum potential, or better than CNG buses.
Diagram 20 - Fuel Road Map[149]

There are renewable fuel options available to both CNG and diesel pathways. As portrayed in the preceding diagram, Iveco believes the Natural Gas and Biogas pathways are viable and realistic fuel pathways. The biogas pathway could have the added benefit of reducing CH4 emissions, a stated priority of Ottawa’s 2020 Air Quality and Climate Change Management Plan. The biodiesel pathway can contribute to incremental CO2 reductions and address fuel lubricity issues arising from the adoption of ULSD fuel.
Finally, one of the stated long-term objectives of FERS is the implementation of infrastructure changes leading up to implementation of the long-term objective to utilize fuel cell buses. To do so, facilities and Staff will have to be equipped to deal with hydrogen and electric drives. While both CNG and DEH pathways contribute to the preparation for a zero emission/fuel cell future, the CNG and HCNG alternatives would move the City further along such a path.
8 Recommendations
8.1
Financial
Considerations
Over the anticipated 18-year life of the new buses the City of Ottawa intends to buy, conventional diesel buses would cost between $302 million (if deployed indiscriminately) and $373 million (if deployed on low-speed / frequent-stop routes). In that same timeframe, CNG buses deployed indiscriminately would cost $333 million and DEH buses $365 million (if deployed on low-speed / frequent-stop routes). These expenditures represent the total net discounted costs calculated by sustain-ABILITY™.
From a strictly financial viewpoint, the lowest cost option for the City of Ottawa in 2007 remains diesel buses[150].
If the City requires buses to operate on their lowest speed / most frequent-stop routes, then it may select DEH buses to perform that duty as long as these buses remain deployed on such routes for their entire lifespan. In doing so, the City may not benefit from substantial savings but will improve air quality and make a positive step towards a zero-emission fleet.
On the other hand, should the City require buses for average routes or rural ones, conventional diesel buses offer the cheapest alternative. Total disbursements for CNG buses on such routes is however smaller than the cost of deploying DEH buses on low-speed / frequent-stop routes and again, would improve air quality and make a positive step towards a zero-emission fleet.
The possibility and impact of procuring both the DEH and CNG buses should be investigated further. In this event, the cost of deploying each fleet out of a single garage would be less expensive and, ideally, CNG buses should be located in a new facility built to readily accommodate the later introduction of hydrogen-fuelled buses.
The City of Ottawa should be aware that several factors involving the adoption of either
new technology present a risk that the actual cost of implementation will be
different than that predicted by sustain-ABILITY™. The following table is presented as an advisory caution to
decision makers.
Table 46 -
Risk Factors Associated with Alternate
Bus Technologies Costs
|
|
Diesel Electric
Hybrid |
Compressed Natural Gas |
|
|
Traction Battery |
The nickel metal hydride batteries are “targeted”,
but not proven, for a 6-year life (replacement batteries are
≈$30K/bus). Currently under evaluation in Seattle. Others under
development. |
n/a |
|
|
After-treatment - 2007 |
The additional cost of a 2007 emissions compliant
bus is unknown at this time as are the cost of replacement components and the
volume of service and maintenance required. |
The current CWI natural gas engine is being
certified for 2007 and CWI are confident that it is certifiable for 2010, but
the cost is unknown. |
|
|
After-treatment - 2010 |
Additional engine modifications or after-treatment
for NOx will be required to meet 2010 emissions levels. There are
various possibilities (TIAX), but the method, cost and effectiveness in being
able to achieve 2010 emissions without performance and cost penalties are
unknown at this time. |
2007 model CNG engines from all manufacturers are
expected to be 2010 compliant and comparable to 2010 diesel costs (TIAX). |
|
|
Engine Technology Maturity |
Significant changes will be introduced in both
2007 and 2010 diesel engine and after-treatment technologies. |
The 2007 CNG engine will move to a more
“diesel-like” stoichiometric platform with three-way catalyst. This is a new
platform for CNG but the technologies are proven. By 2010, CNG will have had
three years in service. |
|
|
Fuel Cost |
The future cost of diesel is inherently uncertain. |
Clean Energy has offered a ten-year fixed price
contract. While post year ten price is uncertain, CNG can be bought on
long-term contracts and hedged in commodity markets. |
|
|
Fuel Efficiency |
Considerable
uncertainty over the effect of ECT after-treatment. Performance
against expectations will be duty cycle dependent. |
Claims
that fuel economy will be neutral or improved but no hard data available on
the fuel efficiency of the stoichiometric engine. Performance
against expectations will be duty cycle dependent. |
|
Source:
sustain-ABILITYTM, 2006
The introduction of DEH buses in the Ottawa fleet represents the least ”disruptive” scenario among those examined by sustain-ABILITY™ in the context of this study because infrastructural changes would be minimal. The use of electric drives in future generations of transit buses is almost certain and the experience gained from working with DEH buses would provide a lasting return on investment to the City.
The adoption of CNG buses, on the other hand, is a bolder step towards an eventual hydrogen fleet. It offers the advantage of the use of an abundant Canadian fuel source at a more predictable price in the future (at least for the next ten years) thereby sheltering the City from sharp increases in operating costs that may result from unpredictable oil prices.
The sustain-ABILITY™ Report contains limitations resulting from the scope of the mandate given to sustain-ABILITY™ and from the availability of data in some areas. These limitations
have an indeterminate impact on the level of precision of the quantitative and qualitative conclusions of the report.
The following recommendations aim at improving the level of precision of sustain-ABILITY™’s calculations and conclusions:
- Refine the comparative Diesel base (including data provided in the NRC Report) case for both technologies to ensure a fair comparison.
- Characterize Ottawa’s duty cycle with much more precision and focus on route by route characteristics and redo sustain-ABILITY™’s calculations on this basis. In this process, determine the limitations associated with the assignment of buses to Ottawa routes over the life of buses.
- Perform sensitivity analysis of the results and determine the impact of alternative scenarios relating to operation and maintenance costs. In particular, apply a ten-year @ 75,000km/year and remaining 6 years @ 35,000km/year hypothesis to DEH buses and the corresponding mileage variation for the appropriate duty cycle to CNG buses.
- Perform a detailed study of the impact of 2007 compliance on maintenance costs for DEH buses.
- Test MY 2007 CNG buses in-service in Ottawa assigning the vehicles to routes matching the same variety of duty cycles studied in the NRC Report. The test should be conducted at the same time of year as the DEH test and must include emissions testing as well as fuel consumption evaluations using the same methodologies as those used for DEH buses.
- Participate in testing of MY 2007 diesel and DEH platforms to assess the impact of technology changes.
- Conduct gas flow analysis on St-Laurent South and St-Laurent Station (at the very least) to ascertain facilities upgrade costs.
- Refine price forecasts for diesel and CNG fuels with particular emphasis on futures trading.
- Infrastructure costs for CNG have been calculated on a 20-year basis. Some of the assets can last longer than this. Equipment life span must be ascertained and calculations should reflect lifespan forecast impact on costs.
- Examine further the progress anticipated in the field of batteries (Idaho Lab Solid Lithium cells), electric Drives (TM4) and ECT (Detroit Diesel solution) for their expected dates of arrival on the market and their impact on cost models.
- Examine further the environmental impact of using batteries (disposal of NiMH batteries and impact on the environment).
- Consider the possibility of an outdoor fuelling station at St-Laurent in particular and measure the cost impact of such a change.
- Evaluate lifecycle GHG emissions for different fuels and bus platforms in the Ottawa context.
The preceding additional
recommendations represent a significant amount of work that may not be
justifiable. Decision makers should
therefore determine if the marginal precision that would result from the
implementation of these recommendations is worth the investment required given
the fact that 100% certainty cannot ever be gained and that there will always
be some risk associated with technology choices.
Limitations were imposed on the sustain-ABILITY™ investigation within the context of the current study regarding the operational methods used by the City of Ottawa and the management of the fleet. These limitations prohibited the optimisation of the operational context of the technologies being considered. Such limitations should be removed from further investigations to allow all factors to be considered in the revision of the business cases for both DEH and CNG buses. For example, the assignment of CNG buses to two garages should be reconsidered and the cost impact of the conclusions of such analysis should be factored into the sustain-ABILITY™ cost models.
The City of Ottawa can derive maximum benefit from the above recommendations by incorporating a long-term strategic plan into its considerations. Such a plan would entail the development of a roadmap (ten years or more) to a zero-emissions fleet in the overall context of public transportation in Ottawa. The selection of the optimal pathway would then be made within the parameters set in the roadmap. Procurement policies and infrastructure upgrading/addition would also be guided by such a long-term plan.
With respect to FERS and Ottawa's Air Quality and Climate Control Action Plan, the City’s priorities must determine how “success” will be measured for the implementation of whatever new technology is selected. sustain-ABILITY™ has identified a number of significant conflicts or trade-offs that need to be resolved or accommodated. i.e.: financial vs. environmental, short-term vs. long-term, pollution vs. GHGs, etc.
Moreover, a long-term plan must ascertain the coherence of planning and budgeting parameters with the long-term environmental objectives. New buildings and retrofits to current infrastructure should be planned and developed in a manner consistent with the long-term objective of using hydrogen and fuel cells (at a relatively low incremental cost) versus back-end loading significant retrofit costs.
Appendix A
Literature Review
Studies that included
emissions testing of CNG buses were performed by M.J. Bradley and Associates
for Massachusetts Bay Transportation Authority and Parsons Brinkerhoff for
Sound Transit. The methodologies used in these studies to collect and analyze
data and the level of detail in reporting raise significant questions about the
results and conclusions drawn.
M.J.
Bradley and Associates Study Prepared for the Massachusetts Bay Transportation
Authority
Concerns with the M.J.
Bradley study include:
·
The specifications of the buses and engines used provide
insufficient detail to assess the quality of comparison.
·
Different methodologies were used to test CNG buses vs.
diesel buses.
·
The diesel buses were run over entirely different cycles,
in-service on city streets, while all of the CNG buses were operated on a
‘closed course’ in a parking lot on simulated routes intended to roughly mimic
a Central Business District Duty Cycle.
·
The report concludes that the test cycles used were
sufficiently similar to be directly compared. Little data is provided to
support the comparability of data collected, though it is acknowledged that
there was significant variability from bus to bus due to different driving
styles of different drivers.
·
The average speed of one sample test route trace was 35%
lower than a central business district cycle and 56% lower than the UDDS cycle
agreed among the parties as the baseline for this evaluation and varied from
5.8 mph to 13.3 mph. This reflects more rapid acceleration to higher speeds,
generating more cycles over a shorter period of time – which would be expected
to increase emissions.
·
Test results exhibited an unusually high degree of
variability attributed to the use of different drivers.
·
Data was collected at different times of the year on CNG
and diesel buses (late fall / winter on diesel, spring on CNG -- HVAC use can
significantly influence results).
This study concluded
that emissions from emissions-controlled diesel were not materially different
from CNG buses.
It should be noted
that M.J. Bradley recently carried out similar tests for Translink in Vancouver
and concluded that over a
Translink duty cycle, a CNG bus will have higher NOx. The methodology and results of this study
have been challenged by Cummins-Westport on the basis that the NOx
emissions shown exceeded any data that they had on file at Cummins.
The Cummins/CWI concerns include:
· Compared to Cummins data, there was high degree of variability seen in the results from the field test. Even with the most aggressive acceleration test, NOx vs. CO2 test results in-lab do not exhibit the high variability compared to that measured in the Demonstration Project.
· Cummins Data also shows that CNG peak levels are near diesel levels with the average much lower than diesel levels.
· The variability and inconsistencies in the data are sufficient that scientifically no conclusions can be drawn from the data.
· The Test Cycle used (similar to that used in Boston) represented only a small portion of the actual fleet duty cycle.
· The CNG buses were re-powered and not configured as well as an OEM CNG (older electrical, 3 speed transmission etc).
Efforts under way include a comprehensive in-use data log of diesel and CNG buses to determine the engine operating characteristics on these routes with passenger loads during different parts of the day as compared to the test cycle used for emissions testing.
A second phase of testing (Fall 2006) will reflect the learning of first phase.
New CNG, Diesel, Diesel Hybrid, HCNG and Trolley buses will be involved vs. the mix of older diesel, re-powered CNG and Hybrid and new diesel included in the first phase. The mix of technology and driveline configurations was a challenge in Phase 1.
Test cycle for emissions testing will be evaluated and adapted to better reflect the actual duty cycle where technologies are best applied.
As discussed in Section 2.4.3 of the main report, the final report from this study has not been released and few details are expected to be available until it is released in November.
Hybrid Diesel Electric Bus Evaluation Prepared for
Sound Transit by Parsons Brinkerhoff Quade and Douglas, May 2005
This study was initiated by Sound Transit to identify operations and performance parameters such as fuel economy, tailpipe emissions, maintenance and operation cost and reliability of a newly acquired 40-ft diesel-electric hybrid bus. The agency’s objectives were to verify the perceived advantages of the hybrid-electric in terms of increased fuel economy and reduced tailpipe emissions. As part of this process, a comparison to other existing buses in the fleet was undertaken. The methodology utilized, however, could not be expected to yield a reliable data point as …
· The description of the non-hybrid buses is incomplete, so one cannot assess the comparability of the buses.
· The analysis comprised a sample of one hybrid and one CNG bus, so one could not assess if performance was typical.
· Different bus types and configurations were used, on different routes, by different transit agencies without detailed information on comparability of routes.
· The hybrid bus was run on three different fuels (ULSD, B20 and B40).
Whistler Alternative Fuel And Energy Technology Study, Prepared for:
Resort
Municipality of Whistler, Ministry of Water, Land and Air Protection, Methanex
Corporation, BC Transit, Whistler-Blackcomb Mountains
Prepared
by: Levelton Consultants Ltd.
This study was undertaken to support the development of an overall plan for the community that will reduce greenhouse gas and pollutant emissions from on-road and off-road motor vehicles in Whistler, with an initial focus on local vehicle fleets operated by the Resort Municipality of Whistler, Whistler Blackcomb Mountains and BC Transit. The study also included identification and analysis of emerging low-emission and zero-emission technologies that, by 2010, could be used to demonstrate technology leadership and sustainable transportation opportunities at the Vancouver 2010 Games.
The
background data used for the study was published literature available in early
2004 on the effects of alternative fuels and vehicles on pollutant
emissions. Such data does not fall
within the parameters of this study as it relates to older model technologies.
However, expected improvements in all technologies analysed was considered and
GHGenius was used to calculate the effects of fuel options on full cycle
greenhouse gas emissions making it the only study of its kind publicly
available. The “Levelton” study was therefore used as a baseline and reality
check on other data sources bearing in mind that the greenhouse gas analysis
was carried out in the Whistler/B.C. context and that some of the underlying
data on CNG technology was somewhat dated and data on hybrid technologies was
largely based on manufacturer claims vs. in-service data.
The
baseline on pollutant emissions from existing fleets was assessed using the
Canadian version of the US Environmental Protection Agency vehicle emissions
model released in 2003 (MOBILE6.2C), incorporating expected technical
improvements over time.
Comparative
Costs of 2010 Heavy-Duty Diesel and Natural Gas Technologies,
Final
Report to the
California Natural Gas Vehicle Partnership, South Coast Air Quality Management
District, Southern California Gas Company, July 15, 2005, Prepared by TIAX LLC
This report assesses the future lifecycle costs (LCC) of owning, operating and maintaining comparable emission diesel and natural gas heavy-duty engines for three heavy-duty applications. TIAX LLC estimated the LCCs for diesel and natural gas heavy-duty vehicles that meet the stringent 2010 EPA/CARB emission requirements. Applications analyzed were refuse haulers, transit buses, and short-haul trucks. The key findings of this report are highlighted below:
· The study shows that natural gas vehicles will be highly competitive with diesel LCCs when considering comparable vehicles that meet 2010 emission requirements.
· The modelled LCCs do not show a clear preference for one fuel choice over the other in the applications analyzed. This is a significant finding, given that 2004 buses equipped with diesel engines have a significant capital cost advantage over their natural gas counterparts.
· Post-2010, natural gas refuse haulers, transit buses, and short-haul trucks will have lower LCCs when oil prices are greater than $31 per barrel (2005$).
· Projections of diesel vehicle costs have a higher range of variation than natural gas vehicle (NGV) costs due to the uncertainty in the diesel engine technology and emissions control equipment needed to meet the performance demands of 2010 heavy-duty applications.
This report is used
primarily for its analysis of new technologies to be utilized to meet 2007 and
2010 requirements and to provide an additional source to the publicly-available
data and feedback from Southwest Research. The report itself is balanced and TIAX
is a reputable consulting firm, but its conclusions are considered in light of
its retainer contract with the Natural Gas Vehicle Partnership and Southern
California Gas (in addition to the South Coast Air Quality Management
District).
Appendix B
List of Responding Transit Systems
Canada
|
Company
/ Property |
Contact
Name |
Title |
|
City of Hamilton-HSR |
Doug Murray |
Manager, Transit fleet Maintenance |
|
Translink-Vancouver |
Dave Leicester |
Program Manager, Fleet Management |
|
Toronto Transit Commission (TTC) |
John Sepulus |
General manager - Engineering |
United States
|
Company
/ Property |
Contact
Name |
Title |
|
MARTA |
Brooks McAllister |
Director of Bus Maintenance |
|
Massachusetts Bay Transportation Authority (MBTA) |
Eric Scheier |
Project manager - Bus technology evaluation |
|
New York City Transit (NYCT) |
William P. Rilley Gary
LaBouff Steve Millar |
Chief officer of facilities - NYC buses R&D Mgr Bus operations CNG Manager - Gleason facility |
|
Pierce Transit
(Tacoma, Wash) |
Jay Rosapepe |
Maintenance Manager |
|
Sacramento RTD |
Ned Fox R. Ruiz Judy Engelman Admin.technician |
Dir. Bus Maintenance |
|
San Diego Transit |
Julio Ortiz Thomas De Luca |
Quality Assurance Mgr. Director of maintenance |
|
Valley Metro |
David Hyink |
Fleet and Facility Supervisor |
|
Washington Metropolitan Area |
Jack Requa
Sebastian Silvani |
Chief Operating Officer - Department of
Operations -- Bus Service Consultant |
Appendix C
Bibliography
|
Air Quality and Climate Change Management Plan, Air & Energy Initiatives, Environmental Management Division Planning and Growth Management Department, November 2004 |
|
Alternative Fuel Vehicle Program. A Fresh Look at CNG: A Comparison of Alternative Fuels. August 13 2001. |
|
American Public Transportation Association, Standard Bus Procurement Guidelines, 40 ft. Low Floor – CNG Technical Specifications, May 8, 2000 |
|
American Public Transportation Association. Bus Power Sources. 2006.<http://www.apta.com/research/stats/bus/buspower.cfm>. |
|
American Public Transportation Association. Revenue Vehicle Power Sources. 2006.<http://www.apta.com/research/stats/vehicles/vehpower.cfm>. |
|
Anonymous, Hybrids for Las Vegas BRT, Fleets & Fuels, volume XIII, Number 13, June 26, 2006 |
|
Anonymous, Transit Buses – Urban Duty Cycle, Heavy Vehicles, U.S. Climate Change Technology Program – Technology Options for the Near and Long Term, November 2003 |
|
Arvin Meritor Transfers World-Class Light Vehicle Emissions Technologies to Create Advanced Diesel Emissions Solutions for Commercial Vehicles |
|
BAE Systems, BAE HybriDrive Propulsion Overview, Orion VII Hybrid – Product Information (undated) |
|
Barnitt R., NREL, Case Study: Ebus Hybrid Electric Buses and Trolleys, Technical Report NREL/TP-540-38749, July 2006 |
|
Booz Allen Hamilton and M.J. Bradley & Associates, Bus Emissions Testing And New Technology Bus Evaluation, Report for the Massachusetts Bay Transportation Authority (MBTA), July 14, 2006 |
|
Booz Allen Hamilton and MJ Bradley & Associates, Bus Emissions Testing And New Technology Bus Evaluation An Analysis of MBTA’s Emission-Controlled Diesel Buses and CNG-Fuelled Buses, July 14, 2006 |
|
Bus Procurement, TTC Meeting, February 9 2005. |
|
California Air Resources Board, CARB’s Study of Emissions from In-Use CNG and Diesel Transit Buses, October 14. 2005 |
|
California ARB. "California ARB compares diesel and CNG bus emissions." DieselNet April 19 2002. <http://www.dieselnet/news/2002/04carb2.php>. |
|
California Environmental Protection Agency & CARB, CNG and Diesel Transit Bus Emission in Review, August 24, 2003 |
|
Canada’s Greenhouse Gas Inventory, 1990-2003, Environment Canada, http://www.ec.gc.ca/pdb/ghg/inventory_report/2003_report/c2_e.cfm#s2_2 |
|
Canadian Hydrogen Survey 2004-2005, Prepared for Natural Resources Canada by Dalcor Consultants Ltd, June 2005 |
|
CARB, CNG Emissions Need Study, June 2002 |
|
Chamberlain, Samuel and Modarres, Mohammad. "Compressed Natural Gas Bus Safety : A Quantitative Risk Assessment." Risk Analysis, Volume 25, Number 2, April 2005, pp. 377-387. <http://www.ingentaconnect.com/search/article?title=Compressed+Natural+ |
|
Chandler K., Battelle and K. Walkowicz National Renewable Energy Laboratory, King County Metro Transit Hybrid Articulated Buses: Interim Evaluation Results, Technical Report NREL/TP-540-39742 April 2006. |
|
Chandler K., Eberts E. and Eudy L. New York City Transit Hybrid and CNG Transit Buses: Final Evaluation results, National Renewable Energy Laboratory NREL/TP-540-40125, Colorado, November 2006. |
|
Chandler K., Eberts E. and Eudy L. New York City Transit Hybrid and CNG Transit Buses: Interim Evaluation results, National Renewable Energy Laboratory NREL/TP-540-38843, Colorado, January 2006. |
|
Chandler K., Eberts E. and Walkowicz, King County Metro Transit Hybrid Articulated Buses: Final Evaluation results, National Renewable Energy Laboratory NREL/TP-540-40585, Colorado, December 2006. |
|
Chandler K., Eberts E. and Walkowicz, King County Metro Transit Hybrid Articulated Buses: Interim Evaluation Results, National Renewable Energy Laboratory NREL/TP-540-39742, Colorado, April 2006 |
|
Chandler K., NREL, Ten Years of Compressed Natural Gas (CNG) Operations at SunLine Transit Agency, NREL/SR-540-39180, January 2006 |
|
Charmley – DOE, EPA Diesel Update (Diesel Engine Emission Reduction - DEER Conference), 2005 |
|
City of Ottawa Treasury Office, memo from Jean-Yves Carrier (City of Ottawa) to Pierre Ducharme (sustain-ABILITY™), Sept. 11, 2006 |
|
City of Ottawa, FERS, March 20, 2002 (Staff Report to Transportation and Transit Committee) |
|
City of Ottawa, Project Charter: Independent Evaluation of the CNG Option for Buses, March 16, 2006 |
|
City of Ottawa, Update On The Ethanol Blended Diesel Project, January 6, 2004 |
|
Clean Air Network, Clear Air Initiative: Info pool – CNG Buses (www.cleanairnet.org), May 24, 2006 |
|
Clean Cities, US DOE, Natural Gas Buses: Separating Myth from Fact, May 2000 |
|
Clean Diesel Requirements and Voluntary Initiatives, Francisco J. Acevedo, USEPA, presented to Indianapolis Heavy/Medium Duty Conference, August 9, 2005 |
|
CNG Consortium, City of Ottawa Transit Analysis, August 22, 2005. |
|
CNG Consortium, OC Transpo Business Case & Infrastructure Requirements, August 2005. |
|
CNG Consortium, OC Transpo Business Case (Pierce Transit), August 2005. |
|
Cole, James et al (Southwest Research Institute), Technologies to Meet 2010 HD Engine Emissions Standards Diesel and Gaseous Fuelled Engines, 2006 |
|
Consensus, Fuels of the Future, February 2006 |
|
Cummins Inc., 2007 Emissions: Choosing the Right Technology, March 22, 2004 |
|
Cummins Inc., Diesel Tech Table, July 2006 |
|
Cummins Westport Inc., Natural Gas Engine Technologies – Pathway for Hydrogen in Heavy-Duty Vehicles, July 22, 2003 |
|
Cummins Westport, Cummins Westport C Gas Plus in Transit – NA June 06.xls |
|
Cummins Westport, Every Alternative, August 16, 2005 |
|
Cummins-Westport Inc, Cummins-Westport LCC Model Overview, June 6, 2006 |
|
Cummins-Westport Inc., CWI Life Cycle Cost Model Assumptions, July 11, 2006 |
|
CWI Presentation to SEA, June 6 06.pdf |
|
DieselNet http://www.dieselnet.com/tech/dpf_sys_fuel.html, http://www.dieselforecast.com/ArticleDetails.php?articleID=164 |
|
DieselNet Technology Guide, SCR Systems for Mobile Engines, W. Addy Majeski, 2005.5, http://www.dieselnet.com/tech/cat_scr_mobile.html#intro |
|
DieselNet Technology Guide, What is Diesel Fuel? http://www.dieselnet.com/tech/fuel_diesel.html |
|
DOE / Energy Information Administration, Annual Energy Outlook 2006 With Projections to 2030, February 2006 |
|
Duffy, Kevin et al (Caterpillar Inc.), Heavy-duty HCCI Development Activities, http://www.cemamerica.com/doeevents/DEER/Presentations/Monday/TS1%20Advanced%20Combustion%20Technologies/2006_DEER_Duffy.pdf |
|
Emission Control: The Diesel Engine is Efficient but Generate Emissions, http://www.sttemtec.com/p1506/p1506_eng.php |
|
Enbridge, "Rate 110: Large Volume Load Factor Service", 2005, <http://www.egd.enbridge.com/LVRC/html/rate110.com>. |
|
Enbridge, Consensus Wholesale Energy Price Forecast, August 2006 |
|
Enbridge, Natural Gas : The Right Choice, OC Transpo Presentation (undated) |
|
Enbridge, Natural Gas : The Right Choice (undated) |
|
Enbridge, The Economics of CNG Buses versus Diesel Hybrid Buses, OC Transpo Assumptions, July 7 2005. |
|
Enbridge, The Natural Gas Alternative : CNG Buses, August 10, 2005 |
|
Enbridge. Natural Gas Transit - The Best Option for Ottawa Ratepayers: Transportation Committee Presentation. November 16 2005. |
|
Energy Information Administration, A Primer on Diesel Fuel Prices <http://www.eia.doe.gov/bookshelf/brochures/diesel/dieselprices2006.html> |
|
Energy Information Administration, Petroleum Navigator, Cushing, OK WTI Sport Price FOB, June 28, 2006 |
|
Energy Information Administration, Petroleum Navigator, New York Harbor No 2 Diesel Low Sulphur Sport Price FOB, June 28, 2006 |
|
Energy Information Administration, Short-Term Energy Outlook, August 8, 2006 < http://www.eia.doe.gov/emeu/steo/pub/contents.html> |
|
Environment Canada, Allison EP System Electric Hybrid Test Program |
|
Environment Canada, Evaluation of Biodiesel in Urban Transit Bus, 1995 |
|
Environment Canada, Orion VII Transit Bus Equipped with BAE SYSTEMS HybriDrive™ Propulsion System (MY2004): Emissions and Fuel Economy Test Report, September 2004 |
|
Environment Canada, SEPTA Conventional and Electric Hybrid Urban Bus Test Program Regulated and Unregulated Emissions, February 2004 |
|
EPA, Control of Air Pollution From New Motor Vehicles: Heavy-Duty Engine and Vehicle Standards and Highway Diesel Fuel Sulphur Control Requirements; Final Rule, January 18, 2001 |
|
Environmental Protection Agency, Integrated Engine and after-treatment Technology Roadmap for EPA 2010 Heavy-duty Emissions Regulations, from http://www.osti.gov/fcvt/deer2005/aneja.pdf |
|
Experiences of DHL Express Germany with Daily CNG delivery vehicles, Ing. Dario Salvati, IVECO Dipl.-Biol. Peter Sonnabend, Deutsche Post / DHLBESTUFS-II conference, Malta 19 May 2006 |
|
Flemish Institute for Technological Research (various authors), Influence of Vehicle Test Cycle Characteristics on Fuel Consumption and Emissions of City Buses, Study for the Society of Automotive Engineers, 2001 |
|
Francfort Jim, Idaho National Laboratory, US Department of Energy FreedomCAR & Vehicle Technologies Program, Advanced Vehicle Testing Activity, Real-World Research and Testing: Producing and Using Hydrogen in Transportation, HydroVision 2006 – The Hydrogen Economy |
|
Gas+Bus+Safety&title.html>. |
|
GLJ Petroleum Consultants Ltd., July 2006 Natural Gas Pricing Forecast Summary, http://www.gljpc.com/ |
|
GLJ Petroleum Consultants, Natural Gas and Sulphur Price Forecast, July 1, 2006 |
|
Gray Ron, Fleet Emission Reduction Strategy (update of original FERS), April 9, 2004 |
|
Gray, Ron, Enbridge Analysis (only using TTC data) - Diesel vs. CNG, September 7, 2005. |
|
Gray, Ron, Review of Enbridge LCC Analysis, Presented to City of Ottawa, August 10, 2005. |
|
Green Car Congress, Volvo Bus Nabs First Order for New Natural Gas/Biogas |
|
GVTA Board of Directors, GVTA Notice of Motion, February 28, 2006 |
|
Hadley, Jane. "Seattle Hybrid Bus Fuel Economy Less Than Expected." Seattle Post-Intelligencer, December 13, 2004 |
|
Hewitt, R.G. Natural Gas Option in Lieu of Diesel-Electric Hybrid Buses: Report to Transportation Committee. October 13 2005. |
|
Holmberg Eric, Coast Mountain Bus Company, Final Report: Natural Gas Bus Cost Tracking and Maintenance Monitoring Program, September 26, 2001 |
|
http://www.calstart.org/info/newsnotes/public/public_nn_detail.php?id=8537 |
|
http://www.cleanairfleets.org/altfuels.html |
|
http://www.delphi.com/news/pressReleases/pr39443-04122005 |
|
http://www.dieselnet.com/standards/cycles/ftp_trans.html |
|
http://www.greencarcongress.com/2006/05/delphis_onboard.html |
|
http://www.greencarcongress.com/2006/06/city_engines_in.html |
|
http://www.hydrogenhighway.ca/code/navigate.asp?Id=232 |
|
http://www.ottawa.ca/city_hall/mayor_council/mayor/initiatives/environment_en.html |
|
Hull D., Kerr C. and Spiler J. Conventional Transit Fleet Purchase: City of Hamilton. November 5 2004. |
|
Hull Don, Murray Doug, Serlkirk Mark, Embleton Liz, City of Hamilton, Conventional Transit Fleet Purchase (PW06092), Report presented to Mayor and Members Committee of the Whole, June 29, 2006 |
|
Hunt Richard, Technology Project Status Update, Clean Propulsion & Support Technology Committee Meeting, May 2005 |
|
Hydrogen Highway, Heavy-Duty Fuelling Station, <http://www.hydrogenhighway.ca/code/navigate.asp?Id=228> |
|
Hythane® for City Bus Operation, Owe Jonsson, SGC and Roland Nilsson, E.On Gas, December 5, 2005 |
|
Inertia Simulation of 33,000 Pounds & Diesel Oxidation Catalyst, January 2003 |
|
Institute of Transportation Studies, UC Davis & Collier Technologies Inc., Hydrogen Bus Technology Validation Program, 2005 |
|
Integrated Engine and after-treatment Technology Roadmap for EPA 2010 Heavy-duty Emissions Regulations, from http://www.osti.gov/fcvt/deer2005/aneja.pdf |
|
Lambda 1 Engine, September 5, 2005 |
|
Letter from Jamie Milner (Enbridge) to Richard Hewitt (City of Ottawa). September 29 2005. |
|
Levelton Consultants Ltd, Whistler Alternative Fuel and Energy Study, May 27, 2004 |
|
Levelton Consultants Ltd, Emission Reduction Options for Heavy-duty Diesel Fleet Vehicles in the Lower Fraser Valley. Final Report”, October 17, 2005. |
|
Lifecycle Costing Modelling, NRC Trial of City of Ottawa Hybrid Buses, Phase 2 Closure Report, August 2005 |
|
M.J. Bradley & Associates, Hybrid-Electric Drive Heavy-Duty Vehicle Testing Project, Report to Northeast Advanced Vehicle Consortium for DARPA, February 15, 2005 |
|
MARCON-DDM, Transforming the Future: Moving Toward Fuel Cell-Powered Fleets in Canadian Urban Transit Systems, Report prepared for Natural Resources Canada and BC Transit, February 2006 |
|
McCormick Rankin Corporation in association with Giffels, Richard Stevens Architect and Ecoplans Limited. Bus Facilities Requirements Study for Alternative Fuel Buses: Final Draft Report to Toronto Transit Commission, January 19 2005. |
|
Meeting Enbridge Gas/Clean Energy and City of Ottawa Fleet Services, 23-08-05 |
|
National Renewable Energy Laboratory, General Evaluation Plan: Fleet Test & Evaluation Projects, NREL/BR-540-32392, July 2002. |
|
National Renewable Energy Laboratory. Washington Metropolitan Area Transit Authority Natural Gas Bus Experience: 11th National Clean Cities Conference. Palm Springs, CA May 3 2005. |
|
Natural Gas Engine Development, Jeffrey Noonan-Day, Marketing/Product Manager Alt. Fuels August 3 2005 |
|
New Flyer, Natural Gas Product Specifications, <http://www.newflyer.com/index/natural_gas> |
|
New York City Transit Department of Buses, Comparison of Clean Diesel Buses to CNG Buses, DEER Conference 2003, August 23, 2003 |
|
Newsletter of the Natural Gas Transit Users Group, Dec 2004, http://www.cleanvehicle.org/committee/gas-transit/TugTidbits_2.pdf |
|
NGVAmerica, Frequently Asked Questions About Natural Gas Supply and Prices (undated) |
|
Northeast Advanced Vehicle Consortium, Analysis of Electric Drive Technologies for Transit Applications: Battery-Electric, Hybrid-Electric and Fuel Cells, Final Report for the Office of Research, Demonstration and Innovation, US Department of Transportation, Federal Transit Administration, August 2005 |
|
NREL, Development and Demonstration of Hydrogen and Compressed Natural Gas (H/CNG) Blend Transit Buses, Technical Report, NREL/TP-540-38707, November 2005 |
|
NREL, Emission Testing of Washington Metropolitan Area Transit Authority (WMATA) Natural Gas and Diesel Transit Buses, December 2005 |
|
NREL, Washington Metropolitan Area Transit Authority Natural Gas Bus Experience, 11th National Clean Cities Conference, May 3, 2005 |
|
NREL, Washington Metropolitan Area Transit Authority: Compressed Natural Gas Transit Bus Evaluation, NREL/TP-540-37626, April 2006 |
|
OC Transpo Fleet Services, CNG Un-solicited Proposal, Briefing Note: Mark III Version (undated). |
|
OC Transpo Fleet Services, Meeting Agenda: Enbridge Gas/Clean Energy and City of Ottawa, August 23, 2005. |
|
OC Transpo, Compressed Natural Gas (CNG) Buses Make Environmental and Business Sense for OCT Transpo, July 12 2005. |
|
OC Transpo, Information for City of Ottawa Transit Analysis, August 22, 2005 |
|
Ontario Ministry of Transportation, Ontario Transit Vehicle Program, 2004 Guidelines and Requirements, July 2004 |
|
Owens, Tom (Pierce Transit). Natural Gas Supply Review. June 2005. |
|
Parsons Brinkerhoff, Hybrid Diesel Electric Bus Evaluation, Prepared for Sound Transit, May 2005 |
|
Patten J.D., Hybrid Diesel Electric Bus Technology and Feasibility Study, Final Test Report, National Research Council Canada, Prepared for City of Ottawa, Technical Report CSTT-HVC-TR-093, August 22, 2005 |
|
Pierce Transit. Equipment Cost Summary. Jan. 1 2005 - September 30 2005. |
|
Plewes Sheri, Bus Procurement Update, presented to GVTA Board of Directors, February 20, 2006 |
|
Plewes Sheri, CNG Bus Procurement and Implementation Update, presented to GVTA Board of Directors, December 7, 2005 |
|
Plewes, Sheri. Bus Procurement Update: Presented to GTVA Board of Directors. February 20 2006. |
|
Pratt, Mitch, "Vancouver To Purchase 50 CNG Buses", NGV Communications, July 22, 2005, Volume 10, Edition 29. |
|
Presentation by Alex Bell for John Deere to the 2006 Diesel Engine Emission Reduction Conference |
|
Questions and Answers on Using a Diesel Oxidation Catalyst in Heavy-duty Trucks and Buses, EPA420-F-03-016, June 2003 |
|
Regulated and Speciated Emissions with Fuel Economy Results |
|
Report to Transportation and Transit Committee and Council, 20 March 2002, Submitted by: Kent Kirkpatrick, General Manager, Corporate Services Department |
|
Rosapepe, J.F. (Pierce Transit). 2006 Bus Procurement - Clean Diesel Engine Evaluation, July 11 2005. |
|
Rosapepe, Jay. Memo: Business Case For Clean Diesel Buses. June 17 2005. |
|
Rosapepe, Jay. Memo: Clean Diesel Follow-Up. August 1 2005. |
|
|
|
Sparks Companies Inc, Potential Biodiesel Use in the Nation’s School Bus Fleet, Report for the National Biodiesel Board in cooperation with the United Soybean Board, July 1995 |
|
Statistics Canada, Consumer Price Index, July 21, 2006-09-11 |
|
SunLine Transit Agency, Coachella Valley’s First Public Alternative Fuelling Station, <http://www.sunline.org/home/index.asp?page=119> |
|
SYPHER: MUELLER International Inc., BC Transit Fuel Choice Study, Submitted to Crown Corporation Secretariat, Province of British Columbia, April 1997 |
|
Technical Guides 2006, http://www.dieselnet.com/ |
|
The Delphi Group, Ontario Five Year Wholesale Power Price Forecast, October 2004 |
|
The Transition to Ultra-Low-Sulphur Diesel Fuel: Effects on Prices and Supply - Chapter 6. Mid-Term Analysis of ULSD Regulations, from http://www.eia.doe.gov/oiaf/servicerpt/ulsd/chapter6.html |
|
The Transition to Ultra-Low-Sulphur Diesel Fuel: Effects on Prices and Supply: May 2001, Energy Information Administration, Office of Integrated Analysis and Forecasting, U.S. Department of Energy |
|
TIAX LLC, The Transit Bus Niche Market for Alternative Fuels: Module 3: Overview of Compressed Natural Gas as a Transit Bus Fuel, Clean Cities Coordinator Toolkit, December 2003 |
|
TIAX LLC. Comparative Costs of 2010 Heavy-Duty Diesel and Natural Gas Technologies: Final Report to the California Natural Gas Partnership. June 7 2005. |
|
TIAX LLC and Global Insight, The Future of Heavy-Duty Powertrains: 2007 to 2020: An Overview. |
|
Toronto City Clerk, Procurement Authorization - Option to Purchase 250 40-Foot Low Floor Clean Diesel Buses from Orion Bus Industries, September 2003. |
|
TTC, TTC Problems with Diesel Particulate Filters (undated) |
|
UC Davis et al, Hydrogen Bus Technology Validation Program, Report for the California Air Resources Board, May 12, 2005 |
|
Ultra Low Sulphur On-road Diesel, Q&As, Canadian Petroleum Products Institute, http://www.cppi.ca/ULSD_Q_A_s.html |
|
University of Colorado at Boulder, News Release: First Commercial Biodiesel Pump in Colorado To Bring Cleaner Air, More Energy Independence, September 9, 2003 |
|
US DOE Advanced Combustion Engine Technologies, http://www.greencarcongress.com/2005/02/doe_cofunds_12_.html |
|
Vancouver Transit Agency, NGV Communications: Vancouver to Purchase 50 CNG Buses, July 22, 2005. |
|
Various authors for SAE, A Study of the Effects of Fuel Type and Emission Control Systems on Regulated Gaseous Emissions from Heavy-Duty Diesel Engines, 2004 |
|
Various authors for SAE, Performance and Durability Evaluation of Continuously Regenerating Particulate Filters on Diesel Powered Urban Buses at New York City Transit, 2001 |
|
Washington State University Extension Energy Program, Biodiesel (undated) |
|
Welch Alan, Westport Innovation Inc., Transition to Hydrogen with NGV Technology, Natural Gas Vehicle Technology Forum, August 2-4, 2005 |
|
Well-to-Wheels analysis of future automotive fuels and powertrains in the European context, A joint study by EUCAR / JRC / CONCAWE. Overview of Results. JEC WTW study version 2b 05/2006 |
|
Westport and Ford Announce Hydrogen Engine Technology Development, from http://www.westport.com/news/newsdetail.php?id=299 |
|
WestStart-CALSTART, Federal Transit Administration, The Case for Hybrids in Transit Buses: A Meta-Analysis and Literature Review, December 2005 |
|
WestStart-CALSTART, The Case for Hybrids in Transit Buses: A Meta-Analysis and Literature Review, Report for the DOT – Federal Transit Administration, December 2005 |
|
Witherspoon – CARB, Cleaning Up Diesel Engines (DEER Conference), 2005 |
|
World's First Full Hydraulic Hybrid in a Delivery Truck, EPA, EPA420-F-06-054, June 2006 |
|
Yantzis Jo-Ann, Clean Energy, CNG Fuelling Station and Fuelling Services Budget Estimate, OC Transpo Study, August 18, 2006 |
|
Yantzis Jo-Ann, Clean Energy, CNG Fuelling Station and Fuelling Services Budget Estimate, OC Transpo Study, August 25, 2006 |
Appendix D
Detailed Calculations
(See attached Xcel spreadsheet)
Appendix E
Acronyms and Abbreviations
|
A/C |
Air Conditioning |
|
B## |
“B” followed by a number where B indicates Biodiesel and the number (##) indicates the percentage of biological fuel within the diesel blend (B20 contains 20% biological fuel) |
|
bhp |
Brake Horsepower |
|
bhp-hr |
Brake Horsepower Hour |
|
BTU |
British Thermal Unit |
|
CA$ |
Canadian Dollars |
|
CARB |
California Air Resources Board |
|
CBD |
Central Business District |
|
CE |
Clean Energy Fuels |
|
CH4 |
Methane |
|
CNG |
Compressed Natural Gas |
|
CNGVA |
Compressed Natural Gas Vehicle Alliance |
|
CO |
Carbon Monoxide |
|
CO2 |
Carbon Dioxide |
|
CPI |
Consumer Price Index |
|
CSA |
Canadian Standards Association |
|
CWI |
Cummins Westport Inc. |
|
DEH |
Diesel-Electric Hybrid |
|
DLE |
Diesel Litre Equivalent |
|
DOC |
Diesel Oxidation Catalyst |
|
DPF |
Diesel Particulate Filters |
|
Dyno |
Dynamometer |
|
ECT |
Emission Control Technology |
|
EGR |
Exhaust Gas Recirculation |
|
EIA |
Energy Information Agency of the U.S. government |
|
EPA |
Environmental Protection Agency of the U.S. government |
|
FERS |
Fleet Emission Reduction Strategy |
|
FTA |
Federal Transit Agency of the U.S. government |
|
FTP |
Federal Test Procedure |
|
g |
Gram |
|
GHG |
Greenhouse Gas |
|
H2O |
Water |
|
HC |
Hydrocarbon |
|
HCCI |
Homogeneous Charge Compression Ignition |
|
HCNG |
A compressed blend of hydrogen and natural gas |
|
HD |
Heavy-duty |
|
HD FTP |
Federal Testing Procedure for Heavy-Duty Vehicles |
|
HP |
Horsepower |
|
HSR |
Hamilton Street Railway |
|
HVAC |
Heating, Air Conditioning and Ventilation |
|
IEA |
International Energy Agency |
|
KCMT |
King County Metro Transit |
|
Kg |
Kilogram |
|
Km |
Kilometre |
|
L |
Litre |
|
LCC |
Lifecycle cost |
|
LF |
Low Floor design for a bus |
|
LNT |
Lean NOx Trap |
|
LSD |
Low Sulphur Diesel |
|
MCR |
McCormick Rankin |
|
Mi |
Mile |
|
mmBTU |
Million British Thermal Unit |
|
mpg |
Miles per gallon |
|
MY |
Model Year |
|
N |
Nitrogen |
|
N2O |
Nitrous Oxide |
|
NAVC |
Northeast Advanced Vehicle Consortium |
|
NFI |
New Flyer Industries |
|
NFPA |
National Fire Prevention Agency of the U.S. government |
|
NG |
Natural Gas |
|
NH3 |
Ammonia |
|
NH4NO3 |
Ammonium Nitrate |
|
NiMH |
Nickel Metal Hydride |
|
NMHC |
Non-Methane Hydrocarbons |
|
NOx |
Nitrogen Oxides |
|
NPV |
Net Present Value |
|
NRC |
National Research Council |
|
NREL |
National Renewable Energy Laboratory of the U.S. government |
|
NYC |
New York City |
|
NYCTA |
New York City Transit Authority |
|
O |
Oxygen |
|
O&M |
Operations and Maintenance |
|
OBC |
Ontario Building Code |
|
PM |
Exhaust Particulate Matter |
|
PST |
Provincial Sales Tax |
|
Q# |
Refers to the quarter of any given year. Q1 2007, for example, is the first quarter of year 2007 |
|
scfm |
Standard Cubic Feet per Minute |
|
SCR |
Selective Catalytic Reduction |
|
SOx |
Sulphurous Oxides |
|
STM |
Société des transports de
Montréal |
|
SwRI |
Southwest Research Institute |
|
TTC |
Toronto Transit Commission |
|
TWC |
Three-way-catalyst |
|
UC |
University of California |
|
UDDS |
Urban Dynamometer Driving Schedule |
|
US$ |
United States of America Dollar |
|
USDE |
United States Department of Energy |
|
USLD |
Ultra Low Sulphur Diesel |
|
VOC |
Volatile Organic Compound |
|
WMATA |
Washington Metropolitan Area Transit Authority |
Appendix F
About the Authors
sustain-ABILITY™ is comprised of four professional services firms. The resources of only two will be required to conduct this assignment:
|
|
|
|
|
|

MARCON Management Consultants Inc. (MARCON-DDM) is an integrated management-consulting firm regrouping the services of 30 professionals. It offers a broad range of marketing, research and management services from consulting to turnkey management of projects that promote the success of its Clients. A well-diversified staff provides expertise to service the needs of clients operating in a wide array of sectors.
Several professionals with hands-on executive experience in the Urban Transit Industry form the basis of MARCON-DDM’s Transit System Practice. In recent years, this team has completed four large assignments and currently continues to serve the Industry in several others.
MARCON-DDM’s experience in leading large and complex mandates has been well established over the last 20 years. MARCON-DDM’s Clients, generally in the Business-to-Business area, operate in a wide range of industries including energy, transportation, pulp and paper, telecommunications, mining, financial services, recreational products and heavy equipment manufacturing.
Sustainable Energy Associates is a leading technical and management-consulting firm specialized in sustainable energy technologies. Its business and engineering professionals have been leaders in the alternative energy industry for more than a decade. Over the past decade, principals have worked with many of the leading technology companies in the alternative energy sector and have advised government, academia and the private sector. Team members have worked with the Gas Technology Institute, suppliers of components and subsystems for natural gas fuelling stations, and suppliers of components and subsystems for hydrogen energy applications including a variety of feedstocks including natural gas, propane, ethanol, water and biomass. The company’s work has included policy development, new product development, codes and standards development, market development for new technologies, procurement, system integration and project management for the deployment of sustainable energy technologies, and advice to the investment community on alternative energy investments.
The project team from sustain-ABILITY™ for this project was composed of:

For further information on this report, please contact:
Ken Wetzel, City Project Manager and Manager of Technical Services, City of Ottawa (613) 842-3636 ext. 2602
Pierre Ducharme,
MARCON-DDM, (514) 393-1378 ext. 266 or pducharme@marcon.qc.ca
Catherine Kargas, MARCON-DDM, (514) 393-1378 ext. 260 or ckargas@marcon.qc.ca
William Bugyra, Sustainable Energy Associates, (416) 588-9107 or wbugyra@seai.ca
David Martin, Sustainable Energy Associates, (416) 588-9107 or dmartin@seai.ca