Report to/Rapport au :
Planning and Environment Committee
Comité de l'urbanisme et de l'environnement
and Council / et au Conseil
Submitted
by/Soumis par : Nancy Schepers, Deputy City Manager
Directrice municipale adjointe,
Infrastructure Services and Community
Sustainability
Services d’infrastructure et
Viabilité des collectivités
Contact
Person/Personne-ressource : Carol Christensen, Manager/Gestionnaire,
Environmental Sustainability/Durabilité de l’environnement, Community and
Sustainability Services/Services de viabilité et des collectivités
(613)
580-2424 x21610, Carol.Christensen@ottawa.ca
SUBJECT:
|
RESULTS OF THE NATIONAL CAPITAL AIR
QUALITY MAPPING PILOT PROJECT |
|
|
|
OBJET :
|
RÉSULTATS
DU PROJET PILOTE DE CARTOGRAPHIE DE LA QUALITÉ DE L'AIR DE LA CAPITALE
NATIONALE |
REPORT
RECOMMENDATION
That the
Planning and Environment Committee recommend that Council:
1.
Receive the results of the
National Capital Air Quality Mapping Project as detailed in this report; and
2.
Direct staff to report back on
the results of the air quality monitoring program in one year.
RECOMMANDATION DU RAPPORT
Que le Comité de
l’urbanisme et de l’environnement recommande au Conseil :
1.
de prendre connaissance des
résultats du Projet de cartographie de la qualité de l’air de la capitale
nationale décrits dans le présent rapport;
2.
de donner instruction au personnel
de faire rapport dans un an sur les résultats du programme de contrôle de la
qualité de l’air.
BACKGROUND
Increasing the City’s air quality monitoring capacity was one aspect of the “Air Quality and Climate Change Management Plan” (ACS2004-DEV-POL-0063) approved by Council in January 2005. At the time, Ottawa had a single monitoring station that served as basis for smog warnings and for generating baseline information for studies and Environmental Assessments. The need to improve monitoring and look at more localized influences and conditions has led the Environmental Commissioner of Ontario to state that current air quality monitoring “fosters a false sense of security” particularly in urban environments. The Ontario Ministry of the Environment air quality index is based on regional monitoring which does not take into account local influences. The National Capital Air Quality Mapping Pilot Project begins to address this concern.
In February 2007 the City submitted a proposal to GeoConnections (a Natural Resources Canada Program) to map the air quality of the National Capital region using satellite data as well as ground base data collected using mobile units across the Capital region. Data was collected from the cities of Gatineau and Ottawa. Air quality monitoring began July 1, 2007 and continued for one year. Data integration then took place over the three months following, refining the hourly maps and analyzing the data.
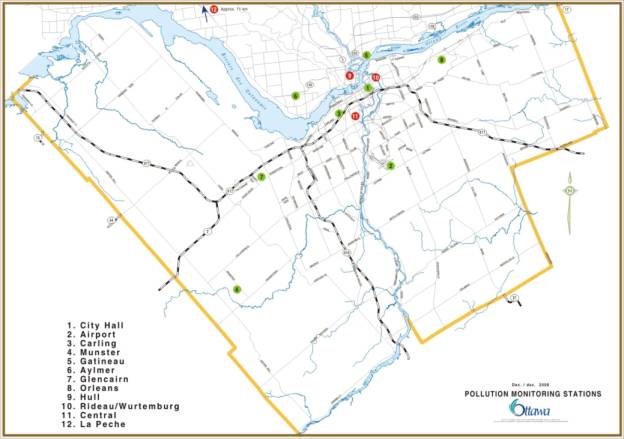
Information used to generate the maps included data from the National Air Pollution Surveillance network (four sites), rotating mobile monitoring units set up at eight sites, satellite data, local meteorology, geographic characteristics and air as well as ground transportation data. The criterion for monitor placement included technical considerations namely availability of electrical services and adequate security from tampering. A-MAPS Environmental Inc. was retained by the City of Ottawa to integrate the data and, using air quality dispersion models, refine the satellite map resolution to one kilometre, about 15 city blocks.
Additional data was collected using 90 passive air quality samplers. The sampling locations, 30 in total, were determined with the expert advice of Health Canada on areas of vulnerable populations using higher concentration of children under five and people over 60 years of age. Sampling took place once a season in the fall, winter and spring. Although these data were not used directly by the mapping project, it provides important information and is being used by the University of Ottawa in a study to assess potential health risks of air pollution impacts at the neighbourhood level.
Figure 1: Air Monitoring Locations (permanent monitors or mobile units) used in the mapping project.
The pollutants mapped on an hourly basis were:
|
Pollutant name |
Acronym |
Health effect |
|
Nitrogen dioxide |
NO2 |
Irritant gases that can be transformed into particulate matter, ground level ozone causing smog as well as contribute to acid rain |
|
Nitric oxide |
NO |
|
|
Nitrogen Oxides |
||
|
Carbon monoxide |
CO |
Highly toxic gas to the central nervous system and the heart |
|
Ozone |
O3 |
Irritant gas capable of reducing lung capacity and aggravating Asthma |
|
Particulate matter smaller than 2.5 microns |
PM2.5 |
It is linked to altered lung function and heart disease |
The project was lead by the Air and Energy team of the Environmental Sustainability Division of the Community Sustainability Department and had a wide range of partners:
· Transport Canada provided its mobile lab for a full year, which rotated among eight sites in the Ottawa/Gatineau area (see map Figure 1);
· Environment Canada participated for five weeks by providing a mobile lab and contributed further by analyzing 90 passive samplers;
· Ontario Ministry of the Environment sent two mobile labs for a total of 32 weeks;
· Ottawa International Airport provided air traffic data and financially supported the purchase of a roadside monitor (Airpointer);
· Health Canada, Ministère du Développement durable, de l'Environnement et des Parcs – Quebec, Pollution Probe and the New Brunswick Lung Association provided in-kind contribution and advice.
A total of 8760 maps were produced for each of the six pollutants over the one year of monitoring (365 days x 24 hours).
DISCUSSION
The maps and
data collected as part of the pilot project confirmed many already known facts
about our air quality, provided new insight into when and where we experience
air quality problems, and identified areas of potential concern that need to be
looked into in greater detail.
Summary of results
During the year of monitoring, air pollutants in the National Capital region were found to be below the Canada Wide Standards (CWS – as set by the Canadian Council of Environment Ministers) 95 per cent of the time and 86 per cent of the time under the more stringent World Health Organization (WHO) standards. Most of the time, our air quality is within the limits as established by these standards.
Standards |
Canada Wide
|
WHO
|
|
Nitrogen dioxide (parts per billion) |
200 |
79 |
|
Ozone (ppb) |
65 |
50 |
|
Particulate matter < 2.5 µ (micrograms per m3) |
30 |
25 |
|
Carbon monoxide (ppb) |
0.013 |
0.009 |
- Air pollution in the National Capital region is both produced locally and the result of trans-boundary pollution coming from the Ohio Valley, southern Ontario, and Montreal.
- Precipitation improves air quality by literally removing suspended pollution out of the air. The year of this pilot project, regular precipitation in both rain and snow improved air quality. During this time frame, there was only one smog event reported by the MOE, lasting a total of six hours. In years with few precipitation events, the National Capital Region has experienced up to 14 smog events.
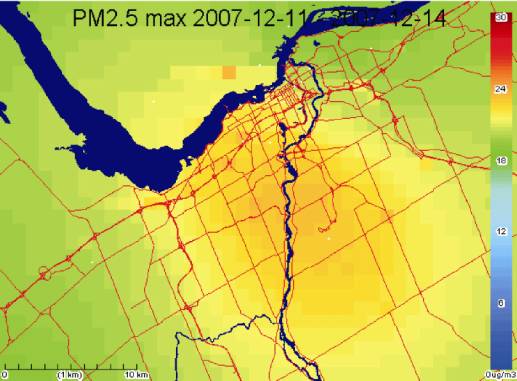
- When poor air quality occurs, it is not restricted to hot summer days. On December 13 and 14, 2007 there was a poor air quality episode (breaching standards) that lasted several hours, mainly due to particulate matter. This occurrence had primarily a local source with partial east trans-boundary pollution. The combination of wood burning with the geographical valley characteristics of the region may have contributed to its cause. In Montreal, 27 per cent of the PM2.5 is the result of residential wood combustion, all sources included (NPRI, 2006).
- Our major roadways and intersections do experience localized air quality readings that exceed standards under certain meteorological conditions (i.e. calm days, and more frequently during morning peak hours).
- There is a slight west to east pollution gradient (one per cent) for most air pollutants in our region, with the eastern part of the region showing slightly higher pollutant concentrations. Ozone, nitrogen oxides and carbon monoxide show a definite west-east pattern. This can be explained by the prevailing winds coming from the west that push the nitrogen oxides and carbon monoxide generated from transportation towards the east. These pollutants contribute to higher ozone formation in that area. The result is one per cent elevated levels of air pollution in the eastern areas than the western portion of the region.
- Incidents of elevated particulate matter are more frequent in downtown Ottawa. In one extreme case, the concentration reached three times the Canada Wide Standard. Figure 2 shows maximum emissions of PM2.5 for the month of December, which were within the Canada-wide Standards.
- The worst episodes observed during the year of monitoring were due to PM2.5 and had three origins:
· from the east, which seems to have its origins in Montreal, on September 14, 2007.
· from the south, the Ohio Valley on September 21 and September 25, 2007. The Ohio Valley has a number of coal generation stations that contribute to poor air quality.
· locally produced and concentrated due to lack of air movement on December 13, 2007. During that time the sky was clear, surface temperature was very cold and wind was light, the perfect condition for an inversion, which caused the concentration of pollution in the downtown core.
Figure 2. - Particulate matter maximum levels for the month of December 2007
(within the Canada-wide Standards).
- Specific pollutants were found to be higher in different locations in the study region, most often associated with concentrations of traffic:
|
Pollutants of Concern |
National Capital Findings |
|
· PM2.5 levels are higher in the downtown core areas of Ottawa and Hull than any other place (with 23 episodes above 30 ug/m3 the hourly Canada Wide Standard). |
|
|
Nitrogen dioxide (NO2) |
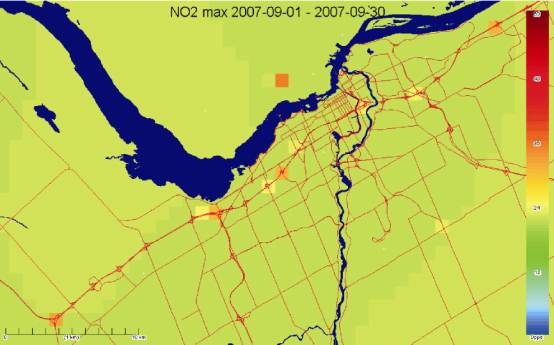
· Although the levels seldom reach the 1-hour Canada Wide Standard of 200 ppb (parts per billion) this pollutant contributes to the formation of ground level ozone that affects air quality in the suburbs particularly in the east. · NO2 is most pronounced along the 417 approaching downtown and within the downtown core of Ottawa (see map Fig. 3). · The highest concentrations of NO2 are found at the split of highway 417 & Regional Road 174 and at major interchanges to the 417. |
|
Ground-level ozone (O3) |
· Higher in the suburbs than the downtown core, especially in the early evening timeframe. |
|
Carbon monoxide (CO) |
· Not a pollutant of concern in our region. |
Figure 3. Nitrogen dioxide- maximum levels recorded for the month of September 2007. Areas of elevated concentrations (although still generally below standards) are represented by orange squares and were found close to major intersections.
Interpreting the Results
The main objective of these maps is to better understand the air quality in our region and to serve as a tool to develop policy in order to protect public health. The maps help identify where the higher concentrations of air pollutants are located and how the locations change according to the season and other meteorological factors. Using the tabular data, one can determine the number of times an area was in breach of air quality standards.
A single year of observation is not enough to make definite conclusions about the extent of areas of higher concentration of pollutants (also referred to in air quality studies as ‘hot spots’) particularly when the year in question had higher amounts of precipitation, which washed pollutants. More observations are required to fully understand and work with the air quality data.
While the City’s air quality is within Canadian and World Health standards most of the time, it is also important to continue to monitor to recognize trends and deal with emerging concerns early. As noted by the World Health Organization, “air quality standards do not protect health” and the Canadian Council of Environment Ministers encourages “continuous improvement” in air quality management.
Over the long term, climate change may also affect air quality. For instance, air quality would improve if regular precipitation continues to occur. On the other hand, higher temperatures may have a negative effect by increasing the release of volatile organic compounds, which like nitrogen oxides, are ozone precursors leading to more smog events. Therefore it is important that the City continue monitoring to respond effectively to the threats of climate change and air pollution and adapt City programs accordingly.
Activities
in Other Municipalities
Cities all around the world are increasingly taking responsibility for monitoring their urban air quality. In Canada, Vancouver has a network of 24 monitors, Montreal 17, Halton 3, and Hamilton uses mobile monitors to assess hot spots. In England, the City of York has 33 roadside monitors for an area of 272 km2 and one quarter of Ottawa’s population. Santa Barbara County in California has a network of 17 monitors. Roadside monitors are becoming the norm. The MOE has recently acquired two mobile air monitors, similar to the one purchased for this project.
Cities such as Vancouver, Montreal, Stuttgart (Germany) and others are using the data from their monitoring networks to assess the impact of air quality on community health. Examples of applications include:
· Determining the spatial and temporal patterns of air pollutants (Stuttgart maps streets and zones that show exceedances of limit values)
· Determining and/or quantifying source or source-sector contributions to levels of air pollutants associated with human health risks and visibility degradation, including trans-boundary contributions
· Providing timely information to the public about current air quality and raising public awareness (e.g. air quality health indices and air quality advisories)
· Measuring changes in air quality resulting from the implementation of management actions
· Supporting programs to evaluate and report on visibility improvement policies
· Measuring compliance with standards/objectives (e.g. Canada-Wide Standards, including Continuous Improvement and Keeping Clean Areas Clean, Metro Vancouver objectives, etc.).
· Supporting regulatory functions, including environmental impact assessments
· Responding to local air quality monitoring needs and requests for short-term studies and local air quality plans, and
· Providing data to support the application of air quality forecast and air quality planning models
Ultimately, municipalities are using the data to develop response and mitigation programs designed to reduce air pollutants. Some concrete examples include the upgrading of bus fleets with cleaner vehicles, and programs encouraging the use of bicycles and walking. Paris has a fleet of bicycles that are provided to tourists for their use. Some cities go beyond educating their citizens on air quality issues and are using congestion charges to discourage driving into downtown core areas. The latter example is happening in cities such as London (UK), Manchester (UK), Durham City (UK); Singapore; Stockholm (Sweden); Trondheim (Norway).
Canadian municipalities are using local air quality data to support a variety of different programs. In Toronto, air quality data was used by the Medical Officer of Health to develop an Environmental Reporting, Disclosure and Innovation Program. This recently approved by-law, often referred to as “community right-to-know,” will capture important information on priority toxic substances from small and medium size businesses. Although emissions may be modest, the long-term cumulative exposure to chemicals from many facilities in close proximity to where people live is of concern. Besides publicly identifying the sources of pollution, the program is intended to motivate businesses to adopt more stringent pollution prevention measures.
Local Air Quality Management in Europe has more specific goals. The promotion of air quality monitoring at street level is more accepted. Monitoring focuses on locations where experience has shown that objectives related to nitrogen oxides and/or PM2.5 may be exceeded. During breach periods, cities use this information to restrict traffic on those roads.
With this pilot project, Ottawa not only joins other major Canadian cities in collecting data on local air quality, but also leads others in the use of remote sensing using satellite data to measure local air quality.
How can the City use these data?
The information gathered from this project and its continuation into 2009 will provide the City with key information for planning and policy development.
From a public health perspective, the recently updated Public Health Standards of Ontario (2008) places greater emphasis on the need to develop community-wide policies and increase public awareness of health risks associated with outdoor air quality. The Ontario Medical Association (2008) estimated that air pollution is responsible for 503 acute premature deaths each year in the City of Ottawa. The renewed direction from the Ontario Ministry of Health directs Health Units to develop local communications strategies and assist community partners to develop healthy polices related to reducing exposure to poor outdoor air quality. The goal is to prevent and reduce the burden of illness from health hazards in the physical environment, specifically around outdoor air quality.
Additional data and understanding could be used to improve public health warnings, to personalize the warnings to vulnerable populations, and use the maps for public education about health related issues. Areas prone to ozone formation could receive an early warning system so that activities that are not suitable for those conditions can be avoided depending on personal vulnerabilities. Providing a mapping service for the City would work in similar fashion to the MOE province-wide computerized warning system for areas prone to high-risk pollution concentrations such as major roadways, the downtown core, the east side of both the city of Ottawa and Gatineau.
The information also provides evidence to support the City’s sustainability objectives on an ongoing basis. It also assists in addressing the Solid Waste and Environment Priority in the City Strategic Plan, which includes reducing greenhouse gas emissions (Objective 3). Current directions and initiatives such as the Transportation Master Plan, Transportation Demand Management, and the Official Plan are all designed in part to address air quality issues, particularly those related to transportation. Compact mixed-use development to reduce the need for travel, promotion of walking, cycling and transit use, and an expanded rapid transit system are all critical measures to reduce emissions and deal with the primary sources of air pollutants in Ottawa. Other examples of how the City is reducing air pollution are the Eco-driving policy aimed at the efficient use of City vehicles; the purchase of 177 hybrid busses; the initiation of a wood-burning education program and the anti-idling bylaw. The Fleet Emission Reduction Strategy deals in greater detail with options the City has to improve air quality. At the community level the Transportation Demand Management Strategy is aimed at the promotion of public transit as well as walking and cycling.
Over time, the data collected from monitoring could also provide an additional tool for community design and planning by better understanding the dynamics of air quality in relationship to land use and location of uses that may be more vulnerable to elevated levels of pollutants (e.g. outdoor sports complexes, facilities for vulnerable populations such as seniors and children)
With respect to transportation planning, it has been a concern when the air quality components of environmental assessments were based on one single monitoring site. Data from this project would provide more complete information by serving as the baseline against which emission reduction policies could be measured and transportation environmental assessments performed.
This project was important not only for the City. It also provides data and support for partners and additional research that will help develop a more complete understanding of air quality. Health Canada has started a pilot project in Ottawa to test a new methodology for gathering spatial air pollution data. For this purpose, it set up 50 temporary samplers across the city during the fall of 2008 and again in the spring of 2009 to measure similar air pollutants plus volatile organic compounds (VOC), sulphur dioxide (SO2) and polycyclic aromatic hydrocarbons (PAHs). A new partner, the European Space Agency is using data collected in this project for additional research on the viability of using remote sensing to develop urban air pollution and health risk assessment.
Next Steps
The following steps over the next 18 months will build on the pilot project results, contribute to gathering new data to investigate air quality in our region, and respond to the EAC motion of March 12, 2009. Specifically, the following activities are involved in the next stage of the air quality program:
- Monitoring will continue using the roadside monitor purchased as part of this project, on a priority basis or as needed to provide data to activities such as environmental assessments. Satellite data and modeling of ground source data will continue into 2009 with existing contracts and monitors.
- Monitoring of three main pollutants (nitrogen oxides, ozone and particulate matter) will be the focus of future data collection. Concentrations of nitrogen oxide are often higher where traffic is slow moving with stop/start driving, and where buildings on either side reduce dispersion. PM2.5 is of concern in the downtown core of Ottawa. Ground level ozone is an integral part of the new Air Quality Health Index.
- Acquisition of a second roadside monitor will increase monitoring capability and is crucial to the health risk assessment study currently under way.
- Making the data available to the public via the www.ottawa.ca website.
Overall, the sustainability path that the city is already embarked on will help maintain and improve air quality in the region.
CONSULTATION
The study results have been provided to the Environmental Advisory Committee (EAC) for their information. On the March 12, 2009 meeting the EAC passed the following resolution:
Be it
resolved that the EAC recommend that Council direct the necessary funding and
staff resources to continue the Satellite Air Quality Mapping project augmented
by additional monitors to monitor health risks near heavy traffic;
Be it further resolved that the EAC recommends
Council direct the Medical Officer of Health to report back to Council, in one
year, on the health impacts of air pollution in areas with heavy traffic, in the
City of Ottawa.
Be it also resolved that an official request be
made by the City of Ottawa to the Ontario Ministry of Environment at the
appropriate level so that the public can access satellite air quality maps via
the Internet;
The results have been presented to the funding agency, GeoConnections and they are satisfied that the pilot satellite monitoring and modeling used in this project conform with the science of air quality monitoring in Canada.
Ottawa Public Health staff participated in this study as a partner and encourage further collection of data to enhance the findings of this pilot study. The collection of street-level air quality information will provide policy makers with data to inform community decisions and ensure the development of healthy communities.
LEGAL/RISK MANAGEMENT IMPLICATIONS:
There are no Legal/Risk Management implications associated with this report.
FINANCIAL IMPLICATIONS
Financial resources required to continue the work through 2009 as noted in this report are available in capital account 902560 – Environmental Management.
DISPOSITION
Air and Energy staff from Environmental Sustainability Division will lead the work of monitoring air quality at ground level and managing the contractor doing the satellite data integration for the European Space Agency health risk assessment. All this work will be done in close cooperation with the Environmental and Health Protection Division of Public Health.