|
5. UPDATE ON THE NATIONAL CAPITAL REGION AIR QUALITY MAPPING PROJECT HAZARDOUS |
Committee recommendationS
That Council:
1. Receive the results of the 2009 satellite and ground monitoring air quality results for the National Capital Region; and
2. Direct staff to report back on the results of the air quality monitoring program in one year, including options for establishment of a permanent program.
RECOMMANDATIONS DU COMITÉ
Que le Conseil :
1. prenne connaissance des résultats de 2009 du contrôle par satellite et au sol de la qualité de l’air de la région de la capitale nationale; et
2. charge le personnel de faire un rapport sur les résultats du programme de contrôle de la qualité de l’air, comprenant les choix qui se présentent pour la mise en place d’un programme permanent.
Documentation
1. Deputy City Manager’s report, Infrastructure Services and Community Sustainability, dated 9 September 2010 (ACS2010-ICS-CSS-0017)
Report to/Rapport au :
Planning and Environment Committee
Comité de l'urbanisme et de l'environnement
and Council / et au Conseil
09 September 2010 / le 09 septembre 2010
Submitted by/Soumis par : Nancy Schepers, Deputy City Manager
Directrice municipale adjointe, Infrastructure Services and Community Sustainability
Services d’infrastructure et Viabilité des collectivités
Contact Person/Personne-ressource : David Miller, Manager/Gestionnaire, Environmental Sustainability/Durabilité de l’environnement, Community and Sustainability Services/Services de viabilité et des collectivités
(613) 580-2424 x21447, David.Miller@ottawa.ca
SUBJECT: |
UPDATE ON THE NATIONAL CAPITAL REGION AIR QUALITY MAPPING PROJECT |
|
|
|
OBJET : |
Mise à jour sur le projet de cartographie de la qualité de l’air de la région de la capitale nationale |
REPORT RECOMMENDATION
That the Planning and Environment Committee recommend that Council:
3. Receive the results of the 2009 satellite and ground monitoring air quality results for the National Capital Region; and
4. Direct staff to report back on the results of the air quality monitoring program in one year, including options for establishment of a permanent program.
RECOMMANDATION DU RAPPORT
Que le Comité de l’urbanisme et de l’environnement recommande au Conseil :
3. de prendre connaissance des résultats de 2009 du contrôle par satellite et au sol de la qualité de l’air de la région de la capitale nationale; et
4. de charger le personnel de faire un rapport sur les résultats du programme de contrôle de la qualité de l’air, comprenant les choix qui se présentent pour la mise en place d’un programme permanent.
BACKGROUND
Urban air pollution monitoring has been recognized as pivotal to urban health[1],[2]. Ottawa’s air monitoring pilot provides local benchmark information that is not provided by the provincial regional monitoring stations.
Monitoring air quality is valued for several reasons:
- To describe the state of the air environment and its changes;
- To evaluate or analyze the state of the air environment and its changes over time; and
- To allow action to be taken to avoid degradation of the air environment.
In 2008-09 two of the City’s roadside monitors were used to calibrate the ESA-sponsored project, one at Carling Avenue and Ana Street, and the other at King Edward Avenue and George Street.
DISCUSSION
Findings of air quality monitoring in Ottawa/Gatineau for 2008-9
Results from the 2008-2009 monitoring period were very similar to the initial year of the pilot program as described in report ACS2009-ICS-CSS-0015. Evaluation of the data collected revealed the following characteristics about the air quality in our region during this time period:
· There was only one air pollution event when the maximum level of nitrogen dioxide (NO2) was reached. Along heavy transportation corridors, such as Hwy 417, levels above desirable NO2were only occasionally observed;
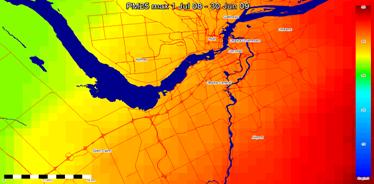
· Levels of fine particulate matter (PM2.5) surpassed the Canadian standard during one episode of poor air quality. These results showed similar patterns to the previous year with elevated pollutant readings most often associated with areas of heavy traffic convergence and meteorological conditions with little air movement to disperse pollutants;
· An analysis of the data and mapping during the second year of air monitoring also found a decrease in the pollution accumulation in the east side of the air shed; and
· Similar to the previous year, events of heavy pollution started in the east and moved towards the west as seen in Figure 1.
|
Figure 1. Maximum PM2.5 |
|
|
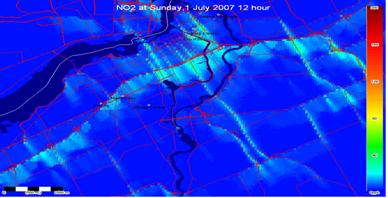
Often winds can influence air pollution dispersion. A sample is shown in Fig. 2 where northeast winds pushed the pollution southwest of Hwy 417 during one single hour.
|
Figure 2. Meteorology influences dispersion |
|
|
· Precipitation, especially during the summer months of 2009 is likely the reason we had better than average air quality in Ottawa. Rain is known to wash out suspended particles and gases from the air.
· Data from the roadside monitors revealed similar pollution patterns for NO2, ground level ozone and PM2.5 pollutants. Day patterns of nitrogen dioxide (NO2) showed a peak around 2:00 a.m. (due to nitric oxides being converted into NO2 in ground level ozone absence[4]), with a second spike that closely mirrored peak traffic volumes. Ozone behaved differently, with a peak in the afternoon (see Figures 3 and 4).
|
|
|
|
Figure 3. Hourly averages for NO2, O3 & PM2.5 |
Figure 4. |
|
|
|
Air Quality and Health
Health Canada and Environment Canada have developed a new tool called the Air Quality Health Index or AQHI. The mapping of air quality in the City provides an extra level of information for Public Health and the general public by adding satellite and roadside data. All these extra data improves on the detail of the AQHI level across the city. Table 1 shows the yearly variation in the duration of smog days from one to 25.
Table 1: Ontario Ministry of the Environment Issued Smog Advisories for Ottawa (2003-2009)[5]
|
Year |
# of Smog Advisories Issued |
Total # of Smog Advisory Days |
|
2003 |
3 |
5 |
|
2004 |
1 |
1 |
|
2005 |
5 |
25 |
|
2006 |
2 |
5 |
|
2007 |
2 |
4 |
|
2008 |
1 |
1 |
|
2009 |
2 |
4 |
Some of the health impacts of individual pollutants are described in detail in Document 2.
European Space Agency Project: Connecting Air Quality and Health
The City’s successful pilot project that mapped outdoor air quality in the National Capital Region has attracted international attention and acknowledgment. Building on the innovative use of satellite data and modelling combined with ground measurements, the European Space Agency funded a second project that looked at Ottawa’s air pollution data and its potential to impact human health. This project used the Ottawa air quality model in conjunction with Health Canada’s model to estimate human health impacts from air pollution. The result is a customized, interactive map-data interface that can illustrate the impacts of urban road traffic emissions on population health.
The model can be used to simulate air quality measurements under different traffic scenarios by modifying variables such as traffic volumes and speeds on selected roads or neighbourhoods. The consequences of such changes can then be measured and interpreted in terms of air pollution and human health in map and tabular formats.
This tool is now available to other City users such as Ottawa Public Health and Transportation Planning for their consideration as a risk assessment tool.
The successful use of this tool, linking air quality mapping to health impacts has resulted in an invitation from the European Space Agency to the City to host an international workshop for ten municipalities. This workshop will take place in Ottawa in May 2011. Our partners on this project are A-MAPS Environmental Inc. and Risk Science International, two local enterprises.
Building on the above initiative, PRECARN (a Non-Governmental Organization that supports the pre-commercial development of leading-edge technologies) supported an application by the City, in partnership with A-MAPS Environmental, to develop a user-friendly interactive tool that would take air pollution mapping and climate change models and integrate them with health risk models developed by Health Canada. The resulting innovative tool will be used by urban planners and health policy decision makers to evaluate different urban development and health protection scenarios. This leading-edge work began in August, 2010.
The success of the National Capital Air Quality Monitoring project has been a catalyst for additional innovative and leading edge tools for air quality assessment. These tools provide ways to track and assess air quality in a very cost effective fashion and the City is now in a position to begin applying these tools for policy development and project assessment. While as noted above, the air quality in Ottawa is generally good, it is important to protect this positive attribute, and continue to monitor air quality to ensure that any negative trends are recognized quickly (an early warning system for air quality). It is also important to acknowledge that there are conditions where air emissions approach standards and this can be of concern to residents that are particularly sensitive to air quality.
Follow-up on Council Report ACS2009-ICS-CSS-0015
- As part of the next report, staff will provide information on air quality mapping of waste disposal sites and consultation with operators in this regard.
- Staff will provide information on budgetary implications of expanding the program further, including providing for additional monitoring and releasing information to the public in a timely manner.
In regards to waste disposal sites, staff determined that the City’s current air quality monitoring equipment is geared to monitor pollution along transportation routes, not waste sites. Provincial and federal regulations already require that all landfill sites perform in conformity to their Certificates of Approval. All sites must report to the Ministry of the Environment and the Waste Sector Greenhouse Gas Division of Environment Canada regarding air quality, so use of the City network to enhance this function would not be viewed as an efficient use of City resources.
Ottawa’s air quality maps are now available on the City’s website[6]. At this time the release of ‘real time’ data, like Halton Region (Document 1), is not feasible but staff will explore the implications of developing a real-time reporting tool in 2011.
What other municipalities are doing
Table 2 highlights the number of air monitoring stations in some Canadian and international cities along with the population. As a minimum, the industry guideline is one unit for every 500, 000 population[7]. The appropriate number for Ottawa also needs to account for the large geographic area as compared to other municipalities such as Halton.
|
Table 2. Number of monitoring stations in cities in relation to population |
|||
|
Cities |
Number of AQ stations |
Population (2006 census) |
|
|
|
City Monitors |
Provincial Monitors |
|
|
Metro Vancouver - BC |
24 |
|
2.1 million |
|
Montreal - QC |
17 |
|
3.8 million |
|
Toronto - ON |
|
6 |
5.5 million |
|
Ottawa NCR – ON/QC |
2 |
3 (2 ON & 1 QC) |
1.5 million |
|
Halton Region- ON |
3 |
2 |
439,000 |
|
City of York – UK |
13 |
|
320,000 |
To date Ottawa’s Air Quality Monitoring Program has been operating as a pilot. \ As the Program becomes established, an operational budget will be required to support the ongoing maintenance and operation. Each roadside monitor costs approximately $100,000, with associated annual operating expenses of approximately $20,000 per unit. The experience and knowledge gained in the last two years positions staff to assess options for an ongoing network. This will be done in 2011 in conjunction with users and potential partners.
Next Steps
The City’s recent air quality monitoring initiatives have permitted a closer look at air quality than the provincial regional air monitoring permits. We are well on our way to having data that provides a baseline description of the state of air quality during different seasons, hours of the day and weather conditions. This knowledge provides all levels of government and the community an important starting point for discussing, planning, maintaining and improving air quality within the City’s boundaries.
Some of the next steps planned for the air monitoring program are:
RURAL IMPLICATIONS
The air mapping using satellite data has included the entire National Capital Region, including rural Ottawa.
CONSULTATION
The City Environmental Advisory Committee was made aware of the results of the latest findings of the air monitoring in the National Capital on September 9th 2010. Ottawa Public Health (Environment, Health Protection & Outbreak Management Branch) and Environmental Services (Solid Waste Operations) had direct input in the development of this report.
COMMENTS BY THE WARD COUNCILLOR(S)
As this report is of a city-wide nature and was originally requested by Council, consultation with the Councillors was not undertaken.
LEGAL/RISK MANAGEMENT IMPLICATIONS:
There are no Legal/Risk Management impediments to implementing any of the recommendations in this report.
CITY STRATEGIC PLAN
The importance of air quality is reflected in several objectives identified in the City’s Strategic Plan (Post 2010 Budget Version), specifically:
· Implement the Air Quality and Climate Change Master Plan
· Monitor performance against targets included in the Air Quality and Climate Change Management Plan
· Develop and implement the Community Sustainability Strategy
FINANCIAL IMPLICATIONS
There are no financial implications.
SUPPORTING DOCUMENTATION
Document 1 Real Time Air Quality Data
Document 2 Health Impacts of Individual Pollutants
DISPOSITION
Environmental Sustainability staff will continue to lead the City’s air quality monitoring efforts, with the participation of Ottawa Public Health staff.
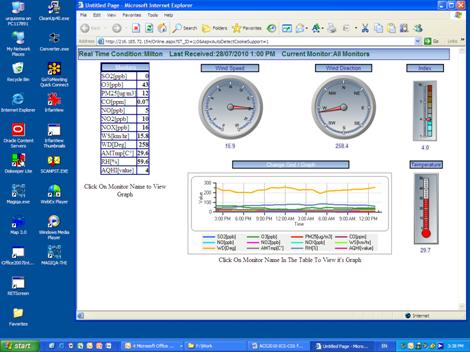
REAL TIME AIR QUALITY DATA DOCUMENT 1
Samples of real time air quality data collected by a roadside monitor similar to ours from the Regional Municipality of Halton, Ontario. The display covers not only seven pollutants but also meteorological data such as wind speed, direction, temperature, relative humidity and the Air Quality Health Index.
(http://216.185.72.154/Online.aspx?ST_ID=1;0&AspxAutoDetectCookieSupport=1 ).
HEALTH IMPACTS OF INDIVIDUAL POLLUTANTS DOCUMENT 2
Pollutant sources and their impact
|
Pollutant |
Source |
Primary Effects |
|
Ozone (O3) |
Atmospheric reaction of organic gases with nitrogen oxides in sunlight
|
• Plant injury • Irritation of eyes, respiratory irritation • Aggravation of respiratory and cardiovascular diseases • Impairment of cardiopulmonary function |
|
Sulphur Dioxide (SO2) |
• Combustion of sulphur-containing fossil fuels • Smelting of metal-bearing ores • Industrial processes |
• Plant injury • Reduced visibility • Deterioration of metals, textiles, leather, finishes, coatings, etc. • Irritation of eyes • Aggravation of respiratory diseases (asthma, emphysema) |
|
Carbon Monoxide (CO) |
• Incomplete combustion of fuels and other carbon-containing substances, such as motor vehicle exhaust • Natural events, such as decomposition of organic matter |
• Plant injury • Deterioration of metals, textiles, leather, finishes, coatings, etc. • Irritation of eyes and blood chemistry changes • Aggravation of respiratory and cardiac diseases |
|
Nitrogen Dioxide (NO2) |
• Motor vehicle exhaust • High-temperature stationary combustion • Atmospheric reactions
|
• Aggravation of respiratory illness • Some increase in bronchial reactivity/sensitivity in people with asthma and bronchitis. Long-term exposure can induce irreversible changes in lung structure and function • Reduced visibility – slight odour and looks brown • Reduced plant growth • Formation of acid rain |
|
Fine Particulate Matter (PM2.5) |
• Stationary combustion of solid fuels (e.g. emissions from fuel combustion to provide energy in sectors such as energy, manufacturing, construction and construction activities • Industrial processes • Atmospheric chemical reactions |
• Heavy dust loading can affect plant growth. • Soiling • Reduced visibility • Increased cough and chest discomfort • Reduced lung function • Aggravation of respiratory and cardio-respiratory diseases |
Source: Air Quality across the City of Ottawa – Final report (SENES, 2007)