|
3. WATER
LOSS CONTROL 2008 SUMMARY REPORT STRATÉGIE DE
CONTRÔLE DES PERTES EN EAU EN 2008 |
Committee recommendation
That Council receive this report for information.
Recommandation DU Comité
Que le
Conseil prenn connaissance du présent rapport à titre d’information.
Documentation
1.
Deputy
City Manager’s report, Infrastructure Services and Community Sustainability
dated 6 May 2009 (ACS2009-ICS-WWS-0012).
Report to/Rapport au :
Planning
and Environment Committee
Comité de l'urbanisme et de l'environnement
and Council / et au Conseil
Submitted by/Soumis par : Nancy
Schepers,
Deputy City Manager/Directrice
municipale adjointe,
Infrastructure Services and
Community Sustainability/
Services d’infrastructure et
Viabilité des collectivités
Contact Person/Personne ressource : Dixon Weir, General Manager /
Directeur Général
Environmental
Services Department / Services environnementaux
(613)
580-2424 x22002, dixon.weir@ottawa.ca
SUBJECT: |
WATER LOSS CONTROL 2008 SUMMARY
REPORT |
|
|
|
OBJET :
|
REPORT RECOMMENDATION
That the Planning and Environment
Committee and Council receive this report for information.
RECOMMANDATION DU
RAPPORT
Que le Comité de l’urbanisme et de
l’environnement et Conseil prennent connaissance du présent rapport à titre
d’information.
EXECUTIVE SUMMARY
The Drinking Water Operations Branch is responsible for the treatment and delivery of the City’s drinking water. In 2008, the City of Ottawa delivered an average of 297 ML of drinking water from two treatment plants to 815,000 customers on a daily basis. This report highlights the recent activities of the Water Loss Control program and provides updated performance measures.
The City’s Infrastructure Leakage Index (ILI), a key performance measure of the Water Loss Control effectiveness has been reduced from 4.8 (2007) to 3.7 (2008). The decrease in ILI is partly attributed to the repair of water distribution components (watermains, services, valves and hydrants) that eliminated approximately 2,500 ML of water losses, resulting in an estimated savings of $155,000. Another factor attributed to the decrease is the reallocation of apparent losses to authorized consumption from the Water Meter Change-out program resulting in additional revenues of about $88,150.
The report will also highlight the current
status of supply side initiatives including apparent and real loss control
planned for 2009 for the consideration of the Planning and Environment
Committee and Council.
RÉSUMÉ
La Division des
services de gestion de l’eau potable est responsable du traitement et de la
distribution de l’eau potable de la Ville. En 2008, la Ville d’Ottawa a
distribué chaque jour une moyenne de 297 millions de litres d’eau potable, en
provenance de deux stations d’épuration, à quelque 815 000 clients. Le présent
rapport souligne les récentes activités entreprises dans le cadre de la
Stratégie de contrôle des pertes en eau et fournit des mesures de rendement à
jour.
L’indice des fuites de l’infrastructure (IFI)
de la Ville, une mesure de rendement clé de l’efficacité de la Stratégie de
contrôle des pertes en eau de notre Ville, est passé de 4,8 (en 2007) à 3,7 (en
2008). Cette diminution de l’IFI est en partie attribuable à la réduction de 10
p 100 des pertes réelles en 2008 comparativement à 2007, ce qui représente des
économies évaluées à 155 000 $. On doit aussi cette diminution à la
réattribution des pertes apparentes à la consommation autorisée consécutive au
programme de remplacement des compteurs d’eau, ce qui a engendré des revenus
supplémentaires d’environ 88 150 $.
Le rapport fait
également ressortir l’état actuel des initiatives ayant trait à l’offre,
notamment le contrôle des pertes apparentes et réelles, prévues pour 2009, aux
fins d’examen par le Conseil et le Comité de l’urbanisme et de l’environnement.
BACKGROUND
The City of Ottawa has been providing
drinking water services to residents of the City for over 125 years, and over
this time the demand for drinking water has grown with the City’s increasing
population. The drinking water
infrastructure required to provide this service has also expanded in order to meet
the water demand. High quality drinking
water continues to be provided through an extensive network of infrastructure
including water purification plants, booster pumping stations, reservoirs and
tanks, watermains, hydrants and service connections.
The
relationship between population, water produced and billed consumption from
1980 to 2008 is shown on Figure 1.
The
original growth development strategy for the water infrastructure was to expand
the system to ensure that adequate capacity (volume and pressure) was available
to meet customer demand. However, it is
also recognized that the existing infrastructure must be utilized efficiently
and effectively in order to minimize the financial pressures and defer the need
of costly plant expansions and the installation of large diameter transmission
watermains.
In
order to effectively and efficiently utilize existing water infrastructure, the
City has developed programs to address both the supply and demand side of the
overall water demand equation. The
supply side program update will be addressed in this report. An update on the status of the demand side
program is subject of report ACS-2009-ICS-WWS-0011 that addresses the progress
of the water conservation efforts.
DISCUSSION
The purpose of this report is to present the
activities undertaken in 2008 and outline those initiatives that are planned
for 2009. The following is a list of
some of the initiatives currently in place or planned for:
Production
§ Regular maintenance of production and distribution water meters;
§ Calibration and monitoring of existing water meters for service water required for treatment;
§ Chemical usage analysis to verify production input volumes;
§ Enhancement to flow reports utilized to monitor water usage in closed pressure zones and communal well systems.
Distribution
§ Review watermain break repair response procedure;
§ Review the Preventative Maintenance program;
§ Prioritize watermain rehabilitation and replacement needs;
§ Conduct leak detection surveys on local distribution and transmission watermains;
§ Account for all metered and unmetered water usage;
§ Verify the large meter changeout procedure to ensure appropriate priority/use of existing resources;
§ Utilize district metering areas to identify leakage.
Regulation
§ Report on the recent pilot for the repair of leaks on private property.
Water Balance Summary Report
In
2005, the City adopted the Standard Water Balance as an accounting mechanism to
determine the volume of non-revenue water.
The Standard Water Balance Summary Report for 2008 is presented in
Figure 2. Staff continue to account for
all water usage from the time the water is treated to the point of consumption.
Figure 2: Standard Water Balance
Summary Report
Water Production
Volume dropped by 1.8% from 2007 to 2008.
The Revenue Water Volume dropped by approximately 4% during the same
period even though there was an increase in serviced population and
installation of new watermains of about 1.3%.
The drop in Revenue Water may be attributed to water efficiency
strategies, behaviour changes related to outdoor water usage or the increase in
the water rate.
The accounting of the
various volumes that are used to determine the Standard Water Balance is
improving. From 2007 to 2008, there has
been an increase in the volume of Unbilled Authorized Consumption due in part
to a greater awareness and reporting of these unbilled uses. This component includes the water used for
operation and maintenance activities (flushing and commissioning of watermains
and hydrant flow testing), temporary service water use and water quality within
the distribution system (flushing and blow-offs), fire fighting and water
service for City facilities.
When annual System Input
Volume figures are compared against Authorized Consumption figures, there was a
gap of about 13% in 2008, which is identified in the Water Balance Report as
Water Losses. In comparison, the gap in
2007 was 14.5%, which also indicates that the trend is improving.
The real loss component of the water losses
is valued at about $784,300 per year using the marginal cost of water of
$0.062/m3. If it were
possible to capture all of the Apparent Losses and reduce this component of the
Standard Water Balance to zero, the additional revenue would be approximately
$1,972,000[1]
per year using the weighted water rate of $1.062/m3 for 2008[2]. It is important to note that a reduction in
apparent losses may not lead to real financial savings, since in some cases,
the reduction may only be a better accounting and reallocation of volumes
within the Water Balance.
However, there are some saving opportunities
by identifying unmetered properties and staff will continue to monitor the
property tax and water billing databases to identify and rectify any unmetered,
unauthorized or illegal water use.
Staff will also continue with such efforts as the Large Meter Change-out
program to reallocate water volumes from apparent losses to billed authorized
consumption and revenue for the City.
Figure 3 illustrates the trend in average day
production by month for the last 3 years.
As shown in
Figures 1 and 3, the overall water production has been decreasing in each and
every month in spite of a growing population.
While many factors undoubtedly
contribute to these reductions, part of the reduction in water production is
attributable to the reduction in real losses through the replacement of aging
infrastructure and the repair of leaks from the Active Leak Detection program.
This reduction has been occurring since 2003
with a cumulative drop in the average daily water production of 70 ML since
2003. All pressure zones have
experienced a drop in consumption since 2003 with the exception of growth
areas. The following table (Table 1)
illustrates the change by pressure zone.
Table 1:
Cumulative change in consumption by pressure zone[3]
from 2003 to 2008
|
Pressure zone |
Wards |
Water consumption change |
|
1W |
Core – 7,12,14,15,17 |
-43 ML |
|
2W |
West – 3,4,7,8,9,14,15,17 |
-6 ML |
|
1E |
East – 1,2,10,111,12,13,17,18 |
-9 ML |
|
2C |
East – 10,16,17,18,22 |
-8 ML |
|
2E |
East – 1,2,19 |
No change (growth area) |
|
3C |
South – 10,16,19,20 |
No change (growth area) |
|
MG |
West – 4 |
+1 ML (growth area) |
|
MEAD |
Central – 8,9,16 |
-2 ML |
|
MONT |
East – 11,13 |
-1 ML |
|
BARR |
South – 3,21,22 |
No change (growth area) |
|
EMR |
West |
No change |
|
3W |
West – 4,6,28 |
-2 ML |
The top
4 pressure zones listed above with the greatest reduction in consumption
account for 83% of the watermain breaks repaired in 2008.
Staff will also continue to
improve the level of confidence of the estimates found in the Water
Balance. The Water Balance is based on
some assumptions and staff employs a continuous improvement strategy to
increase the level of certainty in the data.
An economic analysis will be performed to optimize our efforts and to
help target the level of investment required and determine the next ILI target.
Apparent
Losses
Apparent Losses represent a far smaller
portion of the water “lost” within the system, but it represents a larger
revenue opportunity to the City, depending upon the actual source of those
losses.
The Water Loss Control Strategies
initiatives that will continue in this area are as follows:
1.
Reduction of Unauthorized Water
Usage
The City has assigned some of its
resources to closely monitor the use of flusher hydrants by contractors and to
ensure the City is properly compensated for the water taken. Through the course of our normal service
delivery, field staff will note and report instances of unauthorized water
consumption such as open water meter bypass valves and unauthorized water
connections.
The number of infractions subject
to enforcement under the water use provisions of the water by-law increased in
2008 over the previous year; hydrant related offenses increased from 12 to 34
and water meter related offenses increased from 17 to 21.
2.
Reduction of Water Meter
Under-registration
The Large Water Meter Change-out
program in 2008 resulted in additional water revenues due to improved
accuracy. Since it was not possible to
determine whether the additional revenue was due to the Meter Change-out
program or simply a change in behavioural pattern, the reported efficiency due
to the Change-out program has been estimated as being half of the maximum
revenue of $176,300 for 2008, which amounts to $88,150.
In 2009, staff will continue to
verify that the large meters are sized appropriately for application and
recommended replacement as well as confirm the large meter selection procedure
to maximize the cost savings from the meter change-out. As of January 2009, the average age of the
compound and turbine meters has been reduced.
The range in age for the compound meters in 2003 was 5 to 8.5 years and
it is now 2 to 5 years. The
turbine meter average age has gone from 3 to 8 years to 1 to 5 years. By routinely performing the large water
meter change-out, the accuracy of the large meter population should increase or
at the very least, come closer to recording the actual consumption.
3.
Expand the Advanced Meter
Infrastructure (AMI) Project
The City plans to award a
contract for the supply and installation of a City-wide AMI project in
2009. The implementation period will
take place over two to four years. The
AMI system will replace obsolete meter reading technology and thereby eliminate
estimated meter reading values, ensuring that accurate consumption figures are
available both for billing and for water balance purposes.
While the main business drivers
for the AMI project were improved customer service, financial management and
cost effectiveness, a pilot 2007 project proved that advanced metering
technology can be used to calculate the amount of distribution system leakage
with greater accuracy. The availability
of higher resolution water meter registers and the resultant hourly consumption
data will allow the City to leverage the data for a variety of applications,
such as: validation of hydraulic models used to project
future water system growth, identification of peak water use patterns, monitor
the effects of targeted water conservation measures and provide a greater
variety of customer service applications.
4.
Reduction of Unmetered Properties
The review of water
billing accounts in 2006 and 2007 against the property tax database identified
a small number of properties that have been investigated. This is an
ongoing exercise to reconcile these data sets to further reduce
the potential of
unmetered properties. Other studies
have identified potential data gaps.
These records will be brought forward to Billing for further
investigation.
For 2009, staff
within the Water Loss Control group will work with Billing to investigate the
water use of some of the larger accounts in order to identify water use trends
for all customer groups to explain the reduction in Revenue Water.
Real
Losses
It is recognized that all real losses cannot
be completely eliminated from the distribution system as it would not be cost
effective to do so. The IWA
(International Water Association) and the AWWA (American Water Works Association)
have developed standard performance indicators based on a water system’s
specific characteristics to identify the most achievable level of water loss
for that system. The 2008 performance
indicators presented herein confirm that the City is headed towards achieving
its water loss objectives, and has in fact achieved its Infrastructure Leakage
Index target.
Infrastructure
Leakage Index
The Infrastructure Leakage Index (ILI) is
defined as the ratio of Current Annual Real Losses (CARL) to the Unavoidable
Annual Real Losses (UARL). It is a ratio
comparing current utility performance to its own theoretical lowest level of
leakage performance. It can be used as
a comparable performance indicator between water utilities regardless of their
size or geographical location.
The CARL for the City is estimated at 16.3 x
106 m3 for 2008, which reflects the “highest estimated”
value, based on current levels of data confidence limits. The UARL based upon the City’s
infrastructure, is calculated as 4.4 x 10⁶ m3 for 2008.
Using the CARL
and UARL values noted above, the City’s ILI for 2007 is 3.7 compared to 4.8 in
2007. In other words, the real losses
in Ottawa are 3.7 times more than the lowest technically achievable level of
real losses. The IWA and AWWA guidelines suggest that for service providers that
have a water source that is sufficient to meet the long-term needs of the
community and have implemented good water control practices and effective
maintenance programs, that an appropriate ILI is no greater than 4.0. The City has met and surpassed that
target; which means that the City’s Water Loss Control program is considered to
be in the performance status condition known as “Good”. As mentioned earlier, a strategic review will be undertaken in
2009 to re-evaluate the cost effectiveness of further reducing the ILI
target. This analysis will ensure that
future objectives are feasible and cost effective.
In 2007, the Ontario
Municipal Benchmarking Initiative started to report ILI values from cities in
Ontario. Out of the 15 surveyed, 9
municipalities reported values in 2007; and the reported average ILI was
3.38.
Other
Operational Performance Indicators
For 2008, with an ILI of 3.7, the volume of
real losses is 318 L/service connection/day or 13 m3/km of
watermain/day.
Real Loss Control Initiatives
The four leakage management activities are shown on Figure 5.
Figure 5: Real Loss Control Initiatives
The City will continue to focus on the four different aspects of leakage management activities:
§ Active Leak Control (which includes District Metered Areas);
§ Pressure Management;
§ Speed and Quality of Repairs; and
§
Pipeline
Asset Management.
Active Leak Control
The City currently
investigates a leak either reactively (reported leaks) or proactively
(unreported leaks). The Active Leak
Control program is intended to locate leaks before they surface and to initiate
repairs in a timely manner. The Active
Leak Control survey of the central water distribution system (metallic
watermains) and metallic communal well systems was completed in 2008. The survey identified leaks on watermains,
service connections and other appurtenances within the water distribution
system. Once these identified leaks
were repaired, it resulted in an estimated operational savings of about
$155,000 in 2008. The program will
continue to survey metallic watermains throughout the system in 2009.
Leaks
on Private Property
During the course of the leak survey activity, numerous leaks were identified on private property. The City is not authorized or responsible for fixing leaks on private property. When such a leak is identified, the property owner is given a letter from the City stating that a leak was found on their property and that they are responsible for the repair. For those property owners who do not perform the repairs required, they run the risk of damage to the home or adjacent property. It should also be noted that these leaks on private property contribute to the City’s real losses and associated ILI.
In 2008, staff implemented a pilot as part of a future Water Loss Policy for Leaks on Private Property that requires property owners to make the necessary repairs within a 3-month time frame. A notification process is instituted whereby the owners are reminded every 30 days, that if the repair is not completed within the 3-month timeframe, the water supply will be turned off, and will remain off until the leak has been repaired. The pilot program made allowances for extensions in time to be granted to those property owners that demonstrated extenuating circumstances. In these cases, an extension in repair time would be granted and the property owner would agree to repair their water service within the agreed upon time frame.
The Leak on Private Property pilot was initiated in August 2008. Of the 56 leaks reported to the end of the year, 48 (86%) have been repaired. Another 7% of the leaks are on services that are not being used at this time, as the properties are not occupied, and these services have been turned off to stop the loss of water. Four services were not yet repaired at the time of preparing this report. Only two services have been turned off during this pilot for failure to complete the repairs. One remains turned off, as the property is unoccupied; and the other was turned back on as a result of a change in ownership and a request to extend the time period to repair the water service.
Leak Surveys on Large
Diameter Watermains
The City operates and maintains about 200 km of large diameter watermains (610 mm and larger in diameter) within the central distribution system. In 2007, a pilot project was initiated to perform leak surveys on large diameter watermains in order to evaluate the effectiveness of current and available technology. The results from the pilot project indicate there are reliable cost-effective options to conduct leak surveys on large diameter watermains, which are critical components of the water infrastructure. The implementation of an annual Large Diameter Leak Detection program will allow the City to proactively identify leaks and schedule repairs with minimal disruption to the customers’ service. The City will continue to conduct leak surveys in 2009. A leak survey will be conducted on transmission watermains (1220 mm in diameter) at two locations for about 5 km each. The proposed locations include the watermain feeding Orleans between Blair Road and the Orleans Reservoir and the watermain that feeds Kanata and Stittsville located between Moodie Drive and Eagleson Road.
As a result of a
large diameter watermain failure on Woodroffe Avenue in November 2007, a
condition assessment was conducted on approximately 3 kilometres of that
watermain in October 2008, between Hunt Club Road and Fallowfield Road. A Remote Field Eddy Current/Transformer
Coupling (RFEC/TC) investigation was conducted and the results of the
inspection revealed that about 3% of the pipes within the inspection length had
wire breaks and were under some distress.
This level of distress is consistent with observations made within
similar pre-stressed concrete pressure pipelines across North America. Additional review of these results will
continue in 2009 to identify any required maintenance and/or potential
replacement of the watermain.
District
Metered Areas (DMAs)
Another method of Active Leak Control is the use of District Metered Areas. In 2008, six temporary DMAs were delineated and tested in the spring and fall – one in the 2E pressure zone (Ward 19), two in the 3W pressure zone (Wards 6 and 23), and three separate areas in the Barrhaven pressure zone (two in Ward 3, and one in Ward 22).
The results from this program in 2008 showed that DMAs continue to be an effective tool for identifying leakage in areas with plastic infrastructure. DMAs in areas of metallic infrastructure have been deferred, as the annual hydrant leak survey has been successful in keeping the water losses in these areas at a minimum.
Two PVC DMAs targeted in the fall of 2007
were remonitored in the spring of 2008.
The follow-up monitoring in one area indicated that excess losses
observed in the fall of 2007 had been reduced as a result of repairs to six
service leaks. The result for the
second area indicated that losses were slightly higher than measured in the
fall, but may have been influenced by early spring usages. It should be noted that these losses were
still within the expected normal range for night flows. In 2009, PVC zones will be the focus for
DMAs, and follow-up surveys will be conducted in those zones that were monitored
in the fall of 2008 to evaluate the results.
Staff has been monitoring the night flow in the communal well systems (Carp, Vars, Munster Hamlet and Richmond-Kings Park) and the three closed pressure zones (Morgan’s Grant, Meadowlands and Montreal Road) using the reports generated from the Water Production’s SCADA (Supervisory Control and Data Acquisition) system. Night flow reports have been generated to illustrate the minimum flow between 2 am and 4 am. These reports are reviewed on a regular basis and when the night flow exceeds certain criteria, leak detection staff are dispatched to the zone in order to identify these potential leaks, since the increase in the flow base level is likely due to watermain breaks that have not surfaced. A series of watermain breaks were identified by monitoring the night flows in Munster Hamlet and led to the identification of 1.2% of the real losses identified in 2008. The regular monitoring of night flows leads to a reduction in the leak run time, which leads to an overall reduction in real losses.
Pressure Management
The amount of leakage from any distribution system
is directly related to the water pressure.
If it is possible to reduce the operating pressure in the distribution
system with little or no change in service level, leakage from the system can
be reduced. Staff will be assessing
pressure management area opportunities based on the review of the economic
analysis that will be conducted in 2009 to determine future targets for the
Water Loss program. We anticipate that
Montreal Road Pressure zone might be a good candidate for pressure
management. It is a closed pressure
zone with capacity to reduce the pressure at night. Furthermore, this pressure zone experienced a large number of
watermain breaks in 2008 when compared to the other pressure zones.
Speed and Quality of Repair
The speed and quality of repairs are
centered around the reduction of the leakage run time which starts at the time
when the City becomes aware of a leak until the time that leak is
repaired. The volume of water lost in
any leak is calculated as the product of the flow rate of the leak multiplied
by the leakage run time. Shortening the
leakage run time by earlier detection will reduce the volume of lost water. Detecting leaks before they are visible at
the ground surface is an important means of shortening leakage run time and
lost water. In 2008, about 15% of the
repairs conducted on the central water distribution system were initiated from
the Active Leak Survey program.
Pipeline Asset Management
The City currently has a progressive
watermain replacement capital program in place. Funds are allocated annually to replace and rehabilitate
watermains based on a priority matrix comprised of many factors such as age and
watermain break history. There are
other capital programs that aim to improve pipe condition, such as the
Structural Relining and Cathodic Protection programs.
The reduction in water production observed
in the last 5 years can be attributed in part to the infrastructure
rehabilitation and replacement program.
In particular, the pressure zone with the greater reduction in water
consumption from 2003 to 2008 was 1W, where the majority of the Capital
Rehabilitation program has been focused.
CONCLUSION
All performance indicators associated with the
Water Loss Control program confirm that the City is effectively reducing water
losses through the combination of various operational management activities:
§
ILI
has gone from 4.8 in 2007 to 3.7 in 2008;
§
Volume
of water captured through repairs to the water distribution system resulted
in $155,000 in savings;
§
Volume
of non-revenue water is 318 L/service connection/day;
§
Volume
of real losses is 13 m3/km of watermain/day; and
§
Water
Meter Change-out program resulted in $88,150 in additional revenues.
These positive
improvements can be attributed to our customers and staff involvement in both
the Water Conservation program and the Water Loss Control Strategy
activities. In 2008, $43,000 was spent
for the district meter area night flow work and $254,000 for labour, equipment
and material for conducting the active leak detection work. For 2008, the program costs totaled $297,000
and program efficiency savings totaled $243,150.
CONSULTATION
Public consultation was not required for this
update.
LEGAL/RISK MANAGEMENT IMPLICATIONS
There
are no adverse legal or risk management implications.
FINANCIAL IMPLICATIONS
The estimated
net savings and additional revenue of $155,000 associated with the reduction in
real losses from the Active Leak Detection activities, and estimated increases
of $88,150 in billed consumption from the Large Meter Change-out program will
be reflected in the Department’s Efficiency Targets for 2009.
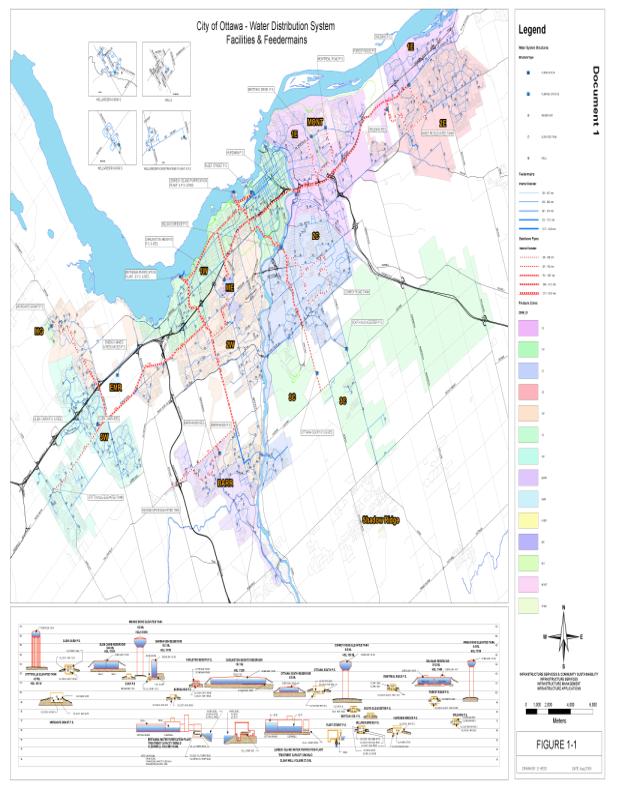
SUPPORTING DOCUMENTATION
Document 1 – Map of the City of Ottawa Water Distribution Systems Facilities and Feedermains
DISPOSITION
The
Environmental Services Department will continue to implement the Water Loss
Control program in 2009. Staff will
prepare a summary report related to the program’s performance to Committee and
Council on an annual basis.