APPENDIX A
![]()
Public Sector
City of Ottawa
Branch-by-Branch Overtime Review
Final
Report (v 2.0)
September
7, 2006
APPENDIX A
![]()
Public Sector
City of Ottawa
Branch-by-Branch Overtime Review
Final
Report (v 2.0)
September
7, 2006
1.2 Legal and Legislative Context
1.3.1 Project Scope and
Objectives
1.3.2 Project Approach and Work
Undertaken
2.2 Summary of Overtime Expenditures by Branch
2.2.1 Summary of Actual
Overtime versus Planned Overtime
2.2.2 Total Overtime Costs by
Branch
2.2.3 Actual Overtime versus
Planned Overtime by Branch
2.2.4 Budget Variances by
Branch
2.2.5 Overtime Costs Relative
to Branch Operational Characteristics.
2.2.7 Overtime Costs as a
Percentage of Compensation Budget
2.3 Overtime Policies and Procedures
2.4 Overtime Causes and Other
Considerations
2.4.1
Overtime Drivers across Branches
2.4.2
Discretionary vs. Non-Discretionary Overtime
2.4.4 Shift Premiums and Statutory Holidays
2.4.5 Overtime Usage versus Hiring Additional
FTE’s
2.4.6 Results of the Previous Transit Operator
Establishment Review
2.4.7 Other Overtime Considerations
3 Recommendations –
Corporate-wide
3.2.1 Overtime Policies and Procedures
3.2.3 Overtime Management and Control
3.2.4 Overtime Recording/Coding
3.2.5 Overtime Tracking and Reporting
4 Findings and
Recommendations – Individual Branches.
4.7 Real Property Asset Management
4.8 Traffic and Parking Operations
Appendix A –
Collective Agreements - Overtime Summary
Appendix B –
Additional SAP Data
Appendix C –
Documents Reviewed
Appendix D –
Interviews Conducted
Table of Figures
Figure 1 – City branches included
in the review
Figure 2 – Total expenditures
versus budgeted overtime for the years 2003, 2004 and 2005
Figure 3 – Overtime expenditures
for all branches (2005)
Figure 4 - Actual versus planned
overtime for all branches for the years 2003, 2004 and 2005*
Figure 5 - Variance between actual
overtime versus planned overtime for all branches (2005)
Figure 6 – Actual overtime,
budgeted FTE’s, and operational characteristics for all branches (2005)
Figure 7 - Average overtime cost
per FTE for all branches (2005)
Figure 8 – Overtime expenditures as
a percentage of total compensation budget (2005)
Figure 9 - Examples of systems to
supplement standard overtime procedures
Figure 11 - Examples of overtime
causes identified as discretionary or non-discretionary
Figure 12 – Proportion of discretionary
overtime versus non-discretionary overtime
Figure 13 – Absenteeism rates
against total overtime expenditures for all branches (2005)
Figure 14 – Statutory holiday
overtime as a percentage of total overtime (2005)
Figure 15 – Overtime data for
Transit Services (2005)
Figure 16 – Previous audit results
for Transit Services
Figure 17 – Overtime data for Fleet
Services (2005)
Figure 18 – Previous audit results
for Fleet Services
Figure 19 – Overtime data for
Surface Operations (2005)
Figure 20 – Previous audit results
for Surface Operations
Figure 21 – Overtime data for
Utility Services (2005)
Figure 22 – Previous audit results
for Utility Services
Figure 23 – Overtime data for
Paramedic Services (2005)
Figure 24 – Previous audit results
for Paramedic Services
Figure 25 – Overtime data for RPAM
(2005)
Figure 26 – Previous audit results
for RPAM
Figure 27 – Overtime data for
Traffic and Parking Operations (2005)
Figure 28 – Overtime data for
Infrastructure Services (2005)
Figure 29 – Overtime data for Fire
Services (2005)
Figure 30 – Previous audit results
for Fire Services
Figure 31 – Overtime usage for the
remaining twenty-two (22) branches (2005)
Figure 32 – Overtime data for
twenty-two (22) branches (2005)
Figure 33 – Overtime drivers for
twenty-two (22) branches
The City of Ottawa Branch-by-Branch Overtime
Review was conducted in April and May of 2006. The objective of this review was
to provide an overall assessment of the City’s use of overtime, an analysis of
the overtime expenditures within each City branch, and recommendations for
improvement.
This review was
conducted by a project team whose members included both City staff and Deloitte
consulting professionals. The study included a review of previous audits
and studies that were conducted since amalgamation, a branch-by-branch analysis of overtime usage
including overtime expenditures for the past three years, interviews with Branch Managers and other subject
matter experts within the City, a review of policies and procedures in place to
record, track, manage, and control overtime and the development of
recommendations for improvement. A total of thirty-one (31) branches were
reviewed (Police Services was not included in the scope of this review).
Key Findings
Several key findings and observations were made
over the course of this review and included the following:
• Total overtime expenditures for the City in 2005 were $28.8 million (excluding Police Services) and $32.8 million (including Police Services).
• Overall overtime spending has remained stable despite an increase in compensation and overtime costs of approximately 3% per annum. This indicates that the use of overtime (actual number of overtime hours) has been decreasing over the past three (3) years.
• While many branches have exceeded overtime budgets over the past year, all branches have been able to manage within the overall compensation budgets.
• Overtime expenditures account for approximately 4% of the total compensation budget.
• Twenty-two (22) of the thirty-one (31) branches incur relatively low expenditures on overtime, with an average for each branch of approximately $125,000 for 2005, while the remaining nine (9) branches each incurred over $1 million in overtime expenditures for 2005.
• 90% of the City’s overtime spending is accounted for by nine (9) branches of the thirty-one (31) branches.
• As would be expected, higher overtime expenditures are generally associated with branches that have front-line operations. Front-line operations create a greater need for overtime usage to meet levels of service expectations and requirements. Most of the nine (9) branches that spent over $1 million each in overtime have 24/7 operations and provide citizen-facing services.
• Some branches have already implemented changes that should decrease overtime usage, such as filling vacancies and shift restructuring.
• The variance between the City’s planned and actual overtime has been substantial over the past three (3) years. While the variance has improved from 2003 to 2005, the overtime incurred in 2005 was still 49% over budget. All but five (5) branches were over budget in 2005.
• Budget variances in many branches are substantial indicating that overtime budgeting practices are not enabling the City to accurately budget and monitor overtime costs.
• Some branches earn revenues and/or receive cost recoveries (i.e. for capital projects, staff coverage at festivals, etc.) that offset the corresponding costs of overtime usage.
• The degree of correlation between absenteeism and overtime use across the city is low, although there is a slightly stronger correlation between absenteeism and overtime use in the branches with the highest use of overtime. The average annual absenteeism rate per employee for the five (5) branches with the highest use of overtime was 12.6 days/employee, as compared to the 10.3 days/employee average for the City.
• Overtime pay on statutory holidays accounted for 9% of the City’s total overtime costs in 2005.
• For all statutory holidays worked in 2005, the Payroll division has identified several issues and inconsistencies with the coding for the statutory holidays, which are currently being reviewed. If statutory holiday overtime was coded/reported consistently across the branches then the actual overtime costs on statutory holidays would decrease approximately 55%, from $2.7 million to $1.2 million.
• Overtime policies and procedures are not consistent across the City and, in many cases, there are no formal and documented policies and procedures.
• Most branches do not have a formal system in place to track the causes/drivers of overtime which makes it more difficult to analyze and manage overtime usage.
• For this review, the key drivers of overtime were identified and categorized as discretionary and non-discretionary overtime (discretionary overtime was defined as “there is a choice as to whether to allow overtime or not” and non-discretionary overtime was defined as “there is no choice, or no other options, but to allow overtime”). Eighty-two percent (82%) of the overtime drivers were determined to be non-discretionary and 18% were discretionary[1].
• The most common drivers of overtime across all branches included unforeseen/unplanned events, planned events, deadline requirements, periodic high service level demands, vacancies, and special projects. Less frequently identified drivers of overtime included absenteeism, statutory holidays, requests from council, public consultation, and services provided outside of regular hours.
• The use of overtime is, in many cases, a cost-effective means to maintain service levels.
Summary of Corporate-wide Recommendations
The following is a summary of the corporate-wide recommendations arising from this review. These recommendations are focused on the actions that the City should take across all branches to effect improvements in how overtime is managed. The review provides additional recommendations for each of the branches that are the highest users of overtime.
The corporate-wide recommendations address the following areas for improvement: overtime policies and procedures, overtime budgeting, overtime management and control, overtime recording/coding, and overtime tracking and reporting and, if implemented, these recommendations may have the potential to decrease overtime expenditures.
• Recommendation 1 – Develop Overtime Policies – The Employee Services branch should develop a corporate-wide overtime policy. This policy should identify the overall direction for City managers with regard to the acceptable use of overtime, the expectations for how City managers are to budget, manage and control for the use of overtime, and the requirements for reporting on the use of overtime in their branches and divisions.
• Recommendation 2 – Develop Overtime Procedures – The Employee Services branch should develop corporate-wide overtime procedures. These procedures should include definitions of discretionary versus non-discretionary overtime, procedures for requesting and approving overtime, procedures for overtime recording/coding, and procedures for overtime tracking and reporting. Some branches may need to further develop branch-specific overtime procedures in order to address specific operational requirements.
• Recommendation 3 – Develop Overtime Base Budgets – Appropriate overtime base budgets need to be established and implemented in order to more accurately account for and justify the overtime requirements of the branches.
• Recommendation 4 – Adjust Overtime Base Budgets - For fiscal year 2006, each branch should be granted a one time base budget adjustment to more accurately reflect actual overtime costs. After this one time adjustment, further changes should be made on a case-by-case basis.
• Recommendation 5 – Track Overtime to Revenue Earned/Costs Recovered – New cost codes should be established on timesheets and in SAP to more accurately track and link overtime directly to the revenue earned and/or the costs recovered.
• Recommendation 6 – Define Service Levels – Service level requirements for each branch should be more clearly defined to enable branch management to more accurately plan for and manage overtime costs that are incurred to achieve targeted service levels.
· Recommendation 7 – Record/Code Overtime – Common procedures for recording/coding of overtime should be implemented across all branches to ensure that overtime costs are being consistently tracked and reported.
· Recommendation 8 - Track Overtime Causes – New cost codes should be established on timesheets and in SAP to track and report overtime causes.
Summary of Branch-specific Recommendations
The branch-specific recommendations identify recommendations specific to improving overtime usage within each branch. Although most of the corporate-wide recommendations apply to these branches as well, implementation of the branch-specific recommendations may require coordination and alignment with the implementation of the corporate-wide recommendations.
The more detailed branch-specific recommendations are provided in Section 4 of the report and are not included in this Executive Summary.
The City of Ottawa’s
Auditor General recently released its Audit report entitled “Audit of Overtime,
2005 Report” which examined the practices utilized in three branches (Utility
Services, Fire Services and Real Property Asset Management) to determine if
appropriate processes were in place to track, manage, and control the overtime
worked in the City. In 2002, the City’s Internal Audit branch had conducted a
similar review of four other branches (Transit Services, Fleet Services,
Surface Operations and Emergency Medical Services (now Paramedic Services)). In
total, seven (7) of the thirty-one (31) branches within the City had been
reviewed prior to this study with regard to overtime practices. Of these seven
(7) branches, some were found to be over budget on overtime expenditures while
others were operating in line with the total planned 2004 and 2005 overtime
budgets. In most cases the audits found that there were a number of areas for
improvement and each audit report included several recommendations.
In addition to the
audits completed in 2002 and 2005, Transit Services, in 2004, hired an external
consultant to conduct a follow-up review of overtime use. The results concluded
that a measured but continued reliance on overtime would keep costs down, and
would allow a small improvement in service reliability. The report also
recommended an optimal budget mix for the number of FTEs at regular time versus
the use of overtime.
As a result of these
previous audits and reviews, the Executive Management Committee (EMC) committed
to conduct a corporate-wide review and analysis of the overtime expenditures
within each City branch. Deloitte was engaged to complete this analysis and
provide recommendations for improvement in accordance with a prescribed Terms
of Reference for the review. This report is the output of the review which was
completed during April and May of 2006.
The use of overtime
within the City of Ottawa is governed by the Employment Standards Act (ESA)
2000, the Canada Labour Code (CLC), and the regime of collective agreements
that are in place with its employees.
For the purposes of
this review, overtime was defined as the premium paid for hours worked outside
the standard hours of work. Legal limits for both standard hours of work and
overtime premiums are governed by the ESA and the CLC. In Ontario, employers and employees are
legally bound to follow the minimum level of standards outlined in the ESA and
the CLC.
The ESA provides legal
guidelines for both employers and employees on a number of employment-related
issues including vacation pay, statutory holidays, emergency leave, hours of
work, and overtime.
In regards to overtime,
the ESA states the following:
“An employer shall pay an employee overtime pay of at least one and
one-half times his or her regular rate for each hour of work in excess of 44
hours in each week or, if another threshold is prescribed, that prescribed
threshold.”
The ESA provides:
·
The maximum number of hours an employee works without incurring
overtime, and
·
The minimum overtime pay rate for
overtime worked.
The CLC provides legal guidelines for both employers and employees on a number
of employment-related issues including standard hours of work, wages, holidays,
vacations, and overtime.
In
regards to standard hours of work and overtime, the CLC states the following:
·
171. (1) An employee may be employed in
excess of the standard hours of work but, subject to sections 172, 176 and 177,
and to any regulations made pursuant to section 175, the total hours that may
be worked by any employee in any week shall not exceed forty-eight hours in a
week or such fewer total number of hours as may be prescribed by the
regulations as maximum working hours in the industrial establishment in or in
connection with the operation of which the employee is employed; and
·
174. When an employee is required or
permitted to work in excess of the standard hours of work, the employee shall,
subject to any regulations made pursuant to section 175, be paid for the
overtime at a rate of wages not less than one and one-half times his regular
rate of wages.
As long as these ESA
and CLC thresholds are not compromised, employers and employees are free to
negotiate alternative overtime agreements.
At the City of Ottawa,
there are eleven (11) separate collective agreements in place and each has its
own specific overtime thresholds. It should be noted that some employees at the
City are not eligible for overtime payments and these employees are
predominately from the Management and Professional Exempt (MPE) group. A
summary of the City’s overtime guidelines, by collective agreement, can be
found in Appendix A.
The scope of this
overtime review consisted of the following activities:
• Reviewed previous audits and reviews of overtime expenditures;
• Conducted a branch-by-branch review of overtime expenditures for the past three years. For each branch the review included the following elements:
o
Analysis of
budgeted overtime and actual overtime expenditures;
o
Analysis of
discretionary overtime versus non-discretionary overtime;
o
Determination of
true overtime costs versus shift premiums or pay for statutory holidays;
o
Analysis of
overtime due to absenteeism;
o
Documentation of
the processes in place to record, track, manage, and control overtime and the
effectiveness of the processes;
o
Identification of
situations where the use of overtime is more cost-beneficial than hiring
additional FTEs; and
o
Identification of
opportunities to decrease overtime expenditures.
• Provided an overall assessment of the City’s use of overtime with recommendations for improvement; and
• Provided a summary of overtime policies within each branch and recommendations for improving the policy framework.
Thirty-one (31) City branches were included in this review as listed in
the table below. Police Services was not included in the scope of this review.
|
Department |
Branch |
|
Community and Protective Services |
· By-Law Services |
|
· Parks and Recreation |
|
|
· Office of Emergency Management |
|
|
· Employment and Financial Assistance |
|
|
· Fire Services |
|
|
· Library Services |
|
|
· Housing |
|
|
· Cultural Services and Community Funding |
|
|
· Long Term Care |
|
|
· Paramedic Services |
|
|
· Public Health |
|
|
City Manager’s Office |
· Corporate Communications |
|
· Corporate Planning and Performance Reporting |
|
|
· Policy Coordination and Outreach |
|
|
Corporate Services Department |
· City Clerk |
|
· Client Services and Public Information |
|
|
· Employee Services |
|
|
· Financial Services |
|
|
· Information Technology Services |
|
|
· Legal Services |
|
|
· Real Property Asset Management |
|
|
Planning
and Growth Management |
· Building Services |
|
· Economic Development and Strategic Projects |
|
|
· Planning, Environment and Infrastructure Policy |
|
|
· Planning and Infrastructure Approvals |
|
|
Public Works and Services |
· Fleet Services |
|
· Infrastructure Services |
|
|
· Surface Operations |
|
|
· Traffic and Parking Operations |
|
|
· Transit Services |
|
|
· Utility Services |
Figure 1
– City branches
included in the review
The City branches
listed above deliver a wide range of services to the public and/or internally
to support City staff. As a result, the branches are diverse in terms of
functions performed and in terms of operational pressures that may impact the
use of overtime. Some of the more significant differences across branches
include:
• The size of the branch including:
o
The number of
programs managed;
o
The number of full-time
equivalents (FTE’s); and
o
The size of the
operational budgets.
• The operating characteristics of the branch including:
o
24 hours, 7 days
per week (24/7) operations;
o
Mostly unionized
environment;
o
Direct service to
the public;
o
Direct front-line
emergency operations; and
o
Administrative
support functions.
This project was conducted in four phases, as outlined in the diagram
below, and included ongoing project planning and management activities
throughout the project:


The major activities
and work undertaken for each phase of the project were as follows:
• Conducted project start-up activities to confirm the objectives, scope, approach and timelines for the review;
• Gathered and reviewed existing documentation (see Appendix C for details);
• Reviewed and analyzed overtime expenditure data extracted from the SAP system (see Appendix B for details);
• Conducted interviews with relevant stakeholders including: Payroll, Labour Relations, Occupational Health and Safety, and Financial Support Unit (FSU) Managers (see Appendix D for details);
• Conducted interviews and validated interview responses with each of the branch directors (see Appendix D for details); and
•
Documented preliminary findings and identified key issues and
drivers related to overtime usage that required further analysis in Phase 2 of
the project.
• Conducted interviews with FSU Managers from selected branches (see Appendix D for details); and
• Reviewed and synthesized data collected from documentation review, SAP data, and interviews.
• Documented the key findings from the detailed analysis and identified preliminary solutions and recommendations with the project team regarding the usage of overtime; and
• Drafted the interim report.
• Validated the interim report with relevant City stakeholders and followed-up on common questions and feedback; and
• Drafted and submitted this final report.
This section identifies
the key facts and data pertinent to the use of overtime across all City
branches covered in the scope of this review and provides an analysis of the
key corporate-wide findings. The information and data collected for this review
was obtained through extensive interviews and a comprehensive analysis of
available data from the SAP system. The examination of the data provided the
quantitative analysis of overtime, while the interviews with directors and key
stakeholders provided the operational context for overtime usage.
Interviews were
conducted with key City stakeholders, Financial Support
Unit (FSU) Account Managers, and
with twenty-nine (29) branch directors (see Appendix D for a detailed list of
interviews). Two branches (Corporate Planning and Performance Reporting, Policy
Coordination and Outreach) were not interviewed for this project based on the
fact that these branches have mostly Management and Professional Exempt (MPE)
staff and very little or no overtime usage.
The interviews provided
information on:
• Operational and other pressures that resulted in overtime usage;
• Policies and procedures that are in use to budget, manage and control overtime;
• Technology and systems used to track and manage overtime;
• Initiatives that are in place to improve the management of overtime; and
• The SAP overtime data.
The analysis of data
from SAP provided information on:
• Overtime budgets for the City and each of the City’s branches;
• Actual overtime spent by the City and each of the City’s branches;
• Overtime spent on statutory holidays; and
• Absenteeism days per employee in each branch.
This section presents a
summary of the data and information collected from the interviews and data
analysis activities, including:
§
A summary
analysis of overtime expenditures by branch;
§
An overview of
the overtime processes used to record, track, manage, and control overtime; and
§
The
identification of key overtime drivers including an assessment of absenteeism
and it’s potential impact on overtime and the identification of situations
where overtime is more cost-beneficial than hiring additional FTE’s.
Only SAP data from 2003
onward was analyzed as part of the review. It was determined that the integrity
of data from prior years was not sufficient to enable an accurate assessment
and comparison to the more recent data.
The following figure presents the total actual overtime expenditures for the City over the past three years compared to the planned overtime budgets. This analysis provides an indication of how overtime spending is changing over time, what the actual overtime spending levels are and how well overtime is being budgeted.
Figure 2 – Total expenditures versus budgeted overtime for the years 2003, 2004 and 2005
The following
observations can be made from an analysis of the summary data:
• The average amount spent on overtime over the past three years has been $29.3 million;
• Overtime expenditures during this period have varied by less than 6% ($1.75 million) from the average indicating a relatively stable and consistent level of overtime usage;
• Overall overtime spending has remained stable despite an increase in compensation and overtime costs of approximately 3% per annum. This indicates that the use of overtime (actual number of overtime hours) has been decreasing over the past three (3) years.
•
The variance between actual overtime and budgeted
overtime has decreased from 104% in 2003 to 49% in 2005; and
•
While the budgeting for overtime has improved over the
past three years, a variance of 49% is significant.
The following figure
depicts the actual overtime expenditures for each branch for 2005.
Figure 3 – Overtime expenditures for all branches (2005)
The following observations can be made from the
analysis of the branch-level data:
• The nine (9) branches with the highest use of overtime account for over 90% of the City’s overtime costs;
• Each of the nine (9) branches with the highest use of overtime incur over $1 million in overtime expenditures per year; and
• The other twenty-two (22) branches incur relatively low expenditures on overtime (with an average of $125,000 for 2005). The branch with the next highest use of overtime has just over $400,000 in overtime expenditures.
The following table presents the actual versus planned overtime for all
branches over the past three years. The sections that follow provide more
detailed analyses of this data.
Figure 4 - Actual versus planned
overtime for all branches for the years 2003, 2004 and 2005*
* The total overtime costs for 2005 do not correspond exactly to the data provided by the City (i.e. $28,817,131 versus $28,920,453). The basis for this discrepancy of approximately $100,000 is that the analyses provided in Figure 4, and throughout this report, are limited to the thirty-one (31) branches that were included in the original scope for this Review. This discrepancy is due to the exclusion of the following City branches/divisions from the scope of the review:
• Elected Officials;
• Office of the City Auditor General;
• Committee of Adjustment;
• Corporate Services – Office of the Chief Corporate Services Officer;
• Planning & Growth Management Services – Office of the Deputy City Manager;
• Community & Protective Services – Office of the Deputy City Manager; and
• Public Works & Services – Office of the Deputy City Manager.
The following table presents an analysis of the variance between actual
overtime expenditures and the overtime budget for 2005. The table identifies
the variance of actual overtime to budget and therefore highlights the degree
to which actual expenditures exceeded budget for each branch.

Figure 5
- Variance between actual overtime versus planned overtime for all branches
(2005)
The following
observations can be made from the review of the branch overtime expenditure
data:
• Only five (5) of the thirty-one (31) branches reviewed were under budget in 2005, suggesting that budgeting for overtime is an issue in most branches of the City;
• Budget variances in many branches are substantial (greater than 50%) indicating that the base overtime budgets for most of the branches do not accurately reflect current overtime requirements;
• Eight (8) of the thirty-one (31) branches did not have an overtime base budget although seven (7) of these eight (8) branches incurred overtime expenditures in 2005; and
• *The Office of Emergency Management had a very high variance of 4124% due to the additional overtime costs related to the Kashechewan evacuation in 2005.
The total overtime
expenditures for each branch can be analyzed with respect to key
characteristics of the branch mandate and operations. Key characteristics of
the operations of each branch, the FTE count and the type of services they
provide are presented in the following table.
Figure 6
– Actual overtime, budgeted FTE’s, and operational characteristics for all
branches (2005)
The following
observations can be made from the analysis of overtime usage at the branch
level:
• Eight (8) out of the nine (9) branches with the highest use of overtime are 24/7 operations. The use of overtime is a common requirement for most branches with 24/7 operations and is used to meet levels of service and to address related staff deployment constraints and challenges;
• Eight (8) out of the nine (9) branches with the highest use of overtime provide citizen-facing services. Front-line operations create a greater need for overtime usage to meet levels of service expectations and requirements; and
• Many of the branches with the highest use of overtime are also those with the most FTEs. The nine (9) branches with the highest use of overtime (representing over 90% of total overtime expenditures for the City) comprise over 55% percent of budgeted FTEs and have an average of almost 700 FTEs versus an average of 237 FTEs for all the other branches.
To enable the
comparison of overtime expenditures across branches of varying size, the
overtime cost per budgeted FTE was analyzed. The following figure presents the
overtime expenditure per FTE for 2005.
* Office of Emergency Management had overtime costs per employee of
$25,000.
Figure
7 - Average overtime
cost per FTE for all branches (2005)
The following
observations can be made from the analysis of overtime costs per FTE:
• Seven (7) of the nine (9) branches with the highest use of overtime also have above average overtime costs per FTE;
• The average overtime cost per FTE was $2,624 in 2005; and
• The nine (9) branches with the highest use of overtime had an average cost per FTE of $4,185, indicating a higher reliance on overtime.
Another way to compare overtime expenditures across branches of varying
sizes is to analyze the overtime expenditures relative to the overall
compensation budget. The following figure presents the overtime expenditures as
a percentage of the total compensation budget for 2005.
* Office of Emergency Management had overtime costs that were
19.88% of their compensation budget.
Figure 8 – Overtime expenditures as a percentage of total compensation budget (2005)
The following
observations can be made from an analysis of the branch level compensation
budgets:
• For the thirty-one (31) branches reviewed, overtime consisted of approximately 4% of the total compensation budget of $757 million; and
• For the nine (9) branches with the highest use of overtime, overtime made up approximately 6% of the total compensation budget.
Overtime policies provide employees with
directives when overtime can and should be used, the processes for having
overtime approved, and how overtime should be recorded. The following five
(5) branches have written overtime policies and/or guidelines in place
with varying degrees of detail and formality:
• Fire Services;
• Paramedic Services;
• Planning and Infrastructure Approvals;
• Transit Services; and
• Utility Services.
The remaining branches do not have documented
polices in place. In some cases, informal overtime practices are in place but
they are not documented.
The procedures for recording, tracking, managing and controlling overtime were identified and analyzed across the branches.
The majority of the
branches use data from SAP to record and track overtime. Due to the way SAP is
currently configured and the many unique operations within the City, some
branches have decided to use additional SAP modules or other supplementary
systems that enhance the ability to track and analyze overtime.
Most branches use
similar procedures to record, track and manage overtime usage, as follows:
• Employee receives approval from appropriate authority to incur overtime;
• Employee fills in an exception time-sheet or activity sheet, depending on the branch, when overtime is incurred;
• The appropriate supervisor (title may vary, depending on role) signs the exception time-sheet or activity sheet;
• Payroll enters overtime information into SAP;
• The FSU managers access overtime data in SAP and provide reports to branch directors and division managers; and
• Directors and managers use the FSU reports to help track and manage the overtime usage for their branch or division.
Using the reports
provided by the FSU managers, division managers can compare the actual overtime
expenditures to budget, and assess overtime trends over time/by division/and at
the employee level. Analysis of overtime drivers is not supported by data or
reports from the SAP system. The cause for incurring overtime is not typically
included on exception and activity sheets, and SAP is not currently configured
to track causes for overtime usage.
As was previously
mentioned, a number of branches have systems in place that enable the tracking
and analysis of the drivers of overtime. The following table provides three
examples of systems that are being used to supplement the standard overtime
procedure outlined above.
|
Branch |
System |
|
Fire Services |
· Fire Services utilizes a supplementary MS Excel-based tool in addition to SAP to track reasons for overtime usage · Data is entered into spreadsheet twice a day and overtime usage is reviewed on a weekly basis · Allows Fire Services to do a more detailed analysis of the usage of overtime and react accordingly |
|
Paramedic Services |
· The Paramedic Services branch utilizes the Telestaff system, a web-based scheduling tool, to support resource management. This system also tracks overtime, using the same overtime codes as SAP. The system provides for additional data to be captured to enable tracking overtime usage more effectively · There are overtime rules built into the Telestaff software system that control overtime use. For example, if an employee wants to take a day off, Telestaff will identify if overtime will be incurred as a result |
|
Real Property Asset
Management |
·
The Real Property Asset
Management branch utilizes the Plant Maintenance (PM) module of SAP. While
this module is primarily used for operational purposes, it allows the branch
to track reasons for overtime usage. When requesting payment for overtime,
employees in the branch must identify the reason overtime was used and this
information is then entered into SAP |
Figure 9
- Examples of systems to supplement standard overtime procedures
Overtime causes and
other overtime considerations were reviewed and analyzed as part of this review
and included the following areas:
·
Overtime drivers
across branches;
·
Overtime due to
discretionary versus non-discretionary circumstances;
·
Overtime due to
absenteeism;
·
Overtime due to
shift premiums and statutory holidays;
·
Overtime used
because it is more economical than hiring extra FTEs;
·
Results of the
previous Transit Operator Establishment Review; and
·
Other overtime
considerations.
Data on the causes/drivers of
overtime usage are not tracked, nor available, through SAP for most of the
branches. As a result, identifying the precise causality between overtime
drivers and a specific proportion of the total overtime expenditures is not
currently possible. Accordingly,
overtime drivers were identified based on the data collected and interviews
with branch management.
The most
significant/common drivers of overtime usage across the branches included:
• Deadline requirements;
• Periodic high service level demands;
• Planned events;
• Special projects;
• Unforeseen/unplanned events; and
• Vacancies.
Other significant, but less frequently
identified, drivers of overtime usage across the branches included:
• Absenteeism;
• Public consultation;
• Requests from Council;
• Services provided outside of regular hours of work; and
• Statutory holidays.
It was determined that there were approximately eleven (11) primary drivers of overtime. These overtime drivers are listed and defined in the table below.
|
Overtime Cause |
Definition |
Examples |
|
Absenteeism |
Overtime is used to accommodate for absent employees |
·
To make-up for
employees on sick leave or on vacation |
|
Deadline Requirements |
Overtime is used to accelerate a project to meet a
deadline |
·
Budget preparation |
|
Periodic High Service Level Demands |
Overtime is used to meet higher than normal service
demands |
·
Meeting an influx of
service requests ·
Maintaining service
levels at busier times of the year |
|
Planned
Events |
Overtime is used for a scheduled event that can be
planned for at the beginning of the year |
·
Blues Fest ·
Tulip Fest |
|
Public Consultation |
Overtime is used for consulting with the public
during non-regular hours of work |
·
Attending public
consultation meetings/assemblies in the evening |
|
Requests from Council |
Overtime is used to accommodate a Council member’s
special request |
·
Attending meetings
outside of the regular hours of work |
|
Services Provided Outside of Regular Hours of Work |
Overtime is used to meet service demands outside of
the regular hours of work |
·
Public health
activities done in the evenings and weekends |
|
Special Projects |
Overtime is used to complete a project but doesn’t
justify the hiring of additional FTEs |
·
Rural Summit |
|
Stat Holidays |
Overtime that results from City employees working on
statutory holidays |
·
Good Friday ·
Canada Day |
|
Unforeseen/Unplanned Events |
Overtime is used for impromptu events that were not
scheduled and could not be planned for at the beginning of the year |
·
Demonstrations ·
Emergency events ·
Storms/weather |
|
Vacancies |
Overtime is used to make-up for a shortfall in staff
due to vacant positions |
·
Vacancies due to hiring
freeze ·
Inability to fill
positions with qualified workers |
In order to determine the proportion of discretionary versus non-discretionary overtime used across the branches, definitions were developed for the purpose of this review. Branch directors and managers were asked to categorize the overtime drivers into either discretionary or non-discretionary overtime.
• Discretionary overtime - there is a choice as to whether to allow overtime or not (e.g. adding resources at overtime rates to accelerate a project, etc.); and
•
Non-discretionary overtime - there
is no choice, or no other options, but to allow overtime (e.g. in order to
protect public health and the environment, protect City assets, and/or to
prevent loss of essential services to the public, etc.).
Although there was
agreement on these preliminary definitions, the need for overtime is often
based on multiple factors that cannot be adequately delineated into two
discrete definitions. Identifying the drivers of overtime as either
discretionary or non-discretionary overtime isn’t always a clear-cut decision
and differs based on the operational pressures of the different branches.
Examples of overtime causes that were identified as clearly
discretionary or non-discretionary are outlined in the table below:
|
Discretionary
|
Non-Discretionary
|
|
· Accelerating a project through the use of overtime |
· Responding to emergencies |
|
·
Covering for planned vacancies through the use of
overtime (e.g. vacancies caused by vacation time or a reorganization) |
· Meeting legislatively-mandated service levels |
Figure 11 - Examples of overtime
causes identified as discretionary or non-discretionary
There are many cases where categorizing
overtime as either discretionary or non-discretionary was viewed as
substantially more challenging for City managers. For example, the overtime
that results from the following pressures was often cited by City managers as
being more difficult to classify as discretionary:
• Addressing special requests or urgent inquiries from councillors or constituents that require timely responses often results in the need for overtime. City managers generally felt obligated to take action on such requests as an operational priority.
• Maintaining service levels for the wide range of services provided by the City can be affected by unforeseeable operational pressures that often require overtime expenditures. City managers are faced with difficult choices about when a branch can reduce service levels to keep within its overtime budget or to reduce overtime spending (which will impact the service levels).
With the exception of Utility Services, none of
the branches have a formal documented list categorizing the causes/drivers of
overtime usage as either discretionary or non-discretionary.
Most of the branches
do not currently have the capability for tracking the causes/drivers of
overtime usage in SAP and therefore are unable to track and categorize the
overall causes of overtime as either discretionary or non-discretionary.
For
the purpose of this review, the branches were asked to identify which overtime
drivers were discretionary, non-discretionary, or a combination (both
discretionary and non-discretionary).
The branches initially categorized the proportion of overtime drivers as
follows: 12% were discretionary, 58% were non-discretionary, and 30% were a
combination[2]. This combined category was then re-allocated
to the discretionary and non-discretionary categories using the similar ratio
of the former categories (12:58 – discretionary:non-discretionary). After re-allocating the combined category,
the revised proportion of overtime drivers that are discretionary is 18% and
the revised proportion of overtime drivers that are non-discretionary is 82%.
Based on the information collected, and
adjustments made for the purposes of this report, the proportion of
discretionary overtime drivers versus non-discretionary drivers across branches
is as follows:
|
Discretionary Overtime Drivers |
18% |
|
Non-Discretionary Overtime Drivers |
82% |
Figure 12 – Proportion of discretionary overtime versus non-discretionary overtime
Absenteeism was identified as a driver of
overtime usage for select branches in both the Audit Committee’s 2002 Audit, as
well as, the 2005 Auditor General’s Audit of Overtime. Unplanned absenteeism is
identified as a potential driver of overtime as it can lead to the use of
overtime to compensate for staff shortages and to maintain service levels.
The following figure
presents a comparison of absenteeism rates to the total overtime expenditures
in each branch.
Figure 13 – Absenteeism rates against total overtime expenditures for all branches (2005)
The following
observations can be made from the analysis of the branch-level data:
• The average absenteeism rate for 2005 was 10.3 days per employee compared to 11.1 days in 2004 (a decrease of approximately 7%);
• The degree of correlation between absenteeism and overtime use across the City is relatively low;
• There is a slightly stronger correlation between absenteeism and overtime use in the branches with the highest use of overtime:
o The average absenteeism rate per employee for the nine (9) branches with the highest use of overtime was 11.31 days/employee, 9.6% higher than the average for all branches; and
o The average absenteeism rate per employee for the five (5) branches with the highest use of overtime was 12.6 days/employee, 22% higher than the average for all branches.
Most branches do not
capture and track the causes of overtime in SAP, therefore it was not possible
to further quantify an actual percentage of overtime due to absenteeism. Further investigation and analysis could be
undertaken to more precisely determine the impact of absenteeism on overtime. In the future, tracking the causes of
overtime would help the City to determine if specific actions would be
warranted to address such an impact.
A shift premium is a
premium paid in addition to an employee's regular hourly rate in recognition of
hours worked during non-core business hours. Shift premiums vary and are
prescribed in each of the collective agreements
To analyze the costs of
true overtime versus the costs of shift premiums, SAP overtime data was
analyzed and the procedures used by the Payroll division and FSU managers were
examined. It was determined that shift premiums are classified separately from
overtime and are not included in the overtime costs reported by the City.
City employees that are
required to work on statutory holidays may be entitled to receive a premium
from the regular rate of pay.
SAP overtime data was analyzed to identify the percentage of overtime expenditures that resulted from premiums paid for working on statutory holidays. The following figure identifies the total cost of overtime premiums paid for working on statutory holidays as a percentage of total overtime expenditures (for branches where statutory holiday overtime contributed more than 5% of total overtime expenditures).
For branches where
statutory holiday overtime contributed more than 5% of total overtime
expenditures.
Figure 14 – Statutory holiday
overtime as a percentage of total overtime (2005)
The following
observations can be made from the analysis of the branch-level data and
interviews:
· Overtime costs on statutory holidays accounted for 9% of the City’s total overtime costs in 2005; and
·
It was also
determined during this review that for some branches, statutory holiday pay
premiums were being incorrectly coded in the SAP system:
o
As a result,
overtime expenditures for 2005 were overstated by over $1 million. If statutory holiday overtime was reported
consistently and/or correctly across the branches then total overtime on
statutory holidays would decrease approximately 55%, from $2.7 million to $1.2
million; and
o
It should be noted that the Payroll division reported that this did not
result in any employees being overpaid for working on a statutory holiday.
In most cases where
overtime expenditures are required, it can be determined over a period of time
whether the use of overtime would be more or less cost-effective than hiring
additional full time employees that would be paid at regular wage rates.
During this review, an
analysis was done of the branch practices that are in place to evaluate the
cost effectiveness of using overtime versus hiring additional FTEs to meet
service needs. The findings from this analysis are summarized as follows:
• Most branches have not done a formal review or analysis in this area and most do not have practices in place to periodically review the most cost-effective level of overtime use versus the use of additional FTEs;
• Nonetheless, many City managers were confident that the use of overtime in their branches was less expensive than using additional FTEs;
• Situations where the use of overtime may reduce operating costs relative to hiring additional FTEs include:
o
Accommodating
higher than average service requirements (e.g. seasonal and occasional peaks in
demand, etc.); and
o
Addressing
temporary vacancies within an organization where staffing actions are pending.
• The additional cost of using overtime versus hiring extra FTEs may also be somewhat offset by the fact that no additional benefit costs are incurred when using existing employees at an overtime rate of pay, whereas additional employees would increase the total benefit costs.
In 2004, the City commissioned the Transit Operator Establishment Review that evaluated overtime usage for Transit Services. This study concluded that in some cases it was more cost-effective to use overtime rather than to establish a higher FTE head-count.
Some of the key findings and recommendations
from this study included the following:
• The use of some overtime, especially on Sundays, cost less than regular wages due to additional benefit costs and Sunday shift premiums for regular wages;
• Transit Services should decrease time for recruiting and training, reduce time for other assignments and reduce the use of extensions (i.e. work days that are extended by traffic, accidents, etc.);
• Contractual overtime was inevitable without changes to the collective agreement or allocation of work to “pieces”; and
• The ratio of overtime hours to regular service hours should be increased from 5% to 8.7%. Transit Services responded with revising this percentage to 6.5% as they felt it was more appropriate to implement an incremental approach to increasing overtime hours. Transit Services will re-evaluate this percentage as they increase it over time.
The implementation of
recommendations from this study, as well as, the implementation of
recommendations from the Audit of Overtime Costs (2002) has contributed to Income Protection Plan (IPP)/Sick Benefit premium savings of approximately $400,000 when
comparing Q1 of 2006 to Q1 of 2005, as reported by Transit Services.
The scope of this
Branch-by-Branch Overtime Review did not include a comprehensive audit of all
of the factors affecting the identified savings achieved by the branch in the
past year. Nonetheless, the
recommendations of this previous study were relevant and appropriate and are
generally being implemented in the branch.
In particular, some of the study’s recommendations such as improving
attendance, reviewing collective agreement conditions, and controlling
extensions should be direct contributors to achieving reductions in overtime in
the future. In addition, since Transit
Services has by far the highest overtime costs of any City branch, any
improvements in the reduction of overtime usage in this branch should provide
significant reductions for the City’s overall overtime expenditures.
The timing and
scheduling of employee vacations was also identified as a possible driver of
overtime usage. Due to the timing of vacations, and the number of employees
that request vacation time-off during peak times (i.e. summer, Christmas and
spring break vacation periods), there is the potential for increased usage of
overtime to cover for vacationing employees. Although it was not possible
within the scope of this project to analyze vacation schedules for all the
branches, it should be incumbent upon each branch to manage and schedule
vacations appropriately around peak vacation times.
The effect of vacation
schedules on overtime usage could be further studied across the City. This
again would require further detailed analysis of scheduling, collective
agreements, and would require the development of tools and/or methods to track
this causality.
Most branches have multiple collective agreements that govern overtime usage within the branch. This requires branch management to have a thorough understanding of the provisions of these agreements and their effect on overtime usage within their branch.
The correlation of overtime usage with collective agreements (either problematic provisions and/or inconsistent interpretation of collective agreements) was not found to be a significant issue for most branches, as a result of this review. In any case, it should be noted that all of the branch’s collective agreements pay overtime premiums once normal daily and/or weekly hours are reached and all of these thresholds are below the mandatory level as specified in the Employment Standards Act (ESA) and the Canada Labour Code (CLC), which require organizations to pay overtime after 44 hours (ESA) and after 48 hours (CLC) are worked in a week.
The following points are the most salient observations that arise from
the analysis of the findings:
· Total overtime expenditures for the City in 2005 were $28.8 million (excluding Police Services) and $32.8 million (including Police Services);
· Overtime expenditures account for approximately 4% of the total compensation budget and for branches with the highest use of overtime, the total overtime expenditures are approximately 6% of the total compensation budget;
· Twenty-two (22) of the thirty-one (31) branches incur relatively low expenditures on overtime, with an average of $125,000 for 2005, while the remaining nine (9) branches each incurred over $1 million in overtime expenditures for 2005;
· 90% of the City’s overtime spending is accounted for by nine (9) of the thirty-one (31) branches;
· As would be expected, higher overtime expenditures are generally associated with branches that have front-line operations. Front-line operations create a greater need for overtime usage to meet levels of service expectations and requirements. Most of the nine (9) branches that spent over $1 million each in overtime have 24/7 operations and provide citizen-facing services;
· The variance between the City’s planned and actual overtime has been substantial over the past three (3) years. While the variance has improved from 2003 to 2005, the overtime incurred in 2005 was still 49% over budget. All but five (5) branches were over budget in 2005;
· Budget variances in many branches are substantial (greater than 50%) indicating that the base overtime budgets for most of the branches do not accurately reflect current overtime requirements;
· The degree of correlation between absenteeism and overtime use across the city is low, although there is a slightly stronger correlation between absenteeism and overtime use in the branches with the highest use of overtime. The average annual absenteeism rate per employee for the five (5) branches with the highest use of overtime was 12.6 days/employee, as compared to the 10.3 days/employee average for the City;
· Overtime pay on statutory holidays accounted for 9% of the City’s total overtime costs in 2005;
• For all statutory holidays worked in 2005, the Payroll division has identified several issues and inconsistencies with the coding for the statutory holidays, which are currently being reviewed. If statutory holiday overtime was coded/reported consistently across the branches then the actual overtime costs on statutory holidays would decrease approximately 55%, from $2.7 million to $1.2 million;
• Overtime policies and procedures are not consistent across the City and in many cases documented policies and procedures are not in place;
• Most branches do not have a formal system in place to track the causes of overtime which can lead to problems in analysing and managing overtime usage;
• For this review, the key drivers of overtime were identified and categorized as discretionary and non-discretionary overtime (discretionary overtime was defined as “there is a choice as to whether to allow overtime or not” and non-discretionary overtime was defined as “there is no choice, or no other options, but to allow overtime”). The proportion of the overtime drivers was determined to be 82% non-discretionary overtime and 18% discretionary overtime[3];
• The most common drivers of overtime across all branches included unforeseen/unplanned events, planned events, deadline requirements, periodic high service level demands, vacancies, and special projects. Less frequently identified drivers of overtime included absenteeism, statutory holidays, requests from council, public consultation, and services provided outside of regular hours; and
• The use of overtime is, in many cases, a cost-effective means to maintain service levels.
This
section provides a detailed analysis of some of the findings and issues with
respect to the usage of overtime and identifies recommendations to improve the
overall management of overtime across the City.
There are five (5) key elements to the effective management of overtime expenditures and these elements include: overtime policies and procedures, overtime budgeting, overtime management and control, overtime recording/coding, and overtime tracking and reporting.
Overtime
policies and procedures provide overall guidance and direction for the
effective management of overtime by City managers. Effective management of
overtime usage begins with overtime budgeting and is monitored through the
management and control activities. Overtime must also be appropriately recorded
and coded so that it can be accurately tracked and reported. The following
diagram provides a graphical flow chart of this management process:
The following section
provides more detailed analysis of specific findings and recommendations for
improvement for each of these overtime elements.
Overtime
policies and procedures are areas for improvement across the City. Overtime policy and procedure issues were identified in the
following areas:
• There is a lack of formal and documented overtime policies across most branches. This can lead to lack of clarity on overtime policies and inconsistency in practice with regard to overtime usage and management; and
• There is a lack of formal and documented overtime procedures across most branches. This can lead to unclear guidelines for City managers and inconsistent controls of overtime usage.
There
is a mixed use of informal and formal and documented overtime policies. Many
branches have no formal overtime policies. Several branches refer to the
relevant collective agreements to guide overtime policies and some branches
have formal and documented overtime policies (i.e. Utility Services - Overtime
Policy/Procedure document, Paramedic Services – Policy and Procedure Manual,
Fire Services- Fire Services Policies Book, etc.).
There
are also differences across the branches in terms of the use of formal and
documented overtime procedures. Some branches have no formal and documented
procedures while others have some level of documented procedures. Many branches
reported that they had overtime procedures although they were not formally
documented.
To
enable consistent overtime practices to be applied within a branch, it is
necessary to have formal and documented policies and procedures. This ensures
that there is consistency for the application of overtime and that there are
clear procedures for coding and tracking overtime. This would also provide
guidance to managers and staff to understand the situations where overtime should
be utilized and clarify the procedures for requesting and approving
overtime.
For the development of improved overtime policies and procedures, each branch should define and categorize potential overtime drivers into either discretionary or non-discretionary categories. This would ensure that there is consistency for utilizing overtime within and across branches. Several branches (e.g. Utility Services, Paramedic Services, etc.) have also determined that it may be more appropriate to further define non-discretionary overtime into planned and unplanned categories. For example, Utility Services has established definitions for discretionary and non-discretionary overtime and planned and unplanned overtime. They have also developed guidelines for unplanned overtime and provide examples of situations where unplanned overtime would be justified.
A city-wide overtime policy should be developed that identifies the
overall policy direction for City managers with regard to the acceptable use of
overtime, the expectations of how City managers are to budget, manage and
control for the use of overtime, and the requirements for reporting on the use
of overtime in their branches and divisions.
City-wide overtime procedures should also be developed that address key
elements of the overall overtime process including defining discretionary
versus non-discretionary overtime, requesting and approving overtime, overtime
recording/coding, and overtime tracking and reporting. Some branches may need to further develop
branch-specific overtime procedures due to the greater complexity of their
operations.
Any
new overtime policies and/or procedures that are developed by the branches
should be reviewed and approved by the Deputy City Manager and/or the Executive
Management Committee (EMC) in order to ensure consistency across the City
branches.
• Recommendation 1 – Develop Overtime Policies – The Employee Services branch should develop a corporate-wide overtime policy. This policy should identify the overall direction for City managers with regard to the acceptable use of overtime, the expectations for how City managers are to budget, manage and control for the use of overtime, and the requirements for reporting on the use of overtime in their branches and divisions.
• Recommendation 2 – Develop Overtime Procedures – The Employee Services branch should develop corporate-wide overtime procedures. These procedures should include definitions of discretionary versus non-discretionary overtime, procedures for requesting and approving overtime, procedures for overtime recording/coding, and procedures for overtime tracking and reporting. Some branches may need to further develop branch-specific overtime procedures in order to address their specific operational requirements.
The overtime budgeting
process across the City is another key area for improvement. Overtime budgeting issues were identified in the base budgeting
process and in tracking and linking overtime directly to the revenue earned and/or
the costs recovered.
Base
budgeting process
The annual base budget
process does not usually accommodate for any increases to the overtime base
budget. This process also does not accurately reflect the required overtime
needs of a branch. This has led to continual variances between the planned and
actual overtime budgets for most branches, over the past three years.
In
order to develop the budget requirements for the upcoming year, the Financial
Planning branch sends out a request to the FSU Managers to have them meet with
their respective client departments to identify the budget pressures for the
upcoming year (both expenditure/revenue pressures and/or opportunities). These budget pressures are then reviewed by the
Executive Management Committee (EMC).
The final approved level of budget pressures are incorporated into the
draft operating budget which is then tabled with Council. Following extensive public consultation and review
by the City's Committee of the Whole, the budget is then approved by Council.
For many branches, budgeted
overtime provisions have not been maintained and/or do not reflect their
estimated needs. In 2005, only five (5) branches utilized less overtime than
their planned overtime budget. Problems with base budgeting has also resulted
in significant variances between the actual and planned overtime budgets across
most branches.
Several other branches (e.g. Library Services, Parks and Recreation, Cultural Services and Community Funding, etc.) have no planned overtime budget but do incur overtime costs due to operational needs.
An overtime base budget should be established for all branches that incur overtime expenditures in order to provide for more accurate budgeting and monitoring of overtime costs. It should also be noted that the 2005 Audit of Overtime Report stated that a “well-prepared budget can determine what is expected within an organization and help prepare its future”.
Revenue earned and cost recoveries are reported separately from expenditures in the budget and sometimes the association between the overtime that was worked to earn this revenue and/or for the costs recovered is not apparent. This can lead to inaccuracies in identifying true overtime costs as these costs may be offset by revenue earned and/or costs recovered.
Some
branches earn revenues and/or receive cost recoveries that offset the
corresponding costs of overtime usage. An example of revenue earned is staffing
paramedics at a hockey game (i.e. overtime would be paid for by the hockey
centre). An example of a cost recovery is that the CACC-Dispatch division
within Paramedic Services is funded by the Ministry of Health.
If the
revenue earned/cost recoveries and overtime were tracked together, the net cost
of overtime to the City would actually be lower than is currently being
reported on the overtime line item. To
more accurately identify overtime that is offset/balanced by revenue
earned/costs recovered versus true overtime costs, a separate cost code on
timesheets and in SAP should be developed to more accurately track overtime
directly linked to the revenue earned and/or the costs recovered.
• Recommendation 3 – Develop Overtime Base Budgets – Appropriate overtime base budgets need to be established and implemented in order to more accurately account for and justify the overtime requirements of the branches.
• Recommendation 4 – Adjust Overtime Base Budgets - For fiscal year 2006, each branch should be granted a one time base budget adjustment to more accurately reflect actual overtime costs. After this one time adjustment, further changes should be made on a case-by-case basis.
• Recommendation 5 – Track Overtime to Revenue Earned/Costs Recovered – New cost codes should be established on timesheets and in SAP to more accurately track and link overtime directly to the revenue earned and/or the costs recovered.
The
management and control of overtime is another area for improvement. Overtime management and control issues were identified in
the following area:
§
Inadequate branch service level
requirements have led to challenges in planning for and managing overtime.
The City branches provide a wide variety of services both externally to the public, as well as, internally to other branches. Service levels will vary depending on a number of factors including whether the service level is mandated or not.
Service levels have been established in the following areas:
• Services provided by some branches have service levels that are governed by provincial legislation (e.g. Utility Services, Building Services and Housing);
• Services provided by some branches have service levels that are Council directed (e.g. Surface Operations and Transit Services); and
• For those branches that primarily provide internally-focused services, there are service level agreements in place which outline, in detail, the level of service provided.
There are also some areas that lack clearly defined service levels
and include:
• Mayor and/or Councillor requests;
• Evening meetings; and
• Non-emergency after hour service requests.
While some service levels have been established and defined, other branches and/or areas have unclear or no service levels requirements. This lack of comprehensive service level requirements for branches results in:
• Additional uncertainty with the overtime base budgeting process;
• Difficulties in managing overtime expenditures while trying to maintain service levels; and
• Lack of clarity between the appropriate balance between maintaining service levels and overtime usage (i.e. for City Council, the public, etc.).
• Recommendation 6 – Define Service Levels – Service level requirements for each branch should be more clearly defined to enable branch management to more accurately plan for and manage overtime costs that are incurred to achieve targeted service levels.
The recording/coding of overtime is another area for improvement. Overtime recording/coding issues were identified
in the following area:
• For the recording of statutory holidays, the City is not treating the premium pay for working on a statutory holiday consistently throughout the organization. This inconsistency will have an impact on how overtime is being reported, managed, and controlled.
An overview of the overtime procedures, including recording and inputting overtime data into SAP, is described in the Findings section of this report.
For all statutory holidays worked in 2005, the Payroll division has identified several issues and inconsistencies with the coding for the statutory holidays. These coding inconsistencies will have an impact on how overtime is being reported. The Payroll division is doing a detailed review of the wage types that are utilized on a statutory holiday for all the unions and is working with Finance to ensure that the wage types are consistently mapped in the future.
This
overtime recording/coding issue has also led to discrepancies in analyzing the
impact of overtime on statutory holidays. If statutory holiday overtime was
reported consistently across the branches then total overtime on statutory
holidays would decrease approximately 55%, from $2.7M to $1.2M.
Consistent
overtime recording/coding needs to be implemented in order to ensure the
accurate control and management of overtime usage.
• Recommendation 7 – Record/Code Overtime – Common procedures for recording/coding of overtime should be implemented across all branches to ensure that overtime costs are being consistently tracked and reported. This recommendation includes:
o
Review and revise
the relevant handbooks to update codes, etc., as necessary; and
o
Communicate any
recording/coding issues, new codes, etc. through training and/or update
bulletins, as necessary.
The
tracking and reporting of overtime is another key area for improvement.
Overtime tracking and reporting issues were identified in the following area:
• Most branches do not have SAP modules/processes in place for tracking, analyzing, and reporting overtime causes and this can lead to challenges in planning and managing overtime.
Although
the SAP system is adequate for tracking actual overtime usage, the system is
limited in its analysis and reporting capabilities. This has resulted in
branches using and/or developing alternative systems or tools to manipulate SAP
data for ease of analysis and reporting. Currently the SAP system also has
limitations around the ability to track the actual causes of overtime usage.
Most
branches cannot track overtime causes in SAP. There is one additional SAP
module that can be added that allows for this capability. This module is called
Plant Maintenance (PM), which primarily tracks work
orders and the assets that these work orders are done against but it also has
the capability of tracking overtime causes. This module is used by a few
branches including Real Property Asset Management (RPAM) and Fleet Services but
is used primarily for other reasons (e.g. managing the life cycle of assets –
buildings, vehicles, etc.) rather than tracking overtime causes. The cost of
this module is fairly high and a cost benefit analysis would need to be
conducted before considering this module for other branches.
Some
branches have added additional systems, other than SAP, primarily to assist in
scheduling and tracking resources. Some of these systems also allow for more
detailed tracking of overtime costs. For example, Paramedic Services has
implemented the Telestaff system which is a web-based scheduling tool that also
tracks overtime. Telestaff uses the same overtime codes as SAP but breaks down
each code in more detail and can track overtime usage more effectively. Several
branches also employ other methods and tools to track overtime causes, e.g. MS
Excel.
The
majority of the branches also work with their FSU Account Manager to review and
analyze SAP data. The analysis of the overtime data consists primarily of the
budgeted versus actual overtime costs, budgeted versus actual total
compensation costs, and individual staff overtime usage. Although SAP access
has been granted to all branch directors and division managers, most branch
managers do not run their own SAP reports. Many of the reports and data from
SAP are not viewed as user-friendly and the information can be presented more clearly
once put into MS Excel. Most of the branch management have been trained on SAP
but FSU Account Managers acknowledge that SAP is not easy to use for anyone who
is not a regular user of the system. One recent improvement, that was
implemented in May, 2006, was to make some of the Human Resource (HR) and
Finance Reports available through the City’s intranet allowing users to bypass
the SAP system altogether. This includes one HR report that tracks overtime used
by employees.
Inconsistent
tracking, analysis, and reporting of overtime causes can lead to incomplete
overtime metrics which can lead to problems with the management of overtime
usage.
• Recommendation 8 - Track Overtime Causes – New cost codes should be established on timesheets and in SAP to track and report overtime causes.
Over 90% of the City of Ottawa’s overtime expenditures come from the following nine (9) branches:
• Transit Services;
• Fleet Services;
• Surface Operations;
• Utility Services;
• Paramedic Services;
• Real Property Asset Management;
• Traffic and Parking Operations;
• Infrastructure Services; and
• Fire Services.
There are a variety of reasons for these branches to have higher overtime spending requirements, including the type of services they provide (emergency services, 24/7 operations, etc.), as well as, the larger size of their operations relative to many of the other branches. With such a high concentration of overtime costs occurring in these branches, it is clear that to effect any meaningful changes in overall overtime spending the focus would have to be on these branches.
This section of the report provides a more in-depth review of overtime usage within each of these branches in order to identify opportunities for improvements. As well, a summary is provided for the other twenty-two (22) branches at the end of this section. For each branch, and for the other twenty-two (22) branches, this section provides the following information and analysis:
• An overview of the branch operations;
• Relevant overtime findings including: summary of overtime data; non-discretionary and discretionary overtime drivers; overtime policies and procedures; overtime tracking capabilities; overtime initiatives; collective agreements; and overtime cost recoveries.
• A summary assessment for each branch including areas of success, as well as, areas for improvement for overtime usage; and
• Branch-specific recommendations for improving overtime usage within the branch. Although most of the corporate-wide recommendations apply to these nine (9) branches as well, most of the corporate-wide recommendations will not be repeated in this section again.
Transit Services develops and maintains the City’s public transportation system. The branch’s key strategic objectives are to:
• Meet the mobility needs of residents, businesses, schools and visitors as envisioned by the Ottawa Transportation Master Plan; and
• To meet commitments in the Environmental Strategy.
Transit Services is a 24/7 operation that services the public directly. Key operational metrics for the branch include:
• Employs over 1,500 operators and 200 support personnel;
• Serves approximately 90 million passengers a year;
• Operates approximately 800 buses actively in service; and
• Provides over 220 bus routes to the greater-Ottawa area.
The table below summarizes
information relevant to the use of overtime in Transit Services for the year
2005.
|
Data |
Comments |
|
|
Overtime - Planned |
$6.46 million |
|
|
Overtime - Actual |
$10.44 million |
Above the City average of
$0.93 million |
|
Overtime - Variance
(Planned/Actual) |
62% |
Above the City average of
49% |
|
Overtime per FTE |
$5,963 |
Above the City average of
$2,624 |
|
Overtime - Percentage of
Compensation Budget |
9.1% |
Above the City average of
3.8% |
|
Absenteeism |
14.72 days/employee |
Above
the City average of 10.3 days/employee |
Figure 15
– Overtime data for Transit Services (2005)
Non-Discretionary Overtime
Drivers of non-discretionary overtime in Transit Services include the following:
· Service level requirements, vacancies, and absenteeism:
o
Service Level Requirements – Transit Services publishes
a transit schedule that the branch strives to meet with at least 99.5%
reliability. There are a number of
factors that can threaten the branch’s ability to meet this target, such as
absenteeism and vacancies. Transit
Services compensates for these operator shortages by using overtime. Other potential options, such as using a
pool of casual employees to backfill, cannot
be pursued by Transit Services due to collective agreements;
o
Vacancies – The
branch did not reach the approved FTE count for Bus Operators in 2005 because
of a hiring freeze and delays in recruiting; and
o
Absenteeism - Reasons for absenteeism in this branch
include sickness (daily, LTD, etc.), WSIB, unfilled vacancies, union time-off,
relief responsibilities (instructors, supervisors and dispatchers who are Bus
Operators in their substantive position), committee participation, training,
leaves-of absence, special permissions, bad weather, and attending committee
meetings.
· Special Provisions of the Collective Agreements – Collective agreements within Transit Services guarantees that newer/junior staff are allowed weekend time-off in an effort to improve their work-life balance. The weekend shifts that newer employees filled, at regular time, are now filled on a volunteer basis by senior operators. Senior operators are paid overtime for these weekend shifts, as these hours are over and above their regular weekly shifts. At the time that this provision was included in the collective agreement, it was estimated that the resulting overtime costs would be in excess of $700,000 per year;
• Extended bus shifts due to unforeseen factors (e.g. traffic, construction, weather, etc.);
• Special events – Transit Services may know ahead of time that a special event will occur but may not know the exact date/time, and this can then lead to overtime usage. This is considered a planned event but not a scheduled event;
• Emergency incidents;
• Low frequency routes (i.e. rural routes, etc.); and
• Last trip of the day situations.
Some of the causes of discretionary overtime in Transit Services include:
• New service requests, such as Census Route 10; and
• Backfilling for non-operator illness, such as a supervisor position.
Transit Services uses SAP in conjunction with the Work Management System (WMS) to track and report on overtime usage. WMS has the added functionality that allows Transit Services to maintain shift schedules, enter overtime caps to monitor allowable overtime hours, and to track the reasons for additional time being requested by operators.
· 2002 Audit of Overtime Costs – Some of the key recommendations from this Audit indicated several improvement areas in regards to overtime usage. They are summarized in the table below.
|
Recommendation |
Management Response |
|
· Enforce bi-weekly platform hour cap |
· Implemented an automated system to monitor and enforce cap in 2004 |
|
· Establish an overtime budget based on business requirements |
· Operator establishment was increased to reflect the approved service increases · Completed a comprehensive establishment review (KPMG Study) |
|
· Conduct a detailed analysis to demonstrate when the use of overtime is more cost effective than new hires |
· Completed the KPMG – Transit Operator Establishment Review in October 2004 |
|
· Reduce the use of extensions and develop guidelines for their use |
· Agreed and complied |
|
· Reduce absenteeism by two days per operator in the short-term |
· Agreed and reinstated medical certification requirement in April, 2005 |
Figure 16
– Previous audit results for Transit Services
• 2004 Transit Operator Establishment Review – The findings and recommendations from this study included the following:
o The use of some overtime, especially on Sundays, cost less than regular wages due to additional benefit costs and Sunday shift premiums for regular wages;
o Transit Services should decrease time for recruiting and training, reduce time for “other assignments” and reduce the use of extensions;
o Contractual overtime was inevitable without changes to the collective agreement or allocation of work to “pieces”; and
o The ratio of overtime hours to regular service hours should be increased from 5% to 8.7%. Transit Services responded with revising this percentage to 6.5% as they felt it was more appropriate to implement an incremental approach to increasing overtime hours. Transit Services will re-evaluate this percentage as they increase it over time.
The implementation of
recommendations from this study, and implementation of recommendations from the
Audit of Overtime Costs (2002), have contributed to Income
Protection Plan (IPP)/Sick Benefit premium savings of approximately $400,000 when comparing Q1 of 2006 to Q1 of
2005, as reported by Transit Services.
Current Initiatives to Improve
Overtime Usage:
·
Income Protection Plan (IPP)/Sick Benefit Eligibility –
The branch now requires all employees to provide
a physician’s note after more than 6+ sick days/year;
·
Attendance Improvement Program (AIP) – Tracking of staff that are off
greater than three (3) days per quarter and moving problematic personnel
through the six steps for non-culpable absenteeism;
·
Culpable absenteeism – Tracking staff that are establishing pattern
absenteeism and implementing progressive discipline;
·
Benchmarking –
The branch is looking at other transit organizations for best practices to
examine opportunities to improve overtime usage (i.e. implementing mobile
shifts, etc);
· Streamlined recruiting – A more efficient process has been initiated to decrease the amount of time it takes to fill a vacancy in the Bus Operator group;
· Backfilling positions – The branch is now able to hire full time staff to replace union executives who are in the office full-time, thus reducing the number of vacancies that need to be covered by overtime; and
· Leaves of Absence Requests – The branch no longer approves all requests for leaves of absence, especially if they would be shorthanded of staff.
Transit Services employees are
represented by the ATU 1760, ATU 279, and the CUPE 5500 collective
agreements. All of these collective
agreements pay overtime premiums once normal daily and/or weekly hours are
reached and all of these thresholds are below the mandatory level as specified
in the Employment Standards Act (ESA) and the Canada Labour Code (CLC), which
require organizations to pay overtime after 44 hours (ESA) and after 48 hours (CLC)
are worked in a week.
Transit Services receives some cost recoveries, under special circumstances, but these cost recoveries do not make up a significant percentage of overtime costs for the branch. An example of a cost recovery that was received by Transit Services was for the additional service that was provided for the extra routes added for census workers. This additional service resulted in overtime expenditures although some cost recoveries were received from the Federal Government for these services provided by the branch.
Transit Services are currently implementing a number of overtime initiatives that should improve overtime usage, such as streamlining recruitment, conducting benchmarking studies, requiring a physician’s note after 6+ sick days (for IPP), and implementing the AIP to reduce absenteeism.
Transit Services main drivers of overtime appear to be absenteeism and vacancies and the resulting potential impact on service levels as well as relevant provisions of the collective agreements. Any reductions in overtime would have to come from improving absenteeism and filling vacancies, reducing service levels, and/or implementing alterations to the collective agreements. While it is recognized that lowering service levels will result in some resistance from the public and that proposed changes to the collective agreements will be met with significant resistance from the unions, these options should be evaluated due to the potential overtime cost savings.
· Recommendation 1 – Reduce Absenteeism – Transit Services should continue to focus on reducing absenteeism.
· Recommendation 2 – Improve Process to Fill Vacancies – Transit Services should continue to focus on improving its process for recruiting and filling vacancies for Bus Operators.
· Recommendation 3 – Review Target Service Levels on Overtime – Transit Services should review target service level of 99.5% against similar organizations so they can assess the appropriateness of this targeted service-level benchmark.
· Recommendation 4 – Review Collective Agreements – Transit Services should consider re-negotiating the collective agreements in regards to the use of overtime on weekends by senior staff.
Fleet Services supports the equipment needs of the City by providing equipment management services and advice to City departments so they can make efficient use of the existing equipment and infrastructure.
The branch’s major services include fleet maintenance, life-cycle management, and operations:
· Fleet maintenance services include the general maintenance, inspection, and repair of City vehicles and equipment;
· Life-cycle management services includes the development of vehicle and equipment acquisition plans and support programs, the optimization of replacement cycles, the development of new specifications, monitoring adherence to standards and performing safety investigations, and coordinating initiatives to reduce emissions and environmental impacts of the City vehicle and equipment pool; and
· Operations services include managing the City’s vehicle operator training, fuel management, operating and managing an integrated vehicle and equipment management information system, as well as, all other operational and administrative activities related to the daily operation of the City’s vehicle and equipment pool.
The table below summarizes
information relevant to the use of overtime in Fleet Services for the year 2005.
|
Data |
Comments |
|
|
Overtime - Planned |
$1.45 million |
|
|
Overtime - Actual |
$3.64 million |
Above the City average of
$0.93 million |
|
Overtime - Variance
(Planned/Actual) |
151% |
Above the City average of
49% |
|
Overtime per FTE |
$6,569 |
Above the City average of
$2,624 |
|
Overtime - Percentage of
Compensation Budget |
9.1% |
Above the City average of
3.8% |
|
Absenteeism |
12.2 days/employee |
Above
the City average of 10.3 days/employee |
Figure 17
– Overtime data for Fleet Services (2005)
Overtime Drivers
Non-Discretionary Overtime
Fleet Service’s non-discretionary overtime drivers include:
·
Service Levels - In 2001, the branch met service levels 60%-70% of the
time but they now operate at 95% service levels. This requires the use of overtime to maintain this improved
service level;
·
Accidents – The number of vehicle accidents increased significantly in
2005;
·
Unplanned Leaves – Unplanned leaves of absence (i.e. LTD, WSIB, sick
days) increased significantly in 2005 as reported by Fleet Services;
·
Weather Conditions – Adverse weather conditions, which can cause an
increase in the number of breakdowns and/or additional towing operations; and
·
Vacancies – Delays in hiring staff to meet replacement and growth
requirements. This area is starting to improve due to having
HR reports on upcoming retirements, etc.
Fleet Service’s discretionary overtime drivers include:
·
Planned Absenteeism – this includes vacation (e.g. overtime is needed
to offset impact of employees taking vacation), training (e.g. workers on
midnight shift get trained during the day, outside of their regular hours),
meetings, union grievances, Health & Safety committees, working groups,
etc.
·
Accommodating for modified job duties (for staff that have job
restrictions due to injury, etc.) which can cause an increase in overtime
usage.
Fleet Services does not have any officially documented overtime policies and procedures beyond those stated in the collective agreements. The branch does, however, post bulletins periodically to reiterate the overtime procedures.
Overtime is currently being tracked by Fleet Services through SAP and the M4 System. The M4 system records premium rates (premium differentials for different labour types).
· 2002 Audit of Overtime Costs – Some of the key recommendations from this Audit indicated several improvement areas in regards to overtime usage. They are summarized in the table below.
|
Recommendation |
Management Response |
|
· Address staffing deficiencies |
· Staffing issues have been addressed and improved through utilizing HR reports. These reports have been helpful for identifying annual recruitment and hiring needs |
|
· Address absenteeism |
· The issue of attendance still needs additional attention. The branch has pursued the corporate-wide AIP process |
Figure 18
– Previous audit results for Fleet Services
Current Initiatives to Improve
Overtime Usage:
The following initiatives have been undertaken by Fleet Services to help
reduce overtime usage:
·
The previous open overtime process has been closed (i.e. posting
overtime available and staff would sign-up/bid on overtime);
· Shift Restructuring – Shifts are being restructured to off-peak times for maintenance to keep more buses on the road and to improve service levels while minimizing overtime;
· Resource Restructuring – Increased responsibility and accountability has been assigned to program managers and supervisors, which will aid in minimizing overtime use in their respective areas;
· Optimization Studies – The branch has undertaken several studies including an examination of usage-based service (vs. time-based service) to optimize the time required for inspections and a review to reduce bus repairs through preventative maintenance; and
· Improved IT System – The branch has identified the need for a better FMIS system in Transit Fleet Maintenance that incorporates scheduling and planning features.
Fleet Services is represented by the ATU 279, ATU 1760, CIPP, CUPE 503 Inside/Outside, and CUPE 5500 collective agreements. All of these collective agreements pay overtime premiums once normal daily and/or weekly hours are reached and all of these thresholds are below the mandatory level as specified in the Employment Standards Act (ESA) and the Canada Labour Code (CLC), which require organizations to pay overtime after 44 hours (ESA) and after 48 hours (CLC) are worked in a week.
Fleet Services recovers approximately $1 million in annual expenditures against the Bus Refurbishing capital project for Instruction-to-Service (ITS) and warranty work. Reimbursement from the manufacturer is not reflected in the compensation budget.
Fleet Services has taken steps to reduce the use of overtime by restructuring shifts and resources, undertaking benchmarking and optimization studies, and identifying the need for an improved IT system for scheduling and planning.
Fleet Services is using substantially more overtime than most of the other City branches. The overtime used by Fleet Services is primarily non-discretionary but with the implementation of several overtime initiatives there may be the potential to make reductions in overtime usage. Fleet Services should continue to review and make improvements in tracking cost recoveries, improving its absenteeism rate, overtime policy and procedure development, and shift scheduling.
· Recommendation 1 – Track Overtime to Costs Recovered – In order to accurately reflect overtime expenditures, Fleet Services should track and report all overtime related cost-recoveries in conjunction with overtime costs.
· Recommendation 2 – Reduce Absenteeism - Fleet Services should continue to focus on reducing absenteeism.
· Recommendation 3 – Develop Overtime Policies and Procedures – Fleet Services should develop and document overtime policies and procedures. Employees should be properly trained on the use of these policies and procedures and managers and supervisors should ensure compliance with these policies and procedures.
· Recommendation 4 – Restructure Shift Schedules – Fleet Services should continue to review and change shift schedules, as necessary, in order to keep more buses on the road and improve service levels.
Surface Operations are responsible for:
· Performing maintenance and emergency activities to ensure Ottawa has safe, dependable and clear roads, sidewalks and right-of-ways;
· Ensuring the preservation, protection and enhancement of parks, green spaces and forest cover for public use;
· Enhancing forest cover through tree planting in accordance with the City's Official Plan; and
· Maintaining the City’s road system, which includes 7,200 kilometres of roadways and more than 475 bridges, as well as, maintaining the over 200,000 trees that line the streets and other City property.
Due to the nature of its operations, Surface Operations is a 24/7 and front-line branch. The branch’s services are delivered to the City through three divisions within Surface Operations:
· Roads, Rights-of-Way and Sidewalks;
· Parks and Sports Field Maintenance; and
· Forestry Services.
The table below summarizes information relevant to the use of overtime within Surface Operations for the year 2005.
|
Data |
Comments |
|
|
Overtime – Planned |
$2.85 million |
|
|
Overtime – Actual |
$3.26 million |
Above the City average of
$0.93 million |
|
Overtime – Variance
(Planned/Actual) |
14% |
Below the City average of
49% |
|
Overtime per FTE |
$4,486 |
Above the City average of
$2,624 |
|
Overtime - Percentage of
Compensation Budget |
7.1% |
Above the City average of
3.8% |
|
Absenteeism |
11.21 days/employee |
Above
the City average of 10.3 days/employee |
Figure 19
– Overtime data for Surface Operations (2005)
Overtime Drivers
Non-Discretionary Overtime:
The majority of overtime expenditures in Surface Operations (~82%) is
spent during the winter months on winter-related activities such as snow and
ice removal. Due to the
unpredictability of the weather, the large number of evening hours involved and
the urgent nature of these activities, the branch generally incurs overtime
costs for these activities.
Other causes of non-discretionary overtime include:
• Unplanned events such as support for rallies at Parliament Hill (where barriers need to be used) and rain in the summer which can delay the cutting of grass until off-hours;
• Planned events, such as large festivals, that require barriers and other support;
• Working on statutory holidays; and
• Vacancies.
Discretionary Overtime:
Most of the discretionary overtime used in the Surface Operations branch comes from planned events, such as Canada Day or festivals. The branch cannot hire outside contractors to support these events due to the limitations imposed by the collective agreements.
Surface Operations does not have any formal documented overtime policies and procedures in place.
Surface Operations uses SAP to track overtime expenditures but the causes of overtime are not tracked.
· 2002 Audit of Overtime Costs – Some of the key recommendations from this Audit indicated several improvement areas in regards to overtime usage. They are summarized in the table below.
|
Recommendation |
Management Response |
|
· Review scheduling and adjust if possible to reduce the amount of overtime built into the booking processes. |
· Management have implemented the following changes: o Premiums and overtime provisions of the new collective agreement have been implemented across the branch; o Weekend shift overtime premiums will be reviewed by an arbitrator for settlement; and o Management now receives and reviews monthly financial reports that include overtime costs. |
Figure 20
– Previous audit results for Surface Operations
Current Initiatives to Improve
Overtime Usage:
As part of a current initiative within Surface Operations, there is an effort underway to improve reporting as the current data on overtime usage is not available at the level of detail that is desired. Management feels there needs to be more detail available and it needs to be tracked on a weekly basis. There is currently a pilot in Parks and Forestry Services where supervisors are reviewing the necessary changes to reporting so that accountability for overtime use will be at the supervisor level.
Surface Operations’ employees are represented by the CIPP and CUPE 503 Inside/Outside collective agreements. These collective agreements pay overtime premiums once normal weekly hours are reached and all of these thresholds are below the mandatory level as specified in the Employment Standards Act (ESA) which requires organizations to pay overtime after 44 hours are worked in a week.
Cost Recoveries
Surface Operations had cost recoveries of $29,173 (in 2005) which was received through various capital projects. As Surface Operations performs mainly maintenance activities, overtime recovery from capital projects is not a regular occurrence for the branch.
Surface Operations is a large and complex 24/7 operation that requires the use of overtime to support its operations. The branch is well below the City average for overtime budget variance and they are in the process of improving its operations through a current initiative, which includes improving the reporting on the data details for overtime usage.
While overtime cannot be eliminated altogether, opportunities do exist to reduce the reliance on overtime.
In order to reduce the use of overtime, Surface Operations should focus its efforts on:
• Improving attendance (reduced absenteeism);
• Filling vacancies;
• Improving overtime tracking capabilities; and
• Developing and documenting overtime policies and procedures.
· Recommendation 1 – Reduce Absenteeism – Surface Operations should continue to monitor and reduce absenteeism in the branch.
· Recommendation 2 – Improve Process to Fill Vacancies – Surface Operations should continue to reduce the number of vacant positions within the branch.
· Recommendation 3 – Improve Overtime Tracking – Surface Operations should continue to ensure that more detailed overtime tracking capabilities are developed.
· Recommendation 4 – Develop Overtime Policies and Procedures – Surface Operations should develop and document overtime policies and procedures. Employees should be properly trained on the use of these policies and procedures and managers and supervisors should ensure compliance with these policies and procedures.
Utility Services has six divisions including; Drinking Water Services,
Wastewater & Drainage, Customer Services , Solid Waste Services,
Environment Program, and the Director’s Office. The core services of the branch
have been defined as the provision of water, wastewater, and solid waste
services that directly impact customers, their health and safety, prevention of
environmental damage, and protection of the City infrastructure from loss.
Utility Services are a 24/7 branch and provide front-line/direct
services to citizens. There are 532
budgeted FTEs within Utility Services.
The table below summarizes information relevant to the use of overtime within Utility Services for the year 2005.
|
Data |
Comments |
|
|
Overtime
- Planned |
$1.6 million |
|
|
Overtime
- Actual |
$2.1 million |
Above the City average of
$0.93 million |
|
Overtime
- Variance (Planned/Actual) |
35% |
Below the City average of
49% |
|
Overtime
per FTE |
$4,165 |
Above the City average of
$2,624 |
|
Overtime
- Percentage of Compensation Budget |
6.01% |
Above the City average of
3.8% |
|
Absenteeism |
8.9 days/employee |
Below
the City average of 10.3 days/employee |
Figure 21
– Overtime data for Utility Services (2005)
Non-Discretionary Overtime:
The majority of the overtime drivers in Utility Services are non-discretionary and include:
• Service levels and emergency prevention - Unplanned overtime that is incurred to prevent customer service interruption; prevent property or environmental damage; avert regulatory infraction; avoid financial loss to the City, and/or mitigate imminent risks to the public health or safety;
• Unforeseen events - Extreme weather, power failures, critical equipment breakdown, chemical spills, fires, flooding, and/or maintain minimum shift coverage;
•
Public
enquiries; and
• Plant operations or maintenance that cannot be done during regular hours.
Discretionary Overtime:
Discretionary
drivers of overtime in Utility Services include:
• Data input backlogs - Addressing the backlog of data inputting (i.e. data input to ITX-MMS (Maintenance Management System); and
• Providing reports to council.
Utility
Services branch has recently developed an Overtime Policy/Procedure document that
provides definitions and examples of discretionary and non-discretionary
overtime and also defines unplanned versus planned overtime.
Overtime tracking varies
by divisions within Utility Services but includes SAP, MS Outlook (i.e. for
Heavy Equipment Operators, records when employees are off, which employees are
working overtime, and records equipment issues), MS Excel, and logbooks. In the Solid Waste division, they utilize
logbooks (as they don’t have SAP) and at the Trail Road landfill site, they
utilize MS Outlook.
· 2005 Audit of Overtime – Some of the key recommendations from this Audit indicated several improvement areas in regards to overtime usage. They are summarized in the table below.
|
Recommendation |
Management Response |
|
·
Monitor and
manage overtime within the limits of the established overtime budget,
independently from the compensation envelope |
·
Management
agreed with this recommendation but will continue to work within the total
compensation envelope to continue to provide front-line services where and when
needed |
|
·
Conduct a more
detailed review of the overtime budget annually, in conjunction with FTE
levels and service levels, to reflect anticipated/optimum overtime
expenditures |
·
Management
agreed with this recommendation. Efforts will be made in documenting and
analyzing the relationship between FTEs, overtime, and service levels |
|
·
Review shifts
on a regular and ongoing basis ·
|
·
Management
agreed with this recommendation ·
|
|
·
Update
manuals, etc. (i.e. First Response Manual, etc) |
·
Management
agreed with this recommendation. The branch recently developed the Overtime
Policy/Procedure document (issue date: April 27, 2006) ·
|
Figure 22
– Previous audit results for Utility Services
Current Initiatives to Improve
Overtime Usage:
·
Currently, Utility Services is addressing and
implementing the recommendations as specified in the Audit of Overtime 2005 Report.
Utility Service’s employees are represented by the CIPP and CUPE 503 Inside/Outside collective agreements. These collective agreements pay overtime premiums once normal weekly hours are reached and all of these thresholds are below the mandatory level as specified in the Employment Standards Act (ESA) which requires organizations to pay overtime after 44 hours are worked in a week.
Most of the cost recoveries received by Utility Services is for the
Water divisions (Drinking Water Services and Customer Services &
Operational Support). In 2005,
approximately $240,000 was charged to capital projects which the branch
received cost recoveries for.
Utility Services are a
24/7 operation that requires the use of non-discretionary overtime to meet
service level demands. There will
always be some unplanned overtime due to the 24/7 nature of the branch’s
operations.
In 2005, Utility Services were below the City average for the variance
between planned and actual overtime. They were also below the City average in
absenteeism for 2005.
Overtime improvement areas were
highlighted in the 2005 Audit of Overtime (as discussed previously). Some
additional improvement areas that should also be considered include tracking
cost recoveries.
· Recommendation 1 – Track Overtime to Costs Recovered – To accurately reflect overtime expenditures, Utility Services should track and report all overtime related cost-recoveries in conjunction with associated overtime costs.
Paramedic Services provides advanced medical care and transport to the Ottawa region. The branch delivers services through three divisions:
• Paramedic Operations provides care, treatment, and transport of emergency and non-emergency (medically-required) patients;
• Paramedic Technical Services provides and manages medical supplies and equipment; and
• Provincial Central Ambulance Communications Center (CACC) Contract manages the CACC contract for Eastern Ontario, which includes receiving requests from various sources such as 911 and health.
Paramedic Services are a 24/7 branch and provide front-line/direct services to citizens. The branch has 420 budgeted FTEs to deliver these services.
The table below summarizes information relevant to the use of overtime within Paramedic Services for the year 2005.
|
Data |
Comments |
|
|
Overtime - Planned |
1.5 million |
|
|
Overtime - Actual |
$2.0 million |
Above the City average of
$0.93 million |
|
Overtime - Variance
(Planned/Actual) |
36% |
Below the City average of
49% |
|
Overtime per FTE |
$4,861 |
Above the City average of
$2,624 |
|
Overtime - Percentage of Compensation
Budget |
5.8% |
Above the City average of
3.8% |
|
Absenteeism |
10.6 days/employee |
Above
the City average of 10.3 days/employee |
Figure 23
– Overtime data for Paramedic Services (2005)
Non-Discretionary Overtime:
For Paramedic
Services, the majority of overtime drivers are non-discretionary and include:
·
Planned events such hockey games at Scotiabank Place (also generates
revenue as services are paid for by Scotiabank Place) and NCC events such as
Winterlude;
·
Statutory holidays (e.g. Paramedic Services receive three times the
call volume on the Canada Day holiday);
·
Unforeseen activities such as storms and accidents; and
·
Emergencies – This can result in a paramedic extending their shift
because an emergency call may cause them to have to work past their shift end.
Discretionary
Overtime:
Discretionary
drivers of overtime include:
• Overtime used by administrative staff; and
• Cuts implemented from the Universal Program Review.
Overtime
policies and procedures have been established by management and rules have been
built into the TeleStaff software system. They are documented in the Policy and
Procedure Manual and are also posted on the City’s intranet.
Paramedic
Services use SAP to track and report overtime usage. They also utilize
TeleStaff, which is primarily a scheduling system that also tracks overtime
usage. Telestaff utilizes the same overtime codes as SAP but breaks down each
code in more detail in order to track overtime usage more effectively. Weekly reports, such as the Summary Payroll
Report, are run from this system and are reviewed by management.
· 2002 Audit of Overtime Costs - Some of the key recommendations from this Audit indicated several improvement areas in regards to overtime usage. They are summarized in the table below.
|
Recommendation |
Management Response |
|
·
Address the
shortfall in the number of FTEs |
·
Implemented
changes which reduced part-time positions and increased full-time staffing
which has reduced overtime costs |
|
·
Reduce
absenteeism |
·
Implemented
the corporate-wide Attendance Improvement Program. From 2004 to 2005, there
was a reduction in the absenteeism rate |
Figure 24
– Previous audit results for Paramedic Services
Current Initiatives to Improve
Overtime Usage:
· Paramedic Services is considering recruiting more candidates from college in the spring when a majority of students are graduating.
Paramedic Services employees are represented by the CIPP and CUPE 503 Inside/Outside collective agreements. The CIPP collective agreement states that if full-time workers work more than 39 hours/week and paramedics work more than 42 hours/week, they would be entitled to overtime pay at the rate of 1.5 times the hourly rate. The CUPE 503 Inside/Outside collective agreement requires that overtime be paid to salaried full-time workers for greater than 35 hours/week and for wage full-time workers for greater than 40 hours/week at a rate of 1.5 times the hourly rate.
The Employment Standards Act only requires organizations to pay overtime after 44 hours are worked in a week.
Revenue earned and cost recoveries are
components of budgeting for Paramedic Services. Revenue is earned by the branch staffing paramedics at hockey
games (i.e. overtime would be paid for by the hockey centre). Cost recoveries
are received for the CACC-Dispatch division, as this division is funded by the
Ministry of Health.
Paramedic Services are a 24/7 operation that requires the use of non-discretionary overtime to meet essential service demands. Paramedic Services have been able to reduce its absenteeism rate from 2004 to 2005. As well, revenue earned and cost recoveries compensate for some of the overtime expenditures incurred within the branch.
While overtime cannot be eliminated altogether, some opportunities do exist to reduce overtime usage. Some improvements could still be made in the areas of:
• Staffing;
• Absenteeism; and
• Tracking cost recoveries.
· Recommendation 1 – Review Staffing Needs – Paramedic Services should fully assess its appropriate staffing needs in order to meet call volumes and should receive budgetary approvals to meet these needs.
· Recommendation 2 – Reduce Absenteeism – Paramedic Services should continue to monitor and reduce absenteeism in the branch.
· Recommendation 3 – Track Overtime to Costs Recovered – To accurately reflect their overtime expenditures, Paramedic Services should track and report all overtime related cost-recoveries in conjunction with the associated overtime costs.
The Real Property Asset Management (RPAM) branch is responsible for rationalizing, designing, constructing and maintaining the City’s real property portfolio. Other objectives of the RPAM branch are to set maintenance standards for all City property and facilities, provide day-to-day facilities and property management services, provide professional advice in regards to Real Property, and develop and implement branch-wide policies, procedures, and standards for the management of the real property portfolio.
The table below summarizes
information relevant to the use of overtime within RPAM for the year 2005.
|
Data |
Comments |
|
|
Overtime - Planned |
$1.52 million |
|
|
Overtime - Actual |
$1.31 million |
Above the City average of
$0.93 million |
|
Overtime - Variance
(Planned/Actual) |
- 14% |
Below the City average of
49% |
|
Overtime per FTE |
$1,864 |
Below the City average of
$2,624 |
|
Overtime - Percentage of
Compensation Budget |
2.9% |
Below the City average of
3.8% |
|
Absenteeism |
7.77 days/employee |
Below
the City average of 10.3 days/employee |
Figure 25
– Overtime data for RPAM (2005)
Non-Discretionary Overtime:
The majority of the overtime drivers for RPAM are non-discretionary and include:
· Unforeseen/unplanned emergencies - RPAM provides an on-call service to respond to unplanned/unforeseen emergencies such as gas leaks, water leaks, ammonia leaks, fire alarms, and vandalism. It is estimated that RPAM receives approximately 800 to 1000 of these calls annually. Other emergencies such as ice storms, electrical blackouts, or environmental cleanups may also result in unplanned overtime;
· Collective agreement provisions - The ESA requires that RPAM employees be paid overtime if they work on a statutory holiday. Many of RPAMs facilities operate on statutory holidays (i.e. pools, arenas, etc.) which requires the branch to pay overtime to these employees; and
· Absenteeism - Overtime is used to make up for absences in operation’s staff when part-time resources are unable to fill the absence. Some of the causes of absenteeism include vacation and illness.
There are several circumstances that result in the use of discretionary overtime, including:
· Special events - Event-driven activities, such as those held in City parks, may result in discretionary overtime although sometimes these costs are recoverable;
· Special projects - Including within the Professional Services Division P3 projects, projects as determined by clients or Council, or from seasonal work that impacts project-load levelling; and
· Public meetings – Public consultations that are held after hours as part of the development process or as a result of a Councillor request, (e.g. extended legislative meetings with Council, Standing Committees, Advisory Committees, meetings with private landowners and developers) lead to the requirement for overtime.
An on-call service request system which prioritizes calls as Emergency, Urgent, Routine, or Deferred helps the RPAM branch to minimize discretionary overtime.
RPAM has developed documented overtime processes, SAP coding and on-call procedures, and system reviews that have helped to improve the management of overtime in the branch. These processes and procedures are documented and employees are trained on their effective use (i.e. orientation on procedures, SAP training, and completion of activity sheets).
Current payroll procedures are designed to reinforce the appropriate use of overtime by requiring documentation of the reason for the overtime incurred. This is generally consistent across all divisions with the exception of the operational divisions, which use activity sheets to report overtime. The implementation and use of activity sheets has proven instrumental in monitoring overtime in the operational divisions.
In the professional groups, authorized overtime hours are recorded as part of the exception reporting, approved accordingly, and recorded in Human Resources.
RPAM has recently implemented a new process for tracking overtime as a result of the 2005 Audit of Overtime. Overtime can now be tracked and attributed to specific causes and is recorded in the activity reporting component of the Plant Maintenance (PM) module of SAP.
· 2005 Audit of Overtime – Some of the key recommendations from this Audit indicated several improvement areas in regards to overtime usage. They are summarized in the table below.
|
Recommendation |
Management Response |
|
· Continue to monitor and manage overtime within the limits of established overtime budget |
· Have continued to monitor and manage overtime through well-established procedures and SAP tracking system |
|
· Require that staff provide a rationale and justification on the daily Maintenance Activity Sheets as to the reason for any overtime claimed |
· Overtime documentation, including Maintenance Activity Sheets, include the reason that overtime was used |
Figure 26
– Previous audit results for RPAM
Current Initiatives to Improve
Overtime Usage:
· The following initiatives have been undertaken by RPAM to reduce the use of overtime:
o Time Tracking – Consistent time tracking guidelines were developed and time tracking was implemented for some of RPAM’s divisions with the remaining divisions to follow;
o On-Call Incident Reports – On-call procedures require that employees record the details of the incident and send the report to the service desk. The procedures are well-documented and reporting occurs on a monthly basis. The on-call reports have an extensive analysis of the number, cause, facilities, and staff involved in the incident in order to better understand trends, etc.;
o Part-Time Resources – Districts have pooled their casual/part-time employees who can be called in to work on short notice (i.e. to respond to an unforeseen event, etc.). These resources are only used to replace employees who are required for operations; and
o Client Charge Back – Programs that extend beyond the normal hours of operations, and thus cause overtime usage, are now charged back to the client (in order to recover costs due to overtime).
RPAM is represented by the CIPP,
ATU 1760, ATU 279, CUPE 503 Inside/Outside, and CUPE 5500 collective agreements. These collective agreements pay overtime
premiums once normal daily and/or weekly
hours are reached and all of these thresholds are below the mandatory level as
specified in the Employment Standards Act (ESA) which requires organizations to
pay overtime after 44 hours are worked in a week.
Through the client charge-back
initiative, operating costs associated with programming outside of the normal
hours of operation are now being charged back to programs.
RPAM has recently improved its overtime tracking and reporting capabilities. The branch has taken advantage of the enhanced functionality within the SAP Plant Maintenance module to track overtime to a significant level of detail. The branch has also implemented informal initiatives to minimize overtime where possible, including the use of part-time replacement workers, the consolidation of district resources, and the consolidation of venue operating hours.
RPAM is currently below average in its overtime costs per FTE and has kept overtime spending below its overtime budget. As well, the absenteeism rate within RPAM is well below the City average.
The overtime used by RPAM is primarily non-discretionary and significant reductions in overtime would require an adjustment to service levels. Marginal overtime improvements could still be made by tracking cost recoveries to overtime costs incurred.
· Recommendation 1 – Track Overtime to Costs Recovered – To accurately reflect overtime expenditures, RPAM should track and report all overtime related cost-recoveries in conjunction with the associated overtime costs.
The Traffic and Parking Operations (TPO) is responsible for a number of City services, including:
• Pavement Markings, Signage and Road Safety Devices;
• Traffic Control Signals;
• Red Light Cameras;
• Street Lighting;
• Parking Operations;
• Traffic Safety, Investigation and Studies;
• Right-of-Way, Permits, By-laws and Inspections; and
• Traffic Network Management.
Traffic and Parking Operations
are a 24/7 branch and provide front-line/direct
services to citizens. There are 260 budgeted FTEs within TPO.
The table below summarizes
information relevant to the use of overtime within Traffic and Parking
Operations for the year 2005.
|
Data |
Comments |
|
|
Overtime - Planned |
$0.90 million |
|
|
Overtime - Actual |
$1.10 million |
Above the City average of
$0.93 million |
|
Overtime - Variance
(Planned/Actual) |
22% |
Below the City average of
49% |
|
Overtime per FTE |
$4,246 |
Above the City average of
$2,624 |
|
Overtime - Percentage of
Compensation Budget |
6.2% |
Above the City average of
3.8% |
|
Absenteeism |
10.22 days/employee |
Below
the City average of 10.3 days/employee |
Figure 27
– Overtime data for Traffic and Parking Operations (2005)
Overtime Drivers
Non-Discretionary Overtime:
Some of the drivers of non-discretionary overtime include:
• Road construction and other construction projects where construction activity timelines are beyond the branch’s control;
• Setting-up detouring signage;
• Emergencies, accidents, hydro failure, storm damage, etc., often need to be dealt with immediately and can lead to use of overtime;
• Meeting the expectations of the development review process in order to fulfill TPO’s mandate to provide accurate, defendable and complete traffic-related comments;
•
Responding to
developer requests for site plan traffic reviews within the 90 day window can
lead to overtime during peak fluctuations;
•
After roadways
are overlaid, resurfaced, and/or reconstructed, there is often a requirement to
paint as quickly as practical and often this may result in overtime. In addition, urban areas often contain too
much traffic to paint roadways during regular working hours; and
•
Traffic Control
Central Computer and Video Centre Operations - During special events, major Scotiabank
Centre events, incidents, detours, or accidents, operation’s personnel may be
required to work outside of their regular working hours.
Some of the drivers of discretionary overtime include:
• Requests from Councillors to attend evening meetings and public consultations;
•
Overtime is
often required to coordinate traffic signals with construction activities or
coordinate detour routes around construction projects; and
•
Special events
- Winterlude, Central Canada Exhibition, and the Blues Festival, often require
signage, or temporary signage to be set up outside of regular working hours.
Traffic and Parking Operations does not have formal documented overtime policies and procedures in place.
SAP is the only tool used by Traffic and Parking Operations to track overtime spending. As is the case for most of the branches, the causes of overtime are not currently tracked.
· An audit of overtime expenditures for Traffic and Parking Operations has not been conducted at the time of this review.
Current Initiatives to Improve
Overtime Usage:
· New shift times – New shift times were implemented to reduce overtime usage. Job descriptions have been changed accordingly;
· Flex hours - Traffic Control System’s staff work within core hours, but can flex/alter their start times;
· Staffing - Improved alignment between staffing levels and the work that needs to completed; and
· Process improvements – As reported by TPO, each program area within the Traffic Operations Division tries to identify improvements to operations in order to realize cost savings. The Parking Division section is reviewing the possibility of implementing shift changes for weekend periods to reduce overtime costs. The Signals division is currently documenting the types of signs, and related damage to signs, and how this area impacts the usage of overtime.
TPO is represented by the CIPP
and CUPE 503 Inside/Outside collective agreements. These collective agreements pay overtime premiums once normal
daily and/or weekly hours are reached and all of these thresholds are below the
mandatory level as specified in the Employment Standards Act (ESA) which
requires organizations to pay overtime after 44 hours are worked in a week.
For TPO, there is a budgeted relation for
overtime to the cost recoveries from capital and external sources in the amount
of $410,500 (for 2005) in the Traffic Division (it is not separately broken out
between the two streams). Cost
recoveries are received for various capital projects or for work for
developers, as well as, accident recoveries.
Traffic and Parking Operations currently have several initiatives underway to improve overtime usage. As well, the overtime budget variance for TPO is below the City average.
While Traffic and Parking Operations can identify the key drivers of overtime, they are unable to quantify the amount of overtime resulting from each driver. Without this data it will be very difficult for the branch to systematically reduce its overtime usage. TPO should also track cost recoveries, improve its absenteeism rate and develop and document overtime policies and procedures.
· Recommendation 1 – Track Overtime to Costs Recovered – In order to accurately reflect overtime expenditures, Traffic and Parking Operations should track and report all overtime related cost-recoveries in conjunction with the associated overtime costs.
· Recommendation 2 – Reduce Absenteeism – Traffic and Parking Operations should continue to monitor and reduce absenteeism in the branch.
·
Recommendation 3
– Develop Overtime Policies and Procedures - Traffic and Parking Operations
should develop and document overtime policies and procedures. Employees should be properly trained on the
use of these policies and procedures and managers and supervisors should ensure
compliance with these policies and procedures.
Infrastructure Services is a 24/7 branch made up of four divisions; Constructions Services Development, Constructions Services East, Construction Services West, and Infrastructure Management. The branch’s primary objectives are to:
• Manage and optimize the lifecycle of the City’s public transportation and utility infrastructure, and develop annual Capital Programs to ensure ongoing reliability;
• Work to accommodate growth in the existing system in the most efficient manner possible in accordance with the City’s Official Plan;
• Provide design and construction services that are efficient, effective and financially responsible; and
• Coordinate with utility companies to effectively manage the competing uses of the City’s municipal right-of-way.
The table below summarizes
information relevant to the use of overtime within Infrastructure Services for
the year 2005.
|
Data |
Comments |
|
|
Overtime - Planned |
$571,229 |
|
|
Overtime - Actual |
$1.1 million |
Above the City average of
$0.93 million |
|
Overtime
- Variance (Planned/Actual) |
91% |
Above
the City average of 49% |
|
Overtime
per FTE |
$4,400 |
Above
the City average of $2,624 |
|
Overtime
- Percentage of Compensation Budget |
5.60% |
Above
the City average of 3.8% |
|
Absenteeism |
5.56 days/employee |
Below the City average of 10.3 days/employee |
Figure 28
– Overtime data for Infrastructure Services (2005)
Non-Discretionary Overtime:
Most of the overtime usage within Infrastructure Services comes from the Constructions Services divisions (Development, East, and West) in the delivery of the Capital Program. These divisions manage the design and construction of municipal infrastructure projects and perform inspections to ensure that infrastructure constructed by private developers meets City standards and specifications.
While the Construction Services division oversees infrastructure projects, much of the work is contracted out. Contractors typically work 50 to 55 hour weeks and the City must have a qualified representative on-site at all times since they are responsible for the project. Leaving a site unmonitored would constitute an unacceptably high liability risk and, therefore, the use of overtime is required.
Other uses of non-discretionary overtime are also related to the delivery of the Capital Program and include:
• Meeting deadlines;
• Overseeing external consultants working outside of core hours; and
• Public Meetings.
Discretionary overtime is typically used for routine operations such as:
• High work loads in general operating areas;
• Non-project based work; and
• Completing work that is not related to Capital Programs such as engineering studies and evening meetings.
Infrastructure Services does not have any formal documented overtime policies and procedures in place.
Infrastructure Services and Payroll have developed TRS (Time Reporting System) to use in conjunction with SAP to track employee hours. TRS allows the branch to track time on a project-by-project basis and then charge it to the appropriate capital project. As is the case for most of the branches, the causes of overtime are not currently tracked.
· An audit of overtime expenditures for Infrastructure Services has not been conducted at the time of this review.
Current Initiatives to Improve
Overtime Usage:
· Detailed Tracking – Infrastructure Services has been analyzing its overtime usage down to the employee level to ensure excessive overtime is not being used; and
· Performance Measurement – Infrastructure Services is looking at alternate scheduling options to reduce overtime usage, such as the staggering of construction inspectors time on site.
Infrastructure Services is
represented by the CIPP and CUPE 503 Inside/Outside collective agreements. These collective agreements pay overtime
premiums once normal daily and/or weekly hours are reached and all of these
thresholds are below the mandatory level as specified in the Employment Standards
Act (ESA) which requires organizations to pay overtime after 44 hours are
worked in a week.
While Infrastructure Services use a significant amount of overtime in
support of the Capital Program, they also receive cost recoveries from the
capital budget. The Financial Services
Unit estimates that $900,000, or 85%, of the branch overtime costs were
recovered against various capital accounts in 2005.
While Infrastructure Services have significant overtime costs, the majority of these costs are offset by cost recoveries. At present, this information must be extracted from TRS by Infrastructure Services and is not widely reported. It should also be noted that Infrastructure Services is well below the City average for absenteeism.
Other areas for improvement include tracking cost recoveries and developing and documenting overtime policies and procedures.
· Recommendation 1 – Track Overtime to Costs Recovered – To accurately reflect overtime expenditures, Infrastructure Services should track and report all overtime related cost-recoveries in conjunction with associated overtime costs.
· Recommendation 2 – Develop Overtime Policies and Procedures - Infrastructure Services should develop and document overtime policies and procedures. Employees should be properly trained on the use of these policies and procedures and managers and supervisors should ensure compliance with the policies and procedures.
Ottawa Fire Services is a 24/7 operation with 43 stations, including 27 urban and 16 rural stations, and have over 900 employees. Fire Services is responsible for protecting the lives, property and environment of the people who live, work and visit the City of Ottawa. Service personnel are highly trained to respond to a wide variety of emergency and non-emergency incidents including fires, rescues, and medical and hazardous-material emergencies. The department is also responsible for fire prevention, public education, and emergency preparedness programs.
The table below summarizes
information relevant to the use of overtime within Fire Services for the year
2005.
|
Data |
Comments |
|
|
Overtime - Planned |
$1.15 million |
|
|
Overtime - Actual |
$1.08 million |
Above the City average of
$0.93 million |
|
Overtime - Variance
(Planned/Actual) |
-6% |
Below the City average of
49% |
|
Overtime per FTE |
$1,108 |
Below the City average of
$2,624 |
|
Overtime - Percentage of
Compensation Budget |
1.2% |
Below the City average of
3.8% |
|
Absenteeism |
9.84 days/employee |
Below
the City average of 10.3 days/employee |
Figure 29
– Overtime data for Fire Services (2005)
Non-Discretionary Overtime:
Most of the overtime used by Fire Services is non-discretionary. Overtime is predominantly used to maintain a minimum service level of 154 staff per shift, as stated in the collective agreements, in order to keep the fire stations open.
When Fire Suppression does not have enough regular time fire fighters available to meet service level requirements, the branch compensates with overtime. The pressures that cause staffing shortages include vacation time, time in lieu, and absenteeism.
Other non-discretionary overtime drivers include:
• Periodic high service level demands;
• Services provided outside of regular hours; and
• Statutory holidays.
Very little discretionary overtime is used by Fire Services but for some planned events, such as the Bush presidential visit, overtime is used to meet the higher than standard service level requirement. For these special cases, Fire Services would typically receive a cost recovery from the parties requesting the service. In the example cited (presidential visit), the Federal Government reimbursed Fire Services for the associated costs.
Overtime policies are
documented in the Fire Services policy book, which consists of various standard
operating procedures. There is a policy book at every fire station.
Fire Services uses an Excel-based overtime tracking tool to track the use of overtime. It allows the branch to track the reasons for incurring overtime and this information is monitored and reviewed on a weekly basis. SAP is also used to track and report on overtime spending but, as is the case for most of the branches, the causes of overtime are not tracked in this application.
· 2005 Audit of Overtime – Some of the key recommendations from this Audit indicated several improvement areas in regards to overtime usage. They are summarized in the table below.
|
Recommendation |
Management Response |
|
· Alter staffing practices |
· Cannot implement due to collective agreements |
|
· Address absenteeism |
· Has already been addressed |
|
· Reduce time lapses in processing leave/ overtime requests |
· Agreed and has been addressed |
|
· Stop using Excel tracking tool in favour of SAP |
· SAP does not track reasons for overtime being used |
Figure 30
– Previous audit results for Fire Services
Current Initiatives to Improve
Overtime Usage:
· Reduced Fleet In Service - When Fire Services is short staffed, they have the flexibility to take 5 trucks out of service to avoid using overtime. Beyond this point, additional absences cannot be absorbed through further service level reductions which results in the usage of overtime to maintain the minimum level of service; and
· Absenteeism – Over the past few years, Fire Services has focussed on reducing absenteeism. In addition to the corporate-wide AIP, Fire Services have implemented internal initiatives which have resulted in an improvement in absenteeism. From 2004 to 2005, the absenteeism rate per employee has decreased from 10.62 to 9.84 days/employee.
Employees in Fire Services are represented by the OPFFA (Fire), CIPP, and CUPE 503 Inside/Outside collective agreements. These collective agreements pay overtime premiums once normal weekly hours are reached and all of these thresholds are below the mandatory level as specified in the Employment Standards Act (ESA) which requires organizations to pay overtime after 44 hours are worked in a week.
Fire Services receive
cost recoveries and/or generate revenue for some of the overtime costs
incurred. Revenue is generated through
the fees that Fire Services charges for some recruitment activities, i.e.
conducting recruitment testing, etc. Revenue is also generated for building inspections, fire investigations, title
searches, and summary reports. When Fire Services personnel respond
to a call on a 400 series (provincial) highway, they charge the Ministry of
Transportation of Ontario a fee based on the type of vehicle deployed. There are also various events that occur where
Fire Services may incur overtime in providing coverage (i.e. Carp Air Show) or
in responding to a call outside of the City (i.e. Gatineau
Fire). Generally, the fees charged by Fire Services are based on the type
of vehicle deployed and the direct overtime is not recovered.
Fire Services is the second largest branch, by employee count, yet:
• The branch has one of the lowest overtime rates per FTE out of the 24/7 branches;
• Improvements have been made in the absenteeism rates within the branch;
• The total overtime expenditures relative to the branch’s compensation budget is below the City average; and
• Fire Services is one of only five (5) branches who spent less than its approved overtime budget.
Additionally, the majority of the overtime in the Fire Services Branch is non-discretionary as it is used to maintain mandated service levels. Accordingly, it would be difficult for Fire Services to make any substantial reductions in the overtime use. Some improvements could be made in the areas of improving absenteeism and tracking cost recoveries.
· Recommendation 1 – Reduce Absenteeism – Fire Services should continue to monitor and reduce absenteeism in the branch.
· Recommendation 2 – Track Overtime to Costs Recovered – To accurately reflect the overtime expenditures, Fire Services should track and report all overtime related cost-recoveries in conjunction with the associated overtime costs.
This section provides a summary analysis of the usage of overtime in the remaining twenty-two (22) branches. In total, these twenty-two (22) branches account for approximately 10% of the total overtime expenditures of the City. Each of these branches, therefore, is a relatively minor contributor to the City’s overall overtime usage. In general, these branches provide a variety of City services but have fewer programs that require 24/7 operations. These branches generally provide either direct service to the public and/or administrative functions within the City.
Highlights of these twenty-two (22) branches
overtime usage (for 2005) and operational characteristics are presented in the
table below.
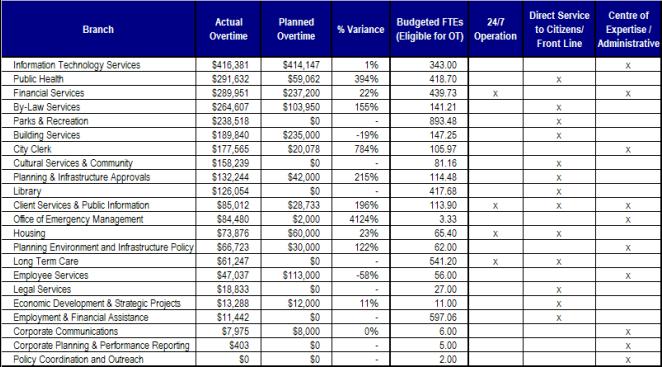
Figure 31
– Overtime usage for the remaining twenty-two (22) branches (2005)
The table below summarizes
information relevant to the use of overtime within the other twenty-two (22)
branches for the year 2005.
|
Data |
Comments |
|
|
Overtime - Planned |
$ 62,053 |
|
|
Overtime - Actual |
$125,243 |
Below the City average of
$0.93 million |
|
Overtime - Variance
(Planned/Actual) |
101.83% |
Above the City average of
49% |
|
Overtime per FTE |
$1,986 |
Below the City average of
$2,624 |
|
Overtime - Percentage of
Compensation Budget |
2.00% |
Below the City average of
3.8% |
|
Absenteeism |
7.41
days/employee |
Below
the City average of 10.3 days/employee |
Figure 32
– Overtime data for twenty-two (22) branches (2005)
|
Branch |
Overtime
Drivers |
Branch |
Overtime
Drivers |
|
By-Law Services |
· Vacancies · Special
Projects · Planned
Events · Public
Consultation |
Policy Coordination and Outreach |
|
|
Parks and Recreation |
· Absenteeism · Unforeseen/
Unplanned Events · Vacancies · Periodic
High Service Level Demands · Stat
Holidays |
City Clerk |
· Request from
Council · Deadline
Requirements · Special
Projects · Periodic
High Service Level Demands · Absenteeism |
|
Emergency Measures |
· Unforeseen/
unplanned events · Planned
Events · Deadline
Requirements |
Client Services and Public Information |
· Special
Projects · Deadline
Requirements · Planned
Events |
|
Employment and Financial Assistance |
· Special
Projects · Deadline
Requirements · Unforeseen/
Unplanned Events |
Employee Services |
· Deadline
Requirements · Special
Projects · Unforeseen/
Unplanned Events |
|
Library |
· Periodic
High Service Level Demands · Stat
Holidays · Absenteeism · Special
Projects · Services
Provided Outside of Regular Hours of Work |
Financial Services |
· Deadline
Requirements · Absenteeism · Vacancies |
|
Housing |
· Unforeseen/
Unplanned Events · Stat
Holidays · Absenteeism · Services
Provided Outside of Regular Hours · Periodic
High Service Level Demands |
Information Technology Services |
· Planned
Events · Special
Projects · Vacancies · Unforeseen/
unplanned events |
|
Cultural Services and Community Funding |
· Services
Provided Outside of Reg Hrs · Requests
from Council · Planned
Events · Periodic
High Service Level Demands · Vacancies |
Legal Services |
· Deadline
Requirements · Periodic
High Service Level Demands · Vacancies |
|
Long Term Care |
· Absenteeism |
Building Services |
· Deadline
Requirements · Periodic
High Service Level Demands · Vacancies · Request from
Council |
|
Public Health |
· Services
Provided Outside of Regular Hours of Work · Unforeseen/
unplanned events · Planned
Events · Request from
Council |
Planning and Infrastructure Approvals |
· Public
Consultation · Requests
from Council · Deadline
Requirements · Vacancies |
|
Corporate Communications |
· Unforeseen/
unplanned events · Planned
Events · Request from
Council · Periodic
High Service Level Demands · Services
Provided Outside of Reg Hrs |
Planning Environment and Infrastructure Policy |
· Deadline
Requirements · Request from
Council · Planned
Events · Special
Projects · Unforeseen/
Unplanned Events |
|
Corporate Planning and Performance Reporting |
|
Economic Development and Strategic Projects |
· Special
Projects · Unforeseen/
unplanned events · Planned
Events |
Figure 33
– Overtime drivers for twenty-two (22) branches
Overtime Policies and Procedures
With the exception of Planning and Infrastructure Approvals, none of these twenty-two (22) branches, have formalized and documented overtime policies and procedures.
The majority of these branches utilize SAP to track overtime usage. None of the branches track, within SAP, the causes of overtime usage.
· None of these twenty-two (22) branches have had a formal audit and/or any recent studies conducted of overtime usage prior to this Branch-by-Branch Overtime Review.
These twenty-two (22) branches
are represented by several different collective agreements. All of these collective agreements pay
overtime premiums once normal daily and/or weekly hours are reached and all of
these thresholds are below the mandatory level as specified in the Employment
Standards Act (ESA) which requires organizations to pay overtime after 44 hours
are worked in a week.
Of these twenty-two (22) branches, only the following three (3) branches have cost recoveries and/or revenue generation that partially compensates for overtime expenditures:
·
By-Law Services;
·
Parks & Recreation – This branch has some events,
i.e. renting a pool out at night, where overtime costs are recovered through
client charge-backs; and
·
Cultural
Services & Community – This branch has the ability to offset
overtime costs through user fees, registration, and client charge-backs (i.e.
Centrepointe Theatre, Arts Court, Program Registration Fees, etc.).
Although overtime usage for these branches are relatively low as compared to the nine (9) other branches with the highest overtime usage, there are still some areas of potential improvement. These areas include:
· Develop and document formal overtime policies and procedures; and
· Develop overtime base budgets – Eight (8) of these twenty-two (22) branches did not have an overtime base budget although seven (7) of these eight (8) branches incurred overtime expenditures in 2005. Appropriate overtime base budgets need to be established in order to more accurately account for and justify the overtime requirements of a branch.
· Recommendation 1 – Develop Overtime Policies and Procedures – The Employee Services branch should develop corporate-wide overtime policies and procedures. Some branches may need to further develop branch-specific overtime procedures to address specific operational requirements. Employees should be properly trained on the use of these policies and procedures and managers and supervisors should ensure compliance with the policies and procedures.
· Recommendation 2 – Develop Overtime Base Budgets – Appropriate overtime base budgets need be established and implemented in order to more accurately account for and justify the overtime requirements of the branches.
Appendix A – Collective Agreements - Overtime Summary
|
Union Group/ Collective Agreement |
Employee Type |
Normal Hours Worked |
Overtime Premium |
Notes |
|
CUPE 503 Inside/Outside |
Salaried FT |
35 hrs/wk |
1.5 x hourly rate |
·
Hourly rate based on
bi-weekly salary and bi-weekly regular hours. |
|
Wage FT |
40 hrs/wk |
1.5x hourly
rate |
|
|
|
CUPE 503 Rec. & Culture |
Full Time |
8 hrs/day or 40hrs/wk |
1.5 x hourly rate |
|
|
CUPE 503 Library |
Full Time |
7 hrs/day or 35 hrs/wk |
1.5 x hourly rate |
|
|
CIPP |
Full Time |
39 hrs/wk |
1.5 x hourly rate |
·
Grandfathering rights
result in some employees having a 35 hour normal work week. |
|
Paramedics |
42 hrs/wk |
1.5 x hourly rate |
·
42 hours/week is
averaged over two week period. |
|
|
ATU Local 279 |
Full Time |
8 hrs/day* |
1.5 x job classification rate |
•
ATU 279 agreement currently in
draft form. •
*Does not apply to agreed upon
long shifts. •
Overtime 1.5 x job classification paid for work
performed on an employee’s day off. |
|
ATU Local 1760 |
Full Time |
70 hrs averaged over bi-weekly period |
1.5 x hourly rate |
•
Overtime rate of 1.5 x paid for
all hours worked on statutory holidays. |
|
CUPE 5500- Transit Security CUPE 5500- Transit
Supervisors CUPE 5500- Transit and Fleet
Maintenance |
Full Time |
Shift is extended or 40 hrs/wk |
1.5 x hourly rate |
•
Information meetings before or
after shift are paid overtime of 1.5 x hourly rate. |
|
OPFFA (Fire) |
Suppression |
42 hrs/wk |
1.5 x hourly rate |
•
Weekly hours are averaged. |
|
Comm. |
42 hrs/wk |
1.5 x hourly rate |
|
|
|
Prevention |
35 hrs/wk |
1.5 x hourly rate |
|
|
|
IATSE |
Full Time |
8 hrs/day or 40 hrs/wk |
1.5 x hourly rate |
|
Appendix B – Additional SAP Data
1. Overview of Key Data Points for 2005
|
Branch |
Actual Overtime |
Actual Overtime: Overtime Budget |
Actual Overtime/ Comp Budget |
Actual Overtime/FTE* |
**Absent Days/ Employee |
|
Building Services |
$189,840 |
0.81 |
2.01% |
$1,289 |
5.81 |
|
By-Law Services |
$264,607 |
2.55 |
2.69% |
$1,874 |
10.89 |
|
City Clerk |
$177,565 |
8.84 |
2.19% |
$1,676 |
8.35 |
|
Client Services & Public
Information |
$85,012 |
2.96 |
1.04% |
$746 |
11.67 |
|
Corporate Communications |
$7,975 |
1.00 |
0.77% |
$1,329 |
2.24 |
|
Corporate Planning &
Performance Reporting |
$403 |
- |
0.21% |
$81 |
- |
|
Cultural Services &
Community Funding |
$158,239 |
- |
2.85% |
$1,950 |
4.95 |
|
Economic Development &
Strategic Projects |
$13,288 |
1.11 |
0.89% |
$1,208 |
3.71 |
|
Employee Services |
$47,037 |
0.42 |
0.36% |
$840 |
4.05 |
|
Employment & Financial
Assistance |
$11,442 |
- |
0.03% |
$19 |
11.30 |
|
Financial Services |
$289,951 |
1.22 |
0.92% |
$659 |
8.21 |
|
Fire Services |
$1,083,301 |
0.94 |
1.18% |
$1,108 |
9.84 |
|
Fleet Services |
$3,636,761 |
2.51 |
9.10% |
$6,569 |
12.21 |
|
Housing |
$73,876 |
1.23 |
1.44% |
$1,130 |
9.35 |
|
Information Technology
Services |
$416,381 |
1.01 |
1.43% |
$1,214 |
5.73 |
|
Infrastructure Services |
$1,091,462 |
1.91 |
5.60% |
$4,400 |
5.56 |
|
Legal Services |
$18,833 |
- |
0.49% |
$698 |
3.36 |
|
Library Services |
$126,054 |
- |
0.61% |
$302 |
- |
|
Long Term Care |
$61,247 |
- |
0.18% |
$113 |
14.63 |
|
Office Of Emergency
Management |
$84,480 |
42.24 |
19.88% |
$25,369 |
9.23 |
|
Paramedic Services |
$2,022,379 |
1.36 |
5.75% |
$4,861 |
10.57 |
|
Parks & Recreation |
$238,518 |
- |
0.56% |
$267 |
7.60 |
|
Planning &
Infrastructure Approvals |
$132,244 |
3.15 |
1.42% |
$1,155 |
5.85 |
|
Planning Environment &
Infrastructure Policy |
$66,723 |
2.22 |
1.07% |
$1,076 |
6.22 |
|
Policy Coordination and Outreach |
$0 |
- |
- |
$0 |
- |
|
Public Health |
$291,632 |
4.94 |
0.97% |
$697 |
7.72 |
|
Real Property Asset
Management |
$1,308,771 |
0.86 |
2.90% |
$1,864 |
7.77 |
|
Surface Operations |
$3,258,093 |
1.14 |
7.08% |
$4,486 |
11.21 |
|
Traffic & Parking
Operations |
$1,096,044 |
1.22 |
6.16% |
$4,246 |
10.22 |
|
Transit Services |
$10,441,676 |
1.62 |
9.05% |
$5,963 |
14.72 |
|
Utility Services |
$2,123,299 |
1.35 |
6.01% |
$4,165 |
8.89 |
|
Averages |
$929,585 |
1.49 |
3.80% |
$2,624 |
10.3 |
(*
FTE = Full Time Equivalent - budgeted, and eligible for overtime and for **
Absent Days/Employee, “-“ = data not available)
2. Overtime
Recorded on Statutory Holidays for 2005
|
Branch |
2005 Actual
Overtime |
2005 Overtime Due
to Statutory Holidays |
Percentage (%) of
Overtime Due to Statutory Holidays |
|
Building
Services |
$189,840 |
$418 |
0.2% |
|
By-Law Services |
$264,607 |
$54,155 |
20% |
|
City Clerk |
$177,565 |
$3,157 |
2% |
|
Client Services
& Public Information |
$85,012 |
$4,656 |
5% |
|
Corporate
Communications |
$7,975 |
$66 |
1% |
|
Corporate
Planning & Performance Reporting |
$403 |
$0 |
0% |
|
Cultural
Services & Community Funding |
$158,239 |
$5,219 |
3% |
|
Economic
Development and Strategic Projects |
$13,288 |
$219 |
2% |
|
Employee
Services |
$47,037 |
$538 |
1% |
|
Employment
& Financial Assistance |
$11,442 |
$4,324 |
38% |
|
Financial
Services |
$289,951 |
$27,987 |
10% |
|
Fire Services |
$1,083,301 |
$41,864 |
4% |
|
Fleet Services |
$3,636,761 |
$333,070 |
9% |
|
Housing |
$73,876 |
$3,461 |
5% |
|
Information
Technology Services |
$416,381 |
$6,690 |
2% |
|
Infrastructure
Services |
$1,091,462 |
$27,904 |
3% |
|
Legal Services |
$18,833 |
$242 |
1% |
|
Library
Services |
$126,054 |
$3,774 |
3% |
|
Long Term Care |
$61,247 |
$2,607 |
4% |
|
Office of
Emergency Management |
$84,480 |
$0 |
0% |
|
Paramedic
Services |
$2,022,379 |
$59,938 |
3% |
|
Parks &
Recreation |
$238,518 |
$126,462 |
53% |
|
Planning &
Infrastructure Approvals |
$132,244 |
$697 |
1% |
|
Planning
Environment and Infrastructure Policy |
$66,723 |
$882 |
1% |
|
Policy
Coordination & Outreach |
$0 |
$0 |
0% |
|
Public Health |
$291,632 |
$5,898 |
2% |
|
Real Property
Asset Management |
$1,308,771 |
$48,739 |
4% |
|
Surface
Operations |
$3,258,093 |
$221,215 |
7% |
|
Traffic &
Parking Operations |
$1,096,044 |
$43,275 |
4% |
|
Transit
Services |
$10,441,676 |
$1,575,686 |
15% |
|
Utility
Services |
$2,123,299 |
$56,875 |
3% |
|
Totals / Averages |
$28,817,131 |
$2,660,018 |
9% |
3. Overtime
in Comparison to Compensation Budget for 2005
|
Branch |
2005 Actual Overtime (000's) |
2005 Compensation Budget (000's) |
Actual Overtime / Total
Compensation Budget |
|
Building Services |
$190 |
$9,464 |
2.01% |
|
By-Law Services |
$265 |
$9,845 |
2.69% |
|
City Clerk |
$178 |
$8,090 |
2.19% |
|
Client Services
& Public Information |
$85 |
$8,150 |
1.04% |
|
Corporate
Communications |
$8 |
$1,035 |
0.77% |
|
Corporate Planning
& Performance Reporting |
$0 |
$193 |
0.21% |
|
Cultural Services
& Community Funding |
$158 |
$5,560 |
2.85% |
|
Economic
Development & Strategic Projects |
$13 |
$1,498 |
0.89% |
|
Employee Services |
$47 |
$13,053 |
0.36% |
|
Employment &
Financial Assistance |
$11 |
$40,784 |
0.03% |
|
Financial Services |
$290 |
$31,450 |
0.92% |
|
Fire Services |
$1,083 |
$91,860 |
1.18% |
|
Fleet Services |
$3,637 |
$39,952 |
9.10% |
|
Housing |
$74 |
$5,131 |
1.44% |
|
Information
Technology Services |
$416 |
$29,047 |
1.43% |
|
Infrastructure
Services |
$1,091 |
$19,503 |
5.60% |
|
Legal Services |
$19 |
$3,880 |
0.49% |
|
Library Services |
$126 |
$20,784 |
0.61% |
|
Long Term Care |
$61 |
$34,892 |
0.18% |
|
Office of Emergency
Management |
$84 |
$425 |
19.88% |
|
Paramedic Service |
$2,022 |
$35,165 |
5.75% |
|
Parks &
Recreation |
$239 |
$42,895 |
0.56% |
|
Planning &
Infrastructure Approvals |
$132 |
$9,284 |
1.42% |
|
Planning,
Environment & Infrastructure Policy |
$67 |
$6,232 |
1.07% |
|
Policy Coordination
& Outreach |
$0 |
$0 |
0.00% |
|
Public Health |
$292 |
$30,024 |
0.97% |
|
Real Property Asset
Management |
$1,309 |
$45,066 |
2.90% |
|
Surface Operations |
$3,258 |
$46,030 |
7.08% |
|
Traffic &
Parking Operations |
$1,096 |
$17,803 |
6.16% |
|
Transit Services |
$10,442 |
$115,322 |
9.05% |
|
Utility Services |
$2,123 |
$35,315 |
6.01% |
|
Totals / Averages |
$28,817 |
$757,732 |
3.80% |
Appendix C – Documents Reviewed
The following documents were collected and
reviewed for this project:
|
Documents |
|
2005 Audit of Overtime |
|
Budget 2002 – Information on Budget Reductions |
|
City of Ottawa 2005 Operating Budget |
|
Key Contacts and Organizational Chart |
|
KPMG Transit Review |
|
Overtime Review Brief Sent to Branch Directors |
|
Collective Agreements |
|
Management Bulletin - Running Human Resources and Finance
Reports Just Got Easier! - |
|
Management Accountability Matrix |
|
Management Investment Strategy Implementation -2005 Project Charter |
|
IBS Program Employee Handbook – May, 2004 |
|
Sample SAP Reports (from FSU Account Managers - various branches) |
|
Forms |
|
ELR/TR and PLR/TR Forms |
|
MMS-ITX System – Work Order |
|
MMS-ITX System – Time Sheet |
|
Data |
|
Attendance Improvement Program Statistics for 2004 and 2005 |
|
Budgeted Overtime for City of Ottawa Branches for 2003, 2004 and 2005 |
|
Overtime Costs for City of Ottawa Branches for 2003, 2004 and 2005 |
|
Overtime Costs Due to Statutory Holidays in 2005 |
|
Operational Budgets for City of Ottawa Branches |
|
Budgeted FTEs & Employee Headcount for 2005 |
Appendix D – Interviews Conducted
Thirty-seven (37)
interviews were conducted within the City of Ottawa organization. The tables
below list the individuals that were consulted with during this project:
I. Phase 1 Key Stakeholder
Interviews
|
Interview |
Attendees |
Date |
|
Payroll Division |
Jane Shannon |
April 21, 2006 and May 2, 2006 |
|
Labour Relations |
Marianne Phillips |
April 21, 2006 |
|
Financial Services Branch |
Wayne Martin Brian Flynn Brian McCuan Geoff Simpson Marian
Simulik (A/City Treasurer) |
April 26, 2006 |
|
Occupational Health and Safety (Absenteeism) |
Louise
Chayers-Ayers |
May 5, 2006 |
II. Phase 1 Branch Interviews
|
Interview |
Attendees |
Date |
|
Surface
Operations |
John Manconi
(Director) |
April 25, 2006 |
|
Transit
Services |
Alain Carle
(Director) Bob Goody |
April 25, 2006 |
|
By-Law Services |
Susan Jones (Director) Linda Anderson Delores MacAdam Troy Leeson |
April 25, 2006 |
|
Paramedic
Services |
Anthony Dimonte
(Chief) |
April 26, 2006 |
|
Utility
Services |
Ken Brothers
(Director) |
April 28, 2006 |
|
Library |
Barbara Clubb
(City Librarian) Monique
Desormeaux |
May 1, 2006 |
|
Planning
Environment & Infrastructure Policy |
Dennis Jacobs
(Director) |
May 1, 2006 |
|
Corporate
Communications |
Sharron Ellis
(Chief Communication Officer) |
May 2, 2006 |
|
Housing |
Russell Mawby
(Director) |
May 3, 2006 |
|
Long Term Care |
Diane Officer
(Director) |
May 3, 2006 |
|
Client Services
& Public Information |
Philip Clark
(Director) |
May 3, 2006 |
|
Economic
Development & Strategic Projects |
Rejean
Chartrand (Director) |
May 4, 2006 |
|
Legal Services |
Rick O’Connor
(City Solicitor) Diana Poitras |
May 4, 2006 |
|
Emergency
Measures |
John Ash
(Manager) |
May 4, 2006 |
|
Fire Services |
Rick Larabie
(Chief) Michel Seguin Helen Collier |
May 5, 2006 |
|
City Clerk |
Pierre Page
(City Clerk) |
May 5, 2006 |
|
Real Property
Asset Management |
Stephen
Finnamore (Director) |
May 5, 2006 |
|
Employment
& Financial Assistance |
Danielle Masse
(Director) |
May 5, 2006 |
|
Infrastructure
Services |
Wayne Newell
(Director) |
May 8, 2006 |
|
Building
Services |
Arlene Gregoire
(Director) |
May 8, 2006 |
|
Planning &
Infrastructure Approvals |
John Moser
(Director) |
May 8, 2006 |
|
Employee
Services |
Lois Pearce Jane Shannon |
May 8, 2006 |
|
Fleet Services |
Ron Gillespie
(Director) Phil Eagen |
May 8, 2006 |
|
Traffic &
Parking Operations |
Michael Flainek
(Director) |
May 9, 2006 |
|
Parks &
Recreation |
Aaron Bury
(Director) |
May 9, 2006 |
|
Information
Technology Services |
Janet
Harris-Campbell (Chief Information Officer) |
May 10, 2006 |
|
Financial
Services |
Marian Simulik
(A/City Treasurer) |
May 10, 2006 |
|
Public Health |
Dr. David
Salisbury (Medical Officer of Health) |
May 10, 2006 |
|
Cultural
Services & Community Funding |
Colleen Hendrick (Director) Debbie Hill |
May 15, 2006 |
III. Phase 2 Interviews
|
Interview |
Attendees |
Date |
|
FSU Account
Manager - Transit and Fleet Services |
Jim English
(FSU Account Manager) Geoff Simpson (FSU Manager for
PWS) |
May 10, 2006 |
|
FSU Account
Manager - Surface Operations and Traffic & Parking Operations |
Jim Raycroft
(FSU Account Manager) Geoff Simpson (FSU Manager for
PWS) |
May 11, 2006 |
|
FSU Account
Manager - Utility Services |
Francois Leury (FSU Account Manager) |
May 12, 2006 |
|
FSU Coordinator
-Infrastructure Services |
Andre Lessard (FSU Coordinator for Infrastructure Services) Geoff Simpson (FSU Manager for PWS) |
May 15, 2006 |
|
Transit
Services |
Bob Goody, Dave
St. Germaine, Jim English (FSU Account Manager) |
July 18, 2006 |
Our client service standards
1.
Determine, on
each engagement, who our clients are and directly ascertain their expectations
for our performance.
2.
Analyze our
clients’ needs and professional service requirements.
3.
Our mission
Develop client service
objectives that will enable us to fulfil our professional responsibilities,
satisfy our clients’ needs, and exceed their expectations. Prepare an
appropriate client service plan to achieve these client service objectives.
is to help
our clients and
our people excel.
4.
Execute the
client service plan in a manner that ensures commitments are met, potential
problems anticipated, and surprises avoided.
5.
Establish
effective and creative communication, both internal and external, to enhance
client perceptions of value and quality of our service.
6.
Provide
management with insights on the condition of their business and meaningful
suggestions for improvement.
7.
Continually
broaden and strengthen our relationships with key management personnel to
facilitate effective communication and foster client loyalty.
8.
Ensure that any
professional, technical, or client service problem is resolved promptly with
timely consultation in an environment of mutual respect.
9.
Obtain from the
client, either formally or informally, a regular assessment of our performance.
10. Receive fees that reflect the value of
services provided and responsibilities assumed and are considered fair and reasonable
by our clients.
Deloitte, Canada’s
leading professional services firm, provides audit, tax, financial advisory
services and consulting through more than 6,100 people in more than
47 offices. Deloitte & Touche LLP, operates in Québec as Samson
Bélair/Deloitte & Touche s.e.n.c.r.l. The firm is dedicated to helping its
clients and its people excel. Deloitte
is the
only professional services firm to be named to the Globe and Mail’s Report
on Business magazine annual ranking of Canada’s top employers for two
consecutive years: 35 Best Companies to Work for in Canada in 2001 and 50
Best Companies to Work for in Canada in 2002. “Deloitte” refers to Deloitte
& Touche LLP and affiliated entities. Deloitte is the Canadian member firm
of Deloitte Touche Tohmatsu. Deloitte Touche Tohmatsu is a Swiss Verein
(association), and, as such, neither Deloitte Touche Tohmatsu nor any of its
member firms has any liability for each other’s acts or omissions. Each of the
member firms is a separate and independent legal entity operating under the
name "Deloitte”, “Deloitte & Touche”, “Deloitte Touche Tohmatsu” or
other related names. The services described herein are provided by the Canadian
member firm and not by the Deloitte Touche Tohmatsu Verein.
© 2006 Deloitte & Touche LLP and affiliated entities.
![]()
[1] These percentages apply to the proportion of overtime drivers only. They do not apply to the proportion of actual overtime expenditures. Due to the fact that the causes of overtime usage are not formally tracked by the majority of the branches, objectively measuring and assessing the causes and proportionality of actual overtime expenditures was not possible within the scope of the review. Additional work to analyze and sample overtime costs and their causes may help the City to ascertain the proportion of overtime expenditures that are discretionary and non-discretionary.
[2] These percentages apply to the proportion of overtime drivers only. They do not apply to the proportion of actual overtime expenditures. Due to the fact that the causes of overtime usage are not formally tracked by the majority of the branches, objectively measuring and assessing the causes and proportionality of actual overtime expenditures was not possible within the scope of this review. Additional work to analyze and sample overtime costs and their causes may help the City to ascertain the proportion of actual overtime expenditures that are discretionary and non-discretionary.
[3] These percentages apply to the proportion of overtime
drivers only. They do not apply to the proportion of actual overtime
expenditures. Due to the fact that the causes of overtime usage are not
formally tracked by the majority of the branches, objectively measuring and assessing
the causes and proportionality of actual overtime expenditures was not possible
within the scope of the review. Additional work to analyze and sample overtime
costs and their causes may help the City to ascertain the proportion of
overtime expenditures that are discretionary and non-discretionary.