|
11. COMPLETING
BROADBAND COVERAGE IN RURAL OTTAWA ACHÈVEMENT DU RÉSEAU À LARGE
BANDE DANS LE SECTEUR RURAL D'OTTAWA |
That Council:
1.
Approve the
proposed public-private partnership framework to complete broadband coverage in
rural Ottawa, as outlined in this report;
2.
Authorize staff to
initiate the procurement process to complete rural broadband coverage;
3. Authorize a funding
contribution of up to $1,000,000 for this initiative;
4. Receive Morrison Hershfield's report entitled "TOWER FORECAST & DEPLOYMENT PLAN" and instruct staff to incorporate the principles contained therein related to communication tower management and avoidance of tower proliferation.
Que le Conseil :
1. Approuve le cadre de
partenariat public-privé proposé pour compléter le réseau à large bande dans le
secteur rural d'Ottawa, comme il est décrit dans le présent rapport;
2. Autorise le personnel à
engager le processus d'acquisition nécessaire pour compléter le réseau à large
bande;
3. Autorise une contribution
financière maximale de 1 000 000 $ pour la réalisation de ce projet;
4. Recevoir le rapport de la
société Morrison Hershfield intitulé TOWER FORECAST & DEPLOYMENT PLAN et
d'enjoindre le personnel de tenir compte des principes qui y sont énoncés pour
ce qui concerne la gestion des tours de communication et les mesures visant à
éviter la prolifération de ces tours.
1.
Planning
and Growth Management, Deputy City Manager’s report dated
13 September 2006 (ACS2006-PGM-ECO-0018).
2. Extract of Draft Minutes, 14 September 2006 (Agriculture and Rural Affairs Committee).
3. Extract of Draft Minute, 19 September 2006
(Corporate Services and
Economic Development Committee.
Report to/Rapport au :
Agriculture and Rural Affairs Committee
Comité de l'agriculture et des questions
rurales
and/et
Corporate
Services and Economic Development Committee
Comité des services organisationnels et du
développement économique
and Council/et au Conseil
13 September 2006/le 13 septembre 2006
Submitted by/Soumis par : John L. Moser, Acting Deputy City Manager/
Directeur municipal adjoint par
intérim,
Planning and Growth
Management/Urbanisme et Gestion de la croissance
Contact
Person/Personne-ressource : Michael Murr, Manager Economic Development
Economic Development and Strategic
Projects/Développement économique et Projets stratégiques
613-580-2424, est./poste 25195,
Michael.Murr@ottawa.ca
|
SUBJECT: |
|
|
|
|
|
OBJET : |
ACHÈVEMENT
DU RÉSEAU À LARGE BANDE DANS LE SECTEUR RURAL D'OTTAWA |
REPORT RECOMMENDATION
1. That the Agriculture and Rural Affairs Committee and Corporate Services and Economic Development Committee recommend that Council:
2.
3. Approve the proposed public-private partnership framework to complete broadband coverage in rural Ottawa, as outlined in this report;
4.
5. Authorize staff to initiate the procurement process to complete rural broadband coverage;
6.
7. Authorize a funding contribution of up to $1,000,000 for this initiative;
8.
9. Receive Morrison Hershfield's report entitled "TOWER FORECAST & DEPLOYMENT PLAN" and instruct staff to incorporate the principles contained therein related to communication tower management and avoidance of tower proliferation.
RECOMMANDATION DU RAPPORT
Que le Comité de l’agriculture et des questions rurales ainsi que le Comité des services organisationnels et du développement économique recommandent au Conseil :
1. D'approuver le cadre de
partenariat public-privé proposé pour compléter le réseau à large bande dans le
secteur rural d'Ottawa, comme il est décrit dans le présent rapport;
2. D'autoriser le personnel à
engager le processus d'acquisition nécessaire pour compléter le réseau à large
bande;
3. D'autoriser une
contribution financière maximale de 1 000 000 $ pour la réalisation de ce
projet;
4. De recevoir le rapport de
la société Morrison Hershfield intitulé TOWER FORECAST & DEPLOYMENT PLAN et
d'enjoindre le personnel de tenir compte des principes qui y sont énoncés pour
ce qui concerne la gestion des tours de communication et les mesures visant à
éviter la prolifération de ces tours.
BACKGROUND
The need for action to ensure availability of broadband Internet in rural areas of the City has been a priority since 2003 and is well anchored in City policy.
The current City Corporate Plan identifies an action to facilitate broadband access across Ottawa, particularly in rural areas as a key component of its Rural Agenda. Additionally, as part of it's Prosperity Agenda, the Corporate Plan also identifies a leadership role for the City in taking action to increase the use of broadband communication as an important element of establishing the conditions that support the start-up, growth and expansion of businesses.
The need for broadband was identified as a key priority at the Ottawa Rural Summit and more recently, the Rural Issues Advisory Committee identified "Expanded Broadband to cover 100% of the rural area" as the number one priority in its 2006 Workplan.
The Department has included initiatives to facilitate broadband access, to accelerate the implementation of broadband infrastructure and to support the development of broadband applications as key elements of its 2006 Departmental Plan.
These actions and priorities are also further anchored in the City's 20/20 Growth Management Strategy, which includes the Transportation Master Plan and Economic Strategy. Similarly, in April 2003, Ottawa City Council endorsed the 20/20 Broadband Plan with the goal of providing access to broadband for all citizens within five years. The plan is geared to expanding the City's innovation economy by connecting businesses, organizations and people more cost-effectively.
The City's multi-pronged efforts to date have been successful in increasing broadband availability in Ottawa's rural areas from less than 10% in 2003 to just over 60% today, but progress is slowing as the majority of villages and hamlets are completed and an innovative new approach is needed to complete broadband coverage in the less populated parts of rural Ottawa.
DISCUSSION
The City is using a multi-pronged strategy to accelerate the deployment of broadband services in rural Ottawa. Actions are underway in four main areas: demand aggregation, regional collaboration, broadband applications development and communication antenna tower management. The following paragraphs provide details about each of these four main thrusts.
1. Demand Aggregation
The most visible and successful of the City's initiatives in accelerating broadband has been its support of the Ottawa's Rural Communities Network (ORCnet) to aggregate demand for broadband services in the rural area and thus encourage providers to invest in the requisite infrastructure to supply high-speed Internet service.
ORCnet has worked at the grassroots level on a community-by-community basis to quantify demand, improve awareness and identify possible provider partners. In each of the villages, hamlets and rural population nodes that organized themselves in this fashion under the ORCnet umbrella, people could speak with a common voice and offer a very persuasive argument to providers. The approach has been instrumental in encouraging broadband providers to re-examine profitability and in many cases act to bring broadband to the community. Some 25 communities have participated in this program and others have profited by nearby activity. In each case, community participation including attendance at public meetings has been significant.
This approach has been highly successful with major providers such as Bell Canada and Rogers Communications as well as smaller local companies such as Storm Communications, SimplySurf and Northwind wireless participating in community rollouts.
2. Regional Collaboration
Additionally, the City of
Ottawa has taken a leadership role in a regional collaboration of community
stakeholders in eastern Ontario, referred to as the Eastern Ontario Broadband
Coalition (EOBC), which spans an area
from the Kawartha Lakes to the Quebec border.
The EOBC has been working to move its initiative forward for the
common objective of providing ubiquitous broadband connectivity to the
residents, businesses and institutions across eastern Ontario.
Completed in December 2005,
the first phase of the project was to produce a comprehensive and up to date
broadband gap-analysis of the un-served residences, businesses and institutions
in eastern Ontario. Then, the EOBC plans to proceed with the development of a
full implementation plan for the introduction of broadband/high-speed Internet
access to all un-served and under-serviced areas of eastern Ontario.
The City recognizes that a
lack of broadband is a problem faced universally by rural communities in
Ontario, and that financial support from the Provincial and/or Federal
governments would likely be needed to resolve the problem. Accordingly, the
City anticipated that this collaboration might result in a regional project
that the City could participate in.
The City's 2005 Annual Report
specifically refers to the City's role in the EOBC and its continuing support.
Moreover, continuing support of EOBC is published in the City Operating Plan
for 2006, among several strategies designed to achieve ubiquitous broadband
availability.
Although the City has been
poised to participate in a regional or provincial project funding commitments
for such initiatives are still very much at the planning stage.
3. Broadband Applications Development
Increased use of broadband has
a direct correlation to broadband demand and thus to a more profitable business
case for its deployment. The City has extended its broadband leadership role to
include fostering the development of broadband applications and has included in
its plans, a strategy to increase the use of broadband communication by
participating in the development of new broadband applications to improve
public access to health, education, culture and government services.
In this context, the City has
also supported the OttawaRAN, a fibre network connecting Ottawa's universities,
colleges and hospitals and research institutes. This network is managed by OCRI
and funded by its members. OttawaRAN also connects these institutions to
Ontario's ORION network and to CANARIE's CA*net4-the national broadband network.
4. Communication Antenna Tower Management
As an additional means to
accelerate the deployment of broadband infrastructure in rural communities, a
plan to foster implementation of required communications towers is under
consideration. The firm Morrison Hershfield was retained to complete an
independent study of the needs plus financial and technical viability for both
broadband providers, Internet providers and providers of other forms of
wireless communications services in Ottawa, such as cellular telephone and PCS
service, paging service etc.
Their report suggested a course of action for the City to
effectively manage the deployment of communications antenna towers that
included a suggestion that the City proceed with one or more public, private
partnerships (P3) for installation of up to 9 multi-purpose communication
towers. The plan would embrace community involvement, discourage unwanted
proliferation of new towers and yet ensure timely and adequate facilities that
enable both growth and inclusiveness of various wireless technologies for both
essential and non-essential services, in particular broadband.
While this strategy would go
along way toward providing a needed platform for broadband providers to extend
their service to more outlying communities, there is a continuing fear that the
growth in broadband availability would still be slower than desired. Ultimately
gaps might still remain in some of the most remote areas of the City,
particularly in those areas where population densities are the lowest.
The multi-pronged strategy
noted above has proven to be very successful, having succeeded in accelerating
broadband coverage in rural Ottawa from a starting point of less than 10% in
2003 to approximately 60% availability today.
We are now at a point however
where the low hanging fruit has been picked and advancement is slowing. The
process may have gone as far as it can go without further investment.
There is increasing concern
however, that the extent and timing of broadband penetration may fall short of
achieving the Council-directed policy of full coverage by 2008 without an
innovative P3 approach to complete the gaps. Much of the success to date in
expanding broadband in the City's rural areas has been through demand
aggregation on a community-by-community basis. This method is particularly
successful where population is concentrated in villages and hamlets, but is
less successful where population is spread out and not in concentrated nodes.
Preliminary discussions with
the Province have suggested that a project to resolve the remaining gaps in
broadband coverage in rural Ottawa would also meet several of the Province's
objectives. It is anticipated that a proposal for an advance pilot project
which would not only serve to complete broadband coverage in Ottawa but would
also support EOBC's broader objective of providing ubiquitous broadband to all
areas in Eastern Ontario would be well received. A project to prove the concept
and funding model in Ottawa as an example of what could be done throughout
eastern Ontario could be a persuasive proposition.
The goal of this project would
be to provide broadband accessibility to all remaining gaps in rural Ottawa
through direct participation in a public private partnership to install the
required broadband infrastructure. A procurement process will be used to select
a broadband service provider or providers who can best provide broadband access
to all remaining un-serviced areas in the city and leverage public and private
sector contributions to achieve a sustainable business case to justify the
provider's investment in the required infrastructure. The project, which is
proposed as a co-funded initiative in partnership with a private sector partner
will provide direct financial and/or in-kind support to the chosen provider(s)
to offset a portion the capital investment required.
The project is expected to
cost up to $3 million, with completion expected by August 31, 2007. It is
proposed that the City of Ottawa would contribute up to $1,000,000 and the private
sector partner would contribute the remaining capital investment.
This project estimate is based
in part on the detailed business plan that was submitted to the Province in
2004 by OCRI on behalf of ORCnet, which sought funding support for a $4.5 million
project to accomplish much the same objective. In that plan, $2.24 million was
requested from the Province and the remaining amount was to have been
contributed primarily by a private sector partner secured through a public
Procurement process. At that time, the project was to provide broadband
accessibility to some 24,500 rural households. Today, broadband coverage in
Ottawa has been extended to some of these households and the project scope can
now be reduced somewhat, to provide for approximately 15,000 households.
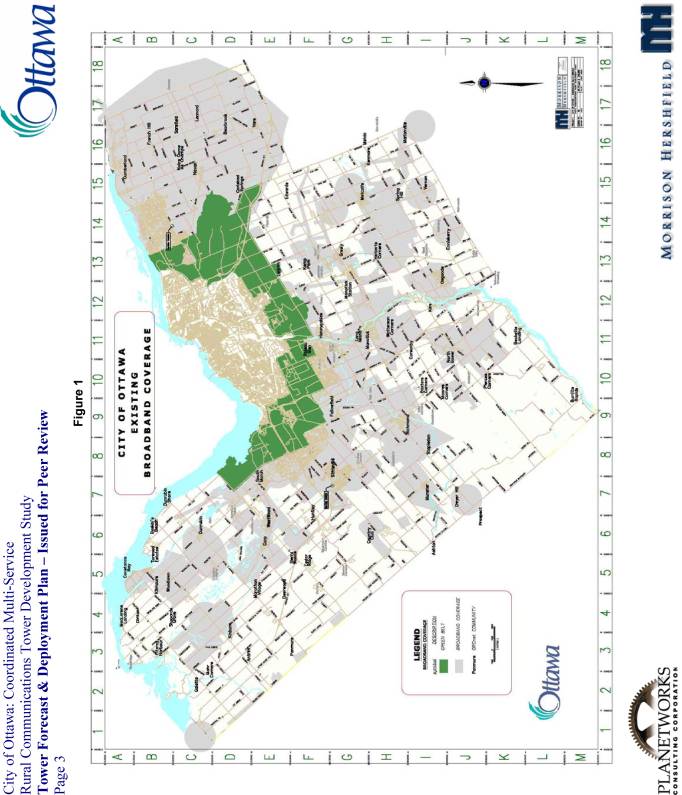
The attached map of Ottawa
(Document 1) illustrates existing rural broadband availability in those areas
shaded in grey and un-serviced areas shown un-shaded. When complete, the
project will provide broadband services to all residents and business shown in
the remaining un-shaded areas or gaps, representing some 15,000 households or
approximately 43,000 people.
RURAL IMPLICATIONS
Availability to broadband provides a means for rural communities to fully participate in the digital economy. Citizens and businesses will benefit from new and improved services, increased investment opportunities and business expansion.
Applications such as government services, health care, education etc. are present among a growing range of online applications and information sources that require this type of connection speed. In addition, broadband has proven to be an economic enabler and developing new ways of doing business with broadband will allow farms and rural companies to become more efficient by lowering costs and improving productivity.
Farming has become progressively more dependent on information technology. More and more farmers rely on timely access to information, weather, current market pricing, fuel costs, etc. Access to information and reducing transactional costs has become critical to a farmer's ability to maintain a profitable operation. The requirement for high-speed communications has also been identified by businesses that support the farming community such as implement dealers, feed suppliers etc.
Importantly, broadband access enables people to telecommute, which in many cases can eliminate or reduce the need for driving to the urban core to work. Similarly, workers and businesses that currently reside in Ottawa's rural areas are now stating that they need access to broadband networks. For example, knowledge workers such as engineers, lawyers and consultants have indicated a need for access to high-speed communications to provide required services to clients across Canada and around the world. Some employers insist that their employees have an ability to telecommute. Cottage and small/home-office (SoHo) businesses need broadband to compete effectively in a shrinking global market.
Public consultation was not required for preparation of this report. The Rural Issues Advisory Committee however, has identified "Expanded Broadband to cover 100% of the rural area" as its number 1 priority in its 2006 Workplan. The need for broadband was identified as a high priority at the Ottawa Rural Summit held in December 2005.
Funds have been provided in the 2006 Operating and Capital budgets. $300,000 is available in cost centre 111212, Rural Affairs office and the balance of $700,000 is available in internal order 904071, Rural Road Reconstruction/Rehabilitation
SUPPORTING DOCUMENTATION
Document 1 Map of Ottawa illustrating broadband coverage and gaps
Document 2 Morrison Hershfield Study Report - "Tower Forecast & Deployment Plan".
Planning and Growth Management Department, Economic Development staff initiate a Procurement process to identify a private sector partner in order to implement the program proposed in this report.
 |
Tower Forecast & Deployment PLAN City of Ottawa Coordinated
Multi-Service Rural Communications Tower Development Study |
Table of Contents
3.3 Prioritization Methodology
4.1 Telecoms Site Services Survey
4.2 WTAS Recommended Rate Table
5.3 Public-Private Partnership
6. Proposed Tower Deployment
Plan
Appendix 1: Telecoms Site
Services Survey
Appendix 2: Estimated Tower
Costs
Appendix 3: Estimated Tower
Revenue
Appendix 4: Cash Flow Analyses
The City of Ottawa engaged Morrison Hershfield in association with Planetworks Consulting Corporation to undertake the Coordinated Multi-Service Rural Communications Tower Deployment Study. The City’s purpose in having this study undertaken is two-fold, specifically:
§ to accelerate the deployment of broadband services in rural Ottawa
§ to develop a protocol for the implementation of communications towers
A draft protocol has been prepared and submitted by the Study Team, and is currently under consultation with the City and industry stakeholders.
This report addresses the first purpose, i.e. to accelerate the deployment of broadband services in rural Ottawa. This is the final report of the Coordinated Multi-Service Rural Communications Tower Development Study, and presents the tower forecast, associated business case analysis, and proposed deployment plan. It is intended to be a stand-alone document.
The main inputs for the tower forecast and deployment plan came from the tower inventory, tower technology report, radio technology review, industry survey, analysis of existing broadband and cellular/PCS coverage, and stakeholder consultation.
Based on locations of existing towers and inputs from the stakeholders, the estimated existing broadband and cellular/PCS coverage was plotted on the map of Ottawa. As agreed with the City, because the emphasis is on rural coverage, coverage in the downtown core and the Green Belt was not plotted.
Based on broadband coverage information collected in the industry survey, the current broadband coverage was plotted on the map of Ottawa. This included coverage of the following broadband service providers, with broadband technology used indicated in parentheses:
§ Arryba (Wireless)
§ Bell (ADSL & Wireless)
§ Inukshuk (Wireless)
§ Rogers (CATV & Wireless)
§ SimplySurf (Wireless)
§ Storm (Wireless)
In the case of Arryba and Storm, tower locations were provided, instead of coverage data. Accordingly, wireless broadband coverage was estimated as follows:
§ Arryba: coverage radius of 3 Km [1]
§ Storm: coverage radius of 4 Km [2]
The estimated current aggregated broadband coverage is
shown on Figure 1 (overleaf). As will be seen, there are significant gaps in
broadband coverage in rural Ottawa. It is not surprising, therefore, that some
60 communities in rural Ottawa have banded together to form ORCnet
(www.orcnet.ca), a community-based organization dedicated
to ensuring high-speed access availability to all rural residents of the City
of Ottawa. The names of the ORCnet communities were overlaid on Figure 1 to
help determine where broadband coverage was most needed.
Cellular/PCS coverage was also investigated because the cellular/PCS coverage and broadband coverage gaps might overlap and, therefore, cellular/PCS operators might be interested in sharing new tower locations with broadband operators and thereby improve the business case.
Cellular/PCS coverage was not provided by any of the cellular/PCS operators. Instead Bell Mobility and Rogers Wireless provided the locations of base station towers. Telus Mobility did not provide any tower location data[3].
Cellular/PCS coverage was then plotted on the map of Ottawa using the following assumptions:
§ Bell Mobility antennas located at top of tower
§ Rogers Wireless antennas located at 65m or 10m below Bell Mobility antennas on those sites identified as co-locations
§ cellular coverage footprint calculated using Okumura/Hata method at 850 MHz
§
suburban
built environment near Green Belt, otherwise rural
§
average
topography
§
high
vegetation density
§
desired coverage probability: 90%
§
handheld transmitter power: 27 dBm
§
mean effective gain of handheld antenna: -11 dBi
§
gain of the base station sector antenna: 17 dBi
§
diversity gain at the base station: 6 dBi
§
minimum acceptable receive signal level: -100 dBm
§
height of handheld antenna above ground: 1.5 m
§
Pathloss adjustment for dense vegetation / trees: 5 dB
The estimated aggregated cellular/PCS coverage is shown on Figure 2 (overleaf). As will be seen, there are some cellular/PCS coverage gaps, particularly in the outlying areas. In addition, it is understood that some of the supposedly “covered” areas have poor coverage due to terrain, vegetation, etc.
Considering the existing broadband coverage and the ORCnet communities, circles representing probable broadband coverage from new towers were overlaid on Figure 1. The result is given in Figure 3 (overleaf).
With an assumed base station tower height of at least 30 meters[4] (to be clear of foreground obstructions, e.g. the local tree height), a radius of 10 Km was selected on the following basis:
§ Subscribers within 1 Km of the tower are likely to receive coverage without use of an external antenna.
§ Subscribers between 1 and 4 Km of the tower will require an external antenna, typically located on the side of the house.
§ Subscribers located between 4 and 10 Km for the tower will require a mast so that the antenna is well above the roofline.
It is felt that it is not unreasonable to expect a subscriber in a rural area to erect his own mast, as he does to receive television signals.
The tower circles were drawn on the map in a manner so as to minimize the number of towers, while maximizing broadband coverage to the ORCnet communities. A total of nine towers will be necessary to include all ORCnet communities. For sake of identification, the towers were named Tower A to Tower I, as indicated on Figure 3 (overleaf). The coordinates of the centres of the circles are indicated in the following table; however, the actual location of the tower could be anywhere in a search radius of, say, 500 to 1500 meters.
|
Approximate Tower Locations |
||
|
Tower |
Latitude |
Longitude |
|
A |
45 27 36 |
76 04 11 |
|
B |
45 23 15 |
76 11 06 |
|
C |
45 17 48 |
76 00 08 |
|
D |
45 09 10 |
75 56 06 |
|
E |
45 04 05 |
75 45 55 |
|
F |
45 12 57 |
75 42 23 |
|
G |
45 11 54 |
75 27 59 |
|
H |
45 18 11 |
75 30 37 |
|
I |
45 25 25 |
75 24 16 |
A stakeholders’ conference was held on 5 April 2006 to discuss, amongst other things, the location of the proposed towers. The wireless ISPs and cellular/PCS operators were requested to advise whether any of the proposed towers might be of interest to them. The companies which responded advised that they were interested in collocating on the following towers:
|
Expressed Collocation Interest |
|||
|
Tower |
Bell Mobility |
Rogers Wireless |
Telus Mobility |
|
A |
|
|
|
|
B |
|
|
yes |
|
C |
|
yes |
yes |
|
D |
yes |
yes |
|
|
E |
|
|
|
|
F |
|
yes |
|
|
G |
|
|
|
|
H |
|
|
yes |
|
I |
|
|
|
No interest was voiced by any of the wireless ISPs. However, this is not to say that the wireless ISPs have no interest in the proposed towers. We believe that, for various internal reasons, the wireless ISPs were not able to respond within the allowed timeframe.
A method to prioritize the importance of each of the nine towers was needed in order to establish the tower deployment plan. This was done based on the following factors, specifically:
§ number of ORCnet communities within a tower coverage radius without full broadband coverage
§ population density
§ rate of increase in population density
Using weighting factors, points were assigned to each of the above factors as follows:
Communities Without Broadband Coverage
An assessment of the number of ORCnet communities that had full broadband coverage in each tower circle was made by using two sources:
§ the location of the community on the broadband coverage footprint in Figure 3
§ the ORCnet table of coverage (www.orcnet.ca/list_of_hamlets.html)[5]
One point was assigned to each community without full broadband coverage. In some cases, an ORCnet community fell within two tower coverage circles. In these cases, each tower was assigned ½ point for that particular community.
Population Density
Based on the population data in the “A Profile of the Ottawa Population, Demographic Report 1996 – 2001”, dated November 2002 and sponsored by United Way/Centraide Ottawa, in particular the population density chart on page 31 (see Figure 4 below), an assessment of average population density in the tower coverage circle was made as follows:
§ low: 1 point
§ medium: 3 points
§ high: 5 points
Population Growth
Likewise, the population change chart on page 32 (see Figure 5 overleaf) was used to assess the rate of increase in population density as follows:
§ low: 1 point
§ medium: 3 points
§ high: 5 points
Prioritization Result
The total number of points (number of communities without full broadband coverage, population density factor, and increase in population density factor) was calculated, and the towers were ranked from highest to lowest. The results are shown in Figure 6 (overleaf), with “1” being the highest priority. As will be seen, Tower B has the highest priority, with Towers A and C in second place, Tower D in third place, and Tower F in fourth place. It is recognized that this prioritization methodology is subjective and influenced by weighing factors. Nevertheless, it does provide an indication of relative priority.
It is noted that, as indicated in section 3.2 above, two cellular/PCS operators have expressed interest in Towers C and D, one cellular/PCS operator has expressed interest in Towers B, F and H, and no interest was expressed for the other towers.
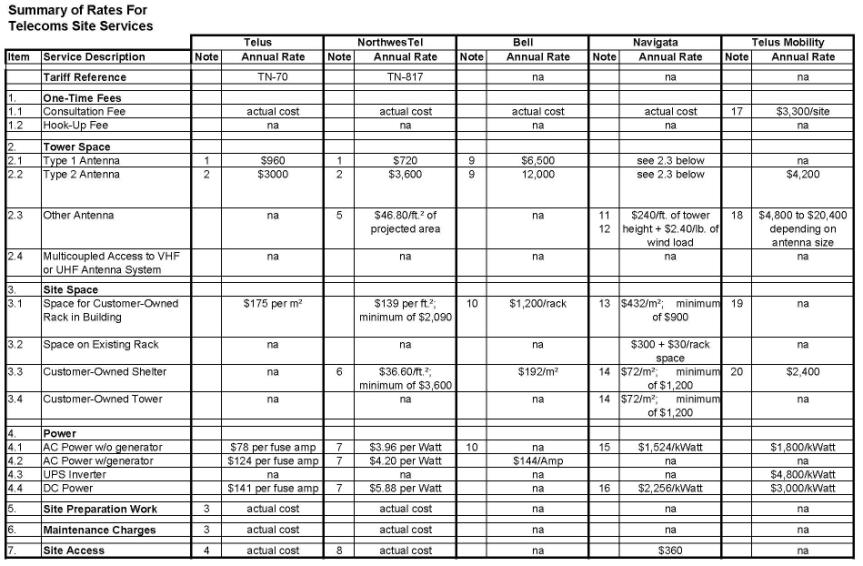
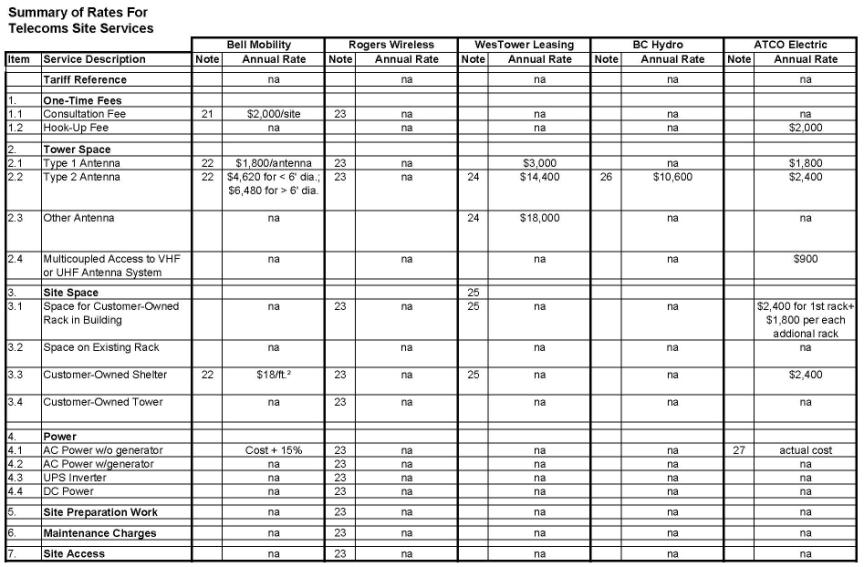
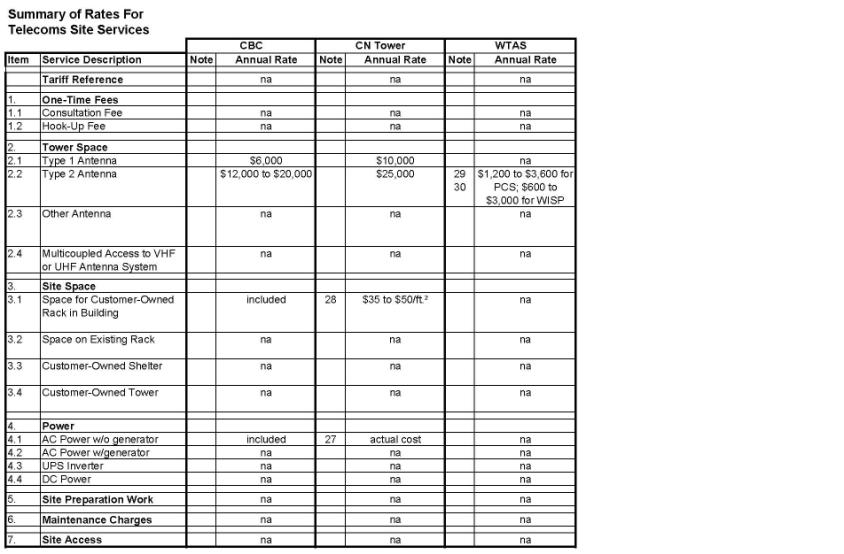
As a part of the business case
analysis for the Coordinated Multi-Site Rural Communication Tower Deployment
Study, the Study team undertook its own survey of rates charged in the Canadian
telecoms market for various telecom site services; rates were obtained from the
following companies[6]:
§
Telus
§
NorthwesTel
§
Bell
§
Navigata
§
Telus Mobility
§
Bell Mobility
§
WesTower Leasing
§
BC Hydro
§
ATCO Electric
§
CBC
§
CN Tower
§
WTAS[7]
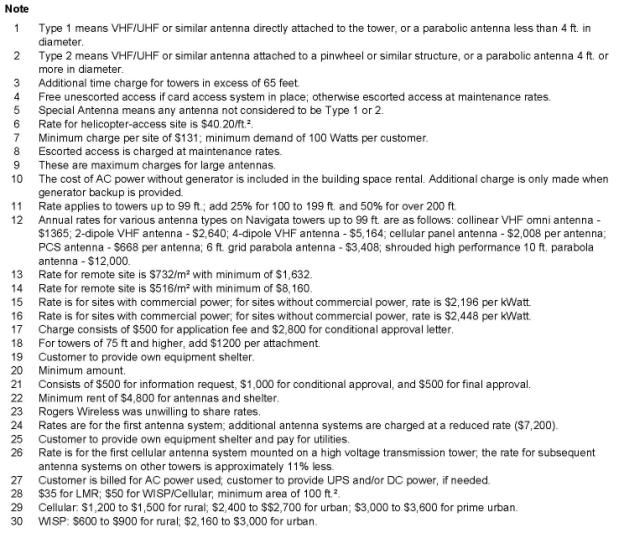
The results of this survey are
given in Appendix 1. While not
exhaustive, the survey did indicate that a wide range of methodologies and
price levels are used in the industry for the following telecoms site services:
§
one-time fees:
consultation, hook-up, etc.
§
tower space:
space on tower for various types of antennas, with rates usually based on
antenna size[8]
§
site space:
space for a customer-owned rack in a building, space for a shelf on an existing
rack, space for a customer-owned building, space for a customer-owned tower,
etc.
§
power:
AC power with and without generator, UPS, DC power, etc.
§
site preparation: site
levelling, fencing, access road, etc.
§
maintenance charges:
maintenance of customer-owned equipment
§
site access:
accompanied and unaccompanied access
The following observations are offered:
§ There is surprisingly little differentiation in rates between urban and rural. In the Study Team’s view, such differentiation is appropriate because urban sites are generally able to command higher rates than rural sites.
§ Some antenna pricing methodologies are technical-based, while others are commercial-based. The technical-based methodologies determine charges on the basis of antenna size and, in one case, wind loading. On the other hand, the commercial-based methodologies tend to be overly simplistic. For example, there is no price difference between a large cellular antenna and a smaller PCS antenna. In the view of the Study team, the technical-based methodology is the fairer of the two; however, the input of a technical person is therefore needed to determine the charge.
The telecoms site services survey focused on charges for collocation at existing telecoms sites. The survey did not include a survey of rates charged by municipalities for use of existing structures, such as street lighting poles, for Wi-Fi hot spots. As agreed with the City, this is outside the scope of the study and could be the subject of a follow-up study. However, from information gleaned from industry magazines and websites, it appears that some municipalities are charging nominal amounts, e.g. less than $50 per month, for use of street lighting poles.
In 2005, the Real Estate
Services Branch of the City of Ottawa commissioned a survey of pricing and
structure of leases to wireless system operators for antenna sites and
attachments on City-owned buildings and facilities. The City requested the
Study Team to also comment on the recommended rate table set out on page 25 of
the Wireless Telecom Agreements Survey (WTAS), specifically:
|
WTAS Recommended Rate Table |
|||||
|
Equipment |
Prime Urban |
Urban |
Rural |
Term |
Escalation |
|
PCS Antenna |
$250
- $300 per month per attachment |
$200
- $225 per month per attachment |
$100
- $125 per month per attachment |
5
& three 5 year options |
CPI |
|
Satellite Dish |
$2,500
- $3,000 per annum |
$2,500 per annum |
$2,500 per annum |
5
& three 5 year options |
CPI |
|
Vacant Tower Site |
$20,000
- $25,000 per annum |
$12,000
- $18,000 per annum |
$3,000
- $5,000 per annum |
5
& three 5 year options |
CPI |
|
Wireless ISP on Existing Tower |
|
$180
- $250 per month per
attachment |
$50
- $75 per month per attachment |
5
& three 5 year options |
CPI |
The Study Team did so in a separate report already submitted to the City. The key comments made on the WTAS Recommended Rate Table are summarized as follows:
§ The table distinguishes between three classes of telecom site, namely prime urban, urban, and rural. As noted above, the Study team finds this differentiation both appropriate and commendable. In the telecoms site services survey, the Study Team found that little distinction was made by most companies, whereas it is most appropriate to make such a distinction.
§ The table includes rates for use of vacant tower sites. However, the rates are fixed and are not related to the amount of property used by the lessee. It is suggested that a rate per square meter ($/m²) be established for each site classification (prime urban, urban, and rural).
§ The table proposes rates for cellular/PCS antennas, with rates being highest for prime urban and lowest for rural. The rates proposed for prime urban are comparable to those rates charged by most telecom companies surveyed by the Study Team. In fact, some charge even higher rates. The proposed rates for urban and rural are lower than those for prime urban. Since the companies surveyed generally do not distinguish between prime urban, urban, and rural, the proposed rates for urban and rural appear to be slightly below market value. Having said that, the Study Team feels that the sliding scale is indeed appropriate and, if these rates are implemented, the City will be setting a good example to the telecoms operators and encouraging them to extend service to rural areas.
§ The table proposes rates for wireless ISP antennas, with rates being highest for urban and lowest for rural. The rates for wireless ISP antennas are lower than those for cellular/PCS antennas. The telecom companies surveyed do not make a rate distinction between cellular/PCS antennas and wireless ISP antennas. In fact, technically there is no difference from a tower loading perspective and no technical reason to have a lower rate for wireless ISP antennas. However, the reality of the situation is that wireless ISPs are generally small companies, serving clusters of customers in which the large operators are not interested. Most of the wireless ISPs are on tight budgets and just cannot afford to pay the market rates for antenna attachment. In many instances, if they had to pay market rates, small wireless ISPs would not be able to afford to provide the service. In view of the City’s goal to provide broadband services to all of rural Ottawa, it is appropriate that the City provide attractive rates for wireless ISP antenna attachment on its facilities.
§ The table proposes a lease term of five years with three additional and optional five year terms. The Study team feels that the proposed term of lease is reasonable.
§ The table proposes escalation in accordance with the consumer price index (CPI). The Study team feels that the proposed escalation is reasonable.
For the purpose of business case analysis, three different towers were selected so that the capital and operating costs could be compared. The following three towers were selected for analysis purposes because they represent the likely range of towers needed for rural Ottawa:
§ 30 meter self-support tower
§ 30 meter monopole tower
§ 80 meter guyed tower
The estimated capital and operating costs for these three towers are detailed in Appendix 2. As will be seen, it was assumed that land would be rented, rather than purchased. The costs are summarized as follows:
|
Summary of Tower
Costs |
||
|
Tower Type |
Capital Cost (C$) |
Annual Expenses[9]
(C$) |
|
80 Meter Guyed |
$232,000 |
$9,500 |
|
30 Meter Monopole |
$174,800 |
$8,150 |
|
30 Meter Self-Support |
$157,750 |
$8,400 |
Possible revenues for collocation services have been estimated. For analysis purposes, three scenarios were hypothesized, specifically:
§ Scenario 1: one mobile radio operator, one wireless ISP, and two cellular/PCS carriers
§ Scenario 2: one mobile radio operator, one wireless ISP and one cellular/PCS carrier
§ Scenario 3: one wireless ISP and one cellular/PCS carrier
These scenarios were picked as they present the likely range of tenants requiring collocation services. The revenue estimates are based on the following assumptions:
§ The site operator will provide a building for tenant equipment racks; lockable cages will be provided for each tenant.
§ Each tenant will have one equipment rack.
§ Tenants will obtain an electrical power meter and will pay for their electrical power consumption.
§ Tenants will provide their own rectifier and battery.
§ Tenants will provide their own generator, if needed to top up batteries.
§ Each tenant will have one antenna for backhaul to the network.
It is also assumed that the only charges will be for antenna space and building space. For analysis purposes, the following annual rates were used:
§ mobile radio antenna: $2,400
§ wireless broadband antenna: $900
§ cellular/PCS antenna: $1,500
§ backhaul antenna: $2,400
§ equipment rack: $1,000
Based on the survey, these are felt to be reasonable for rural Ottawa. Revenue estimates are detailed in Appendix 3 and are summarized as follows:
|
Summary of Estimated Revenue |
|||
|
Item |
Scenario 1 |
Scenario 2 |
Scenario 3 |
|
No. of
Tenants |
4 |
3 |
2 |
|
Tower
Space |
$32,700 |
$19,500 |
$14,700 |
|
Building
Space |
$4,000 |
$3,000 |
$2,000 |
|
Total |
$36,700 |
$22,500 |
$16,700 |
The cash flows for the three scenarios were run for each of the three towers. The following assumptions were made:
§ The tower capital cost will only be incurred in year 0; subsequent capital improvements will be included as maintenance under operating expenses.
§ Operating costs will increase each year based on inflation (assumed at 2%).
§ Tenant rates will be fixed for five years.
§ Tenant contracts will be renegotiated every five years; rates will be increased by 10.41% every five years (2% compounded over five years).
§ The discount rate is 6%.
The cash flows for the three scenarios are detailed in Appendix 4. As will be seen, the capital recovery period in most cases is long; consequently, financial performance over ten and fifteen years was examined. Results for each tower configuration are summarized in the tables below under the following financial attributes:
§ NPV: net present value
§ IRR: internal rate of return
§ CRP: capital recovery period
|
Initial Financial Results |
||||||
|
80 Meter Guyed Tower |
||||||
|
|
Scenario 1 |
Scenario 2 |
Scenario 3 |
|||
|
Attribute |
10 Years |
15 Years |
10 Years |
15 Years |
10 Years |
15 Years |
|
NPV |
-$14,455 |
$61,785 |
-$117,441 |
-$79,612 |
-$159,506 |
-$137,365 |
|
IRR |
5% |
10% |
-7% |
0% |
-15% |
-6% |
|
CRP |
7+ years |
14+ years |
15+ years |
|||
|
30 Meter Monopole Tower |
||||||
|
|
Scenario 1 |
Scenario 2 |
Scenario 3 |
|||
|
Attribute |
10 Years |
15 Years |
10 Years |
15 Years |
10 Years |
15 Years |
|
NPV |
$52,687 |
$133,842 |
-$50,299 |
-$7,554 |
-$92,364 |
-$65,308 |
|
IRR |
12% |
16% |
-1% |
5% |
-8% |
-1% |
|
CRP |
5+ years |
10+ years |
15+ years |
|||
|
30 Meter Self-Support Tower |
||||||
|
|
Scenario 1 |
Scenario 2 |
Scenario 3 |
|||
|
Attribute |
10 Years |
15 Years |
10 Years |
15 Years |
10 Years |
15 Years |
|
NPV |
$66,889 |
$147,342 |
-$36,097 |
$5,946 |
-$78,162 |
-$51,808 |
|
IRR |
14% |
18% |
1% |
7% |
-7% |
0% |
|
CRP |
5+ years |
9+ years |
14+ years |
|||
As can be seen, the financial results for Scenario 1 (with four tenants) for the 30 meter monopole and 30 meter self-support towers are reasonable, with a capital recovery period of five years, and might be of interest to an investor, e.g. a tower operator. The other results are generally poor and are not likely to be attractive to an investor.
One of the operating costs is land rental; an annual amount of $5,000 had been assumed in the above analysis. If the tower was located on City land and if the City chose to not charge rent (as part of a P3 relationship), then the financial results would improve. The analysis was reiterated with zero land rental cost; the results are as follows:
|
Financial
Results With Zero Land Cost |
||||||
|
80 Meter Guyed
Tower |
||||||
|
|
Scenario 1 |
Scenario 2 |
Scenario 3 |
|||
|
Attribute |
10 Years |
15 Years |
10 Years |
15 Years |
10 Years |
15 Years |
|
NPV |
$23,201 |
$113,485 |
-$79,785 |
-$27,912 |
-$131,640 |
-$99,107 |
|
IRR |
8% |
13% |
-2% |
4% |
-10% |
-2% |
|
CRP |
6+ years |
11+ years |
15+ years |
|||
|
30 Meter
Monopole Tower |
||||||
|
|
Scenario 1 |
Scenario 2 |
Scenario 3 |
|||
|
Attribute |
10 Years |
15 Years |
10 Years |
15 Years |
10 Years |
15 Years |
|
NPV |
$90,343 |
$185,543 |
-$12,643 |
$44,146 |
-$67,511 |
-$31,186 |
|
IRR |
16% |
20% |
4% |
10% |
-4% |
3% |
|
CRP |
4+ years |
8+ years |
12+ years |
|||
|
30 Meter
Self-Support Tower |
||||||
|
|
Scenario 1 |
Scenario 2 |
Scenario 3 |
|||
|
Attribute |
10 Years |
15 Years |
10 Years |
15 Years |
10 Years |
15 Years |
|
NPV |
$104,545 |
$199,042 |
$1,559 |
$57,646 |
-$53,309 |
-$17,686 |
|
IRR |
19% |
22% |
6% |
11% |
-2% |
4% |
|
CRP |
4+ years |
7+ years |
11+ years |
|||
As can be seen, this significantly improves the results … to the point where a potential investor is likely to be interested in Scenario 1 (with four tenants) and possibly Scenario 2, if a 30 meter tower will suffice.
The analysis was reiterated again with zero land cost and rates increased by 25% to the following levels:
§ mobile radio antenna: $3,000
§ wireless broadband antenna: $1,125
§ cellular/PCS antenna: $1,875
§ backhaul antenna: $3,000
§ equipment rack: $1,250
|
Financial
Results With Zero Land Cost & Rates Increased By 25% |
||||||
|
80 Meter Guyed
Tower |
||||||
|
|
Scenario 1 |
Scenario 2 |
Scenario 3 |
|||
|
Attribute |
10 Years |
15 Years |
10 Years |
15 Years |
10 Years |
15 Years |
|
NPV |
$89,743 |
$204,846 |
-$38,990 |
$28,099 |
-$91,571 |
-$44,093 |
|
IRR |
14% |
18% |
2% |
8% |
-4% |
3% |
|
CRP |
5+ years |
8+ years |
12+ years |
|||
|
30 Meter
Monopole Tower |
||||||
|
|
Scenario 1 |
Scenario 2 |
Scenario 3 |
|||
|
Attribute |
10 Years |
15 Years |
10 Years |
15 Years |
10 Years |
15 Years |
|
NPV |
$156,885 |
$276,903 |
$28,152 |
$100,157 |
-$24,429 |
$27,965 |
|
IRR |
23% |
26% |
9% |
14% |
3% |
8% |
|
CRP |
3+ years |
6+ years |
8+ years |
|||
|
30 Meter
Self-Support Tower |
||||||
|
|
Scenario 1 |
Scenario 2 |
Scenario 3 |
|||
|
Attribute |
10 Years |
15 Years |
10 Years |
15 Years |
10 Years |
15 Years |
|
NPV |
$171,087 |
$290.403 |
$42,354 |
$113,657 |
-$10,227 |
$41,465 |
|
IRR |
26% |
28% |
12% |
16% |
5% |
10% |
|
CRP |
3+ years |
5+ years |
7+ years |
|||
As can be seen, this provides further improvement, to the level where Scenario 2 with 30 meter towers would be viable.
Basically, there are three options for deployment of the proposed towers, specifically:
§ public sector
§ private sector
§ public-private partnership (P3)
With the public sector option, the City would implement and operate the new towers. Since the City’s primary goal in this venture is to accelerate rural broadband coverage, the City would only need to cover its operating costs and recover its capital investment. Accordingly, tenant rates could be reduced if there were a large number of tenants. In theory, this could be a low cost option.
The problem is that the City has no experience in this type of business and would have to undergo an extensive learning period plus acquire or engage technical expertise. There is also the danger that bureaucratic inefficiencies could creep in, thereby negating potential cost savings and other advantages. It is noted that, in the Industry Survey, the cellular/PCS carriers and wireless ISPs voiced concerns regarding City tower ownership.
With the private sector option, a private sector company would implement and operate the new towers. However, there are two sub-options in this regard, specifically:
§ Sub-Option 1: One of the cellular/PCS carriers would take the lead and would champion the new tower; other cellular/PCS carriers, wireless ISPs and mobile radio operators would become tenants on the tower[10].
§ Sub-Option 2: A company in the business of operating towers would implement and operate the tower; the cellular/PCS carriers, wireless ISPs and mobile radio operators would become tenants on the tower.
Sub-option 1 should be quicker to implement, if a carrier steps up and champions the tower, whereas Sub-Option 2 would likely require a public tender process to select the tower operating company.
Sub-Option 2 could possibly result in higher collocation rates, as the tower operator needs to make a profit in order to survive … unlike Sub-Option 1 where the carrier is taking its profit from its cellular/PCS business and is able to expense the tower costs.
The use of a tower operating company is typically used with high demand sites, e.g. choice sites in prime urban locations. The proposed tower locations are not likely to be viewed as prime sites and therefore interest may not be high in the eyes of tower operators. Some incentives might be needed to attract a tower operator.
In the public-private partnership (P3), the City would partner with the private sector partner, either under Sub-Option 1 or Sub-Option 2. As was seen in the sensitivity analysis in section 4.6, zero land rental cost significantly improves the business case. Therefore, the provision of City land for the tower is an important contribution which the City can make.
The City could also have its Engineering Dept. assist in selected capital cost items, e.g. site development, site fencing, access road, etc. This would reduce the capital cost for the tower constructor and further improve the business case.
The Study Team feels that the public-private partnership would be the best approach to implement the proposed towers in rural Ottawa.
The question remains as to whether the towers should be implemented and managed by a carrier (per Sub-Option 1) or a tower operator (per Sub-Option 2). The Study team feels that, if a carrier steps forward and offers to champion the tower, the City should select Sub-Option 1, because this is the most expedient option and should result in lower collocation rates.
If on the other hand no carrier is interested in
championing the tower, the City should consider pursuing Sub-Option 2 and issue
a public invitation to companies to submit tower operating proposals. However,
there is the danger that the business case may not be attractive to tower
operators; in such case, the City could ask bidders to quote the amount of
subsidy (and/or other incentives) required. The company requesting the lowest
requested subsidy (and/or incentives) would be awarded the contract to
construct and operate the tower.
As was seen in Section 3.3, based on broadband coverage requirements, Tower B has the highest priority, with Towers A and C in second place, Tower D in third place, Tower F in fourth place, and the others following. On the other hand, two cellular/PCS operators expressed interest in Towers C and D, one cellular/PCS operator expressed interest in Towers B, F and H, and no interest was expressed for the other towers. Hence, there is a partial match between broadband coverage requirements and carrier interest. Therefore, the following tower deployment plan is proposed for the City’s consideration:
§ Year 1: Towers C and D
§ Year 2: Towers B and F
§ Year 3: Towers A and E
§ Year 4: Towers G and H
§ Year 5: Tower I
Towers C and D are proposed for Year 1 because broadband coverage is needed in these two areas and, with two carriers interested in collocation, there should be a viable business case. Similar logic was applied for Year 2, except that only one carrier expressed interest in these two towers and, therefore, the business case may not be quite as good.
It is suggested that the City proceed with Towers C and D as a start. The next steps should include:
§ determining whether a carrier is willing to champion each of the towers (Sub-Option 1)
§ if there is none, identifying companies that would be interested in operating the towers (Sub-Option 2)
§ obtaining collocation commitments from wireless ISPs, land mobile radio operators, and other possible users with new service offerings
§ identifying possible City-owned locations for Towers C and D
§ determining whether the Engineering Dept. can assist in tower site work
It is important to get as many tenants to sign up in advance of constructing any tower and to get a champion to step forward at the earliest possible time.
Although this is a five year program, it must be reviewed annually. Depending on what the major cellular/PCS and broadband companies are doing in the area, it may not be necessary to construct the towers foreseen for the latter years. For example, in the beginning of this study, the Study Team estimated that nine towers would be needed to provide broadband services to all communities in rural Ottawa. However, as a result of the expanded broadband services of Bell and Rogers Wireless (using Inukshuk Wireless) introduced in Q1 2006, coverage to rural Ottawa has increased such that Tower I may not be needed. It is not possible to predict what other developments may come to pass in future years; the need for some of the proposed towers might be eliminated. Therefore, it is vital to review and adjust the tower deployment program annually.
|
Estimated Tower Capital Costs |
||||||||
|
80 Meter Guyed Tower |
30 Meter Monopole Tower |
30 Meter Self-Support Tower |
||||||
|
|
|
Annual |
|
|
Annual |
|
|
Annual |
|
|
|
Amount |
|
|
Amount |
|
|
Amount |
|
Item |
Description |
(C$) |
Item |
Description |
(C$) |
Item |
Description |
(C$) |
|
1 |
land -
1.0 hectare |
rented |
1 |
land -
1.0 hectare |
rented |
1 |
land -
1.0 hectare |
rented |
|
2 |
tower
material |
$44,000 |
2 |
tower
material |
$40,300 |
2 |
tower
material |
$18,500 |
|
3 |
tower
foundations |
$30,000 |
3 |
tower
foundations |
$30,000 |
3 |
tower foundations |
$30,000 |
|
4 |
tower
installation |
$33,000 |
4 |
tower
installation |
$16,000 |
4 |
tower
installation |
$20,750 |
|
5 |
Freight |
$5,000 |
5 |
freight |
$3,500 |
5 |
freight |
$3,500 |
|
6 |
Grounding |
incl. |
6 |
grounding |
incl. |
6 |
grounding |
incl. |
|
7 |
lightning
protection |
incl. |
7 |
lightning
protection |
incl. |
7 |
lightning
protection |
incl. |
|
8 |
tower
painting |
incl. |
8 |
tower
painting |
incl. |
8 |
tower
painting |
incl. |
|
9 |
site
development |
$100,000 |
9 |
site
development |
$65,000 |
9 |
site
development |
$65,000 |
|
10 |
site
fencing |
incl. |
10 |
site
fencing |
incl. |
10 |
site
fencing |
incl. |
|
11 |
access
road |
incl. |
11 |
access
road |
incl. |
11 |
access
road |
incl. |
|
12 |
equipment
shelter |
$20,000 |
12 |
equipment
shelter |
$20,000 |
12 |
equipment
shelter |
$20,000 |
|
13 |
Generator
(user provided) |
- |
13 |
generator
(user provided) |
- |
13 |
generator
(user provided) |
- |
|
14 |
Total |
$232,000 |
14 |
total |
$174,800 |
14 |
total |
$157,750 |
|
Estimated Tower Operating Expenses |
||||||||
|
80 Meter Guyed Tower |
30 Meter Self-Support Tower |
30 Meter Self-Support Tower |
||||||
|
|
|
Annual |
|
|
Annual |
|
|
Annual |
|
|
|
Amount |
|
|
Amount |
|
|
Amount |
|
Item |
Description |
(C$) |
Item |
Description |
(C$) |
Item |
Description |
(C$) |
|
1 |
property
rental |
$5,000 |
1 |
property
rental |
$5,000 |
1 |
property
rental |
$5,000 |
|
2 |
commercial
power (note 1) |
$500 |
2 |
commercial
power (note 1) |
$100 |
2 |
commercial
power (note 1) |
$100 |
|
3 |
tower
maintenance |
$1,000 |
3 |
tower
maintenance |
$250 |
3 |
tower
maintenance |
$500 |
|
4 |
site
maintenance |
$1,200 |
4 |
site
maintenance |
$600 |
4 |
site
maintenance |
$600 |
|
5 |
shelter
maintenance |
$500 |
5 |
shelter
maintenance |
$500 |
5 |
shelter
maintenance |
$500 |
|
6 |
generator
(note 2) |
$0 |
6 |
generator
(note 2) |
$0 |
6 |
generator
(note 2) |
$0 |
|
7 |
Total |
$8,200 |
7 |
total |
$6,450 |
7 |
total |
$6,700 |
|
|
|
|
|
|
|
|
|
|
|
Notes: |
|
|
|
|
|
|
|
|
|
1 |
Tenants
will have their own electrical power meter and pay for their electrical
consumption; |
|
|
|||||
|
|
amount
shown is for tower and site lighting. |
|
|
|
|
|
||
|
2 |
Tenants will
arrange for their own generator, if needed to top up batteries. |
|
|
|
|
|||
|
Estimated Tower Revenue |
|||||||||||||
|
|
|
Scenario 1 |
Scenario 2 |
Scenario 3 |
|||||||||
|
|
|
Qty |
Qty |
Annual |
Annual |
Qty |
Qty |
Annual |
Annual |
Qty |
Qty |
Annual |
Annual |
|
|
|
of |
of |
Rate |
Amount |
of |
of |
Rate |
Amount |
of |
of |
Rate |
Amount |
|
Item |
Description |
Tenant |
Antenna |
(C$) |
(C$) |
Tenant |
Antenna |
(C$) |
(C$) |
Tenant |
Antenna |
(C$) |
(C$) |
|
1 |
Tower
Space |
|
|
|
|
|
|
|
|
|
|
|
|
|
1.1 |
Mobile
Radio Antennas |
1 |
1 |
$2,400 |
$2,400 |
1 |
1 |
$2,400 |
$2,400 |
0 |
0 |
$2,400 |
$0 |
|
1.2 |
Wireless
ISP Antennas |
1 |
3 |
$900 |
$2,700 |
1 |
1 |
$900 |
$900 |
1 |
1 |
$900 |
$900 |
|
1.3 |
Cellular/PCS
Antennas |
2 |
6 |
$1,500 |
$18,000 |
1 |
6 |
$1,500 |
$9,000 |
1 |
6 |
$1,500 |
$9,000 |
|
1.4 |
Backhaul
Antennas |
4 |
1 |
$2,400 |
$9,600 |
3 |
1 |
$2,400 |
$7,200 |
2 |
1 |
$2,400 |
$4,800 |
|
|
|
|
|
|
|
|
|
|
|
|
|
|
|
|
2 |
Site Space |
|
|
|
|
|
|
|
|
|
|
|
|
|
2.1 |
Space for
Customer Rack |
4 |
|
$1,000 |
$4,000 |
3 |
|
$1,000 |
$3,000 |
2 |
|
$1,000 |
$2,000 |
|
2.2 |
Space for
Customer Building |
0 |
|
$4,000 |
$0 |
0 |
|
$4,000 |
$0 |
0 |
|
$4,000 |
$0 |
|
|
|
|
|
|
|
|
|
|
|
|
|
|
|
|
3 |
Total |
|
|
|
$36,700 |
|
|
|
$22,500 |
|
|
|
$16,700 |
|
|
|
|
|
|
|
|
|
|
|
|
|
|
|
|
Assumptions: |
|
|
|
|
|
|
|
|
|
|
|
|
|
|
|
|
|
|
|
|
|
|
|
|
|
|
|
|
|
1 |
Site
operator will provide building for customer racks; cages will be provided for
each customer. |
|
|
|
|
||||||||
|
2 |
Each
tenant will have one equipment rack. |
|
|
|
|
|
|
||||||
|
3 |
Tenants
obtain electrical power meter and pay for their electrical power consumption. |
|
|
|
|
|
|
||||||
|
4 |
Tenants
provide own rectifier and battery. |
|
|
|
|
|
|
|
|
|
|
||
|
5 |
Tenants
provide own generator, if needed. |
|
|
|
|
|
|
|
|
|
|
||
|
6 |
Each
tenant will have one backhaul antenna. |
|
|
|
|
|
|
|
|
|
|
||
|
80
Meter Guyed Tower |
|||||||||||||||||||
|
|
|
|
|
|
|
|
|
|
|
|
|
|
|
|
|
|
|
|
|
|
Item |
|
|
Year |
2006 |
2007 |
2008 |
2009 |
2010 |
2011 |
2012 |
2013 |
2014 |
2015 |
2016 |
2017 |
2018 |
2019 |
2020 |
2021 |
|
|
|
|
|
0 |
1 |
2 |
3 |
4 |
5 |
6 |
7 |
8 |
9 |
10 |
11 |
12 |
13 |
14 |
15 |
|
|
|
|
|
|
|
|
|
|
|
|
|
|
|
|
|
|
|
|
|
|
a) |
Capital Cost |
|
|
$232,000 |
$0 |
$0 |
$0 |
$0 |
$0 |
$0 |
$0 |
$0 |
$0 |
$0 |
$0 |
$0 |
$0 |
$0 |
$0 |
|
|
|
|
|
|
|
|
|
|
|
|
|
|
|
|
|
|
|
|
|
|
b) |
Operating Cost |
|
|
$0 |
$8,200 |
$8,364 |
$8,531 |
$8,702 |
$8,876 |
$9,053 |
$9,235 |
$9,419 |
$9,608 |
$9,800 |
$9,996 |
$10,196 |
$10,400 |
$10,608 |
$10,820 |
|
|
|
|
|
|
|
|
|
|
|
|
|
|
|
|
|
|
|
|
|
|
c) |
Revenue |
|
|
$0 |
$36,700 |
$36,700 |
$36,700 |
$36,700 |
$36,700 |
$40,520 |
$40,520 |
$40,520 |
$40,520 |
$40,520 |
$44,737 |
$44,737 |
$44,737 |
$44,737 |
$44,737 |
|
|
|
|
|
|
|
|
|
|
|
|
|
|
|
|
|
|
|
|
|
|
d) |
Net Revenue |
|
|
$0 |
$28,500 |
$28,336 |
$28,169 |
$27,998 |
$27,824 |
$31,466 |
$31,285 |
$31,101 |
$30,912 |
$30,720 |
$34,741 |
$34,541 |
$34,338 |
$34,130 |
$33,917 |
|
|
|
|
|
|
|
|
|
|
|
|
|
|
|
|
|
|
|
|
|
|
e) |
Cumulative Net Revenue |
|
|
$0 |
$28,500 |
$56,836 |
$85,005 |
$113,003 |
$140,827 |
$172,293 |
$203,578 |
$234,679 |
$265,591 |
$296,311 |
$331,052 |
$365,594 |
$399,931 |
$434,061 |
$467,978 |
|
|
|
|
|
|
|
|
|
|
|
|
|
|
|
|
|
|
|
|
|
|
f) |
Cash Flow |
|
|
-$232,000 |
$28,500 |
$28,336 |
$28,169 |
$27,998 |
$27,824 |
$31,466 |
$31,285 |
$31,101 |
$30,912 |
$30,720 |
$34,741 |
$34,541 |
$34,338 |
$34,130 |
$33,917 |
|
|
|
|
|
|
|
|
|
|
|
|
|
|
|
|
|
|
|
|
|
|
h) |
Financial Performance |
10 yrs |
15 yrs |
|
|
|
|
|
|
|
|
|
|
|
|
|
|
|
|
|
|
NPV |
-$14,455 |
$61,785 |
|
|
|
|
|
|
|
|
|
|
|
|
|
|
|
|
|
|
IRR |
5% |
10% |
|
|
|
|
|
|
|
|
|
|
|
|
|
|
|
|
|
|
Capital Recovery Period |
7 |
+ years |
|
|
|
|
|
|
|
|
|
|
|
|
|
|
|
|
|
|
|
|
|
|
|
|
|
|
|
|
|
|
|
|
|
|
|
|
|
|
30
Meter Monopole Tower |
|||||||||||||||||||
|
|
|
|
|
|
|
|
|
|
|
|
|
|
|
|
|
|
|
|
|
|
Item |
|
|
Year |
2006 |
2007 |
2008 |
2009 |
2010 |
2011 |
2012 |
2013 |
2014 |
2015 |
2016 |
2017 |
2018 |
2019 |
2020 |
2021 |
|
|
|
|
|
0 |
1 |
2 |
3 |
4 |
5 |
6 |
7 |
8 |
9 |
10 |
11 |
12 |
13 |
14 |
15 |
|
|
|
|
|
|
|
|
|
|
|
|
|
|
|
|
|
|
|
|
|
|
a) |
Capital Cost |
|
|
$174,800 |
$0 |
$0 |
$0 |
$0 |
$0 |
$0 |
$0 |
$0 |
$0 |
$0 |
$0 |
$0 |
$0 |
$0 |
$0 |
|
|
|
|
|
|
|
|
|
|
|
|
|
|
|
|
|
|
|
|
|
|
b) |
Operating Cost |
|
|
$0 |
$6,450 |
$6,579 |
$6,711 |
$6,845 |
$6,982 |
$7,121 |
$7,264 |
$7,409 |
$7,557 |
$7,708 |
$7,863 |
$8,020 |
$8,180 |
$8,344 |
$8,511 |
|
|
|
|
|
|
|
|
|
|
|
|
|
|
|
|
|
|
|
|
|
|
c) |
Revenue |
|
|
$0 |
$36,700 |
$36,700 |
$36,700 |
$36,700 |
$36,700 |
$40,520 |
$40,520 |
$40,520 |
$40,520 |
$40,520 |
$44,737 |
$44,737 |
$44,737 |
$44,737 |
$44,737 |
|
|
|
|
|
|
|
|
|
|
|
|
|
|
|
|
|
|
|
|
|
|
d) |
Net Revenue |
|
|
$0 |
$30,250 |
$30,121 |
$29,989 |
$29,855 |
$29,718 |
$33,398 |
$33,256 |
$33,111 |
$32,963 |
$32,811 |
$36,875 |
$36,717 |
$36,557 |
$36,393 |
$36,226 |
|
|
|
|
|
|
|
|
|
|
|
|
|
|
|
|
|
|
|
|
|
|
e) |
Cumulative Net Revenue |
|
|
$0 |
$30,250 |
$60,371 |
$90,360 |
$120,216 |
$149,934 |
$183,332 |
$216,588 |
$249,699 |
$282,662 |
$315,473 |
$352,348 |
$389,065 |
$425,622 |
$462,015 |
$498,242 |
|
|
|
|
|
|
|
|
|
|
|
|
|
|
|
|
|
|
|
|
|
|
f) |
Cash Flow |
|
|
-$174,800 |
$30,250 |
$30,121 |
$29,989 |
$29,855 |
$29,718 |
$33,398 |
$33,256 |
$33,111 |
$32,963 |
$32,811 |
$36,875 |
$36,717 |
$36,557 |
$36,393 |
$36,226 |
|
|
|
|
|
|
|
|
|
|
|
|
|
|
|
|
|
|
|
|
|
|
g) |
Financial Performance |
10 yrs |
15 yrs |
|
|
|
|
|
|
|
|
|
|
|
|
|
|
|
|
|
|
NPV |
$52,687 |
$133,842 |
|
|
|
|
|
|
|
|
|
|
|
|
|
|
|
|
|
|
IRR |
12% |
16% |
|
|
|
|
|
|
|
|
|
|
|
|
|
|
|
|
|
|
Capital Recovery Period |
5 |
+ years |
|
|
|
|
|
|
|
|
|
|
|
|
|
|
|
|
|
|
|
|
|
|
|
|
|
|
|
|
|
|
|
|
|
|
|
|
|
|
30
Meter Self-Support Tower |
|||||||||||||||||||
|
|
|
|
|
|
|
|
|
|
|
|
|
|
|
|
|
|
|
|
|
|
Item |
|
|
Year |
2006 |
2007 |
2008 |
2009 |
2010 |
2011 |
2012 |
2013 |
2014 |
2015 |
2016 |
2017 |
2018 |
2019 |
2020 |
2021 |
|
|
|
|
|
0 |
1 |
2 |
3 |
4 |
5 |
6 |
7 |
8 |
9 |
10 |
11 |
12 |
13 |
14 |
15 |
|
|
|
|
|
|
|
|
|
|
|
|
|
|
|
|
|
|
|
|
|
|
a) |
Capital Cost |
|
|
$157,750 |
$0 |
$0 |
$0 |
$0 |
$0 |
$0 |
$0 |
$0 |
$0 |
$0 |
$0 |
$0 |
$0 |
$0 |
$0 |
|
|
|
|
|
|
|
|
|
|
|
|
|
|
|
|
|
|
|
|
|
|
b) |
Operating Cost |
|
|
$0 |
$6,700 |
$6,834 |
$6,971 |
$7,110 |
$7,252 |
$7,397 |
$7,545 |
$7,696 |
$7,850 |
$8,007 |
$8,167 |
$8,331 |
$8,497 |
$8,667 |
$8,841 |
|
|
|
|
|
|
|
|
|
|
|
|
|
|
|
|
|
|
|
|
|
|
c) |
Revenue |
|
|
$0 |
$36,700 |
$36,700 |
$36,700 |
$36,700 |
$36,700 |
$40,520 |
$40,520 |
$40,520 |
$40,520 |
$40,520 |
$44,737 |
$44,737 |
$44,737 |
$44,737 |
$44,737 |
|
|
|
|
|
|
|
|
|
|
|
|
|
|
|
|
|
|
|
|
|
|
d) |
Net Revenue |
|
|
$0 |
$30,000 |
$29,866 |
$29,729 |
$29,590 |
$29,448 |
$33,122 |
$32,974 |
$32,824 |
$32,670 |
$32,513 |
$36,570 |
$36,406 |
$36,240 |
$36,070 |
$35,897 |
|
|
|
|
|
|
|
|
|
|
|
|
|
|
|
|
|
|
|
|
|
|
e) |
Cumulative Net Revenue |
|
|
$0 |
$30,000 |
$59,866 |
$89,595 |
$119,185 |
$148,633 |
$181,755 |
$214,730 |
$247,553 |
$280,223 |
$312,736 |
$349,306 |
$385,712 |
$421,952 |
$458,022 |
$493,918 |
|
|
|
|
|
|
|
|
|
|
|
|
|
|
|
|
|
|
|
|
|
|
f) |
Cash Flow |
|
|
-$157,750 |
$30,000 |
$29,866 |
$29,729 |
$29,590 |
$29,448 |
$33,122 |
$32,974 |
$32,824 |
$32,670 |
$32,513 |
$36,570 |
$36,406 |
$36,240 |
$36,070 |
$35,897 |
|
|
|
|
|
|
|
|
|
|
|
|
|
|
|
|
|
|
|
|
|
|
g) |
Financial Performance |
10 yrs |
15 yrs |
|
|
|
|
|
|
|
|
|
|
|
|
|
|
|
|
|
|
NPV |
$66,889 |
$147,342 |
|
|
|
|
|
|
|
|
|
|
|
|
|
|
|
|
|
|
IRR |
14% |
18% |
|
|
|
|
|
|
|
|
|
|
|
|
|
|
|
|
|
|
Capital Recovery Period |
5 |
+ years |
|
|
|
|
|
|
|
|
|
|
|
|
|
|
|
|
|
Scenario
2: Three Tenants |
|||||||||||||||||||
|
80
Meter Guyed Tower |
|||||||||||||||||||
|
|
|
|
|
|
|
|
|
|
|
|
|
|
|
|
|
|
|
|
|
|
Item |
|
Year |
2006 |
2007 |
2008 |
2009 |
2010 |
2011 |
2012 |
2013 |
2014 |
2015 |
2016 |
2017 |
2018 |
2019 |
2020 |
2021 |
|
|
|
|
|
|
0 |
1 |
2 |
3 |
4 |
5 |
6 |
7 |
8 |
9 |
10 |
11 |
12 |
13 |
14 |
15 |
|
|
|
|
|
|
|
|
|
|
|
|
|
|
|
|
|
|
|
|
|
|
a) |
Capital Cost |
|
|
$232,000 |
$0 |
$0 |
$0 |
$0 |
$0 |
$0 |
$0 |
$0 |
$0 |
$0 |
$0 |
$0 |
$0 |
$0 |
$0 |
|
|
|
|
|
|
|
|
|
|
|
|
|
|
|
|
|
|
|
|
|
|
b) |
Operating Cost |
|
|
$0 |
$8,200 |
$8,364 |
$8,531 |
$8,702 |
$8,876 |
$9,053 |
$9,235 |
$9,419 |
$9,608 |
$9,800 |
$9,996 |
$10,196 |
$10,400 |
$10,608 |
$10,820 |
|
|
|
|
|
|
|
|
|
|
|
|
|
|
|
|
|
|
|
|
|
|
c) |
Revenue |
|
|
$0 |
$22,500 |
$22,500 |
$22,500 |
$22,500 |
$22,500 |
$24,842 |
$24,842 |
$24,842 |
$24,842 |
$24,842 |
$27,427 |
$27,427 |
$27,427 |
$27,427 |
$27,427 |
|
|
|
|
|
|
|
|
|
|
|
|
|
|
|
|
|
|
|
|
|
|
d) |
Net Revenue |
|
|
$0 |
$14,300 |
$14,136 |
$13,969 |
$13,798 |
$13,624 |
$15,788 |
$15,607 |
$15,423 |
$15,234 |
$15,042 |
$17,432 |
$17,232 |
$17,028 |
$16,820 |
$16,608 |
|
|
|
|
|
|
|
|
|
|
|
|
|
|
|
|
|
|
|
|
|
|
e) |
Cumulative Net Revenue |
|
|
$0 |
$14,300 |
$28,436 |
$42,405 |
$56,203 |
$69,827 |
$85,615 |
$101,223 |
$116,645 |
$131,879 |
$146,921 |
$164,353 |
$181,585 |
$198,612 |
$215,432 |
$232,040 |
|
|
|
|
|
|
|
|
|
|
|
|
|
|
|
|
|
|
|
|
|
|
f) |
Cash Flow |
|
|
-$232,000 |
$14,300 |
$14,136 |
$13,969 |
$13,798 |
$13,624 |
$15,788 |
$15,607 |
$15,423 |
$15,234 |
$15,042 |
$17,432 |
$17,232 |
$17,028 |
$16,820 |
$16,608 |
|
|
|
|
|
|
|
|
|
|
|
|
|
|
|
|
|
|
|
|
|
|
h) |
Financial Performance |
10 years |
15 years |
|
|
|
|
|
|
|
|
|
|
|
|
|
|
|
|
|
|
NPV |
-$117,441 |
-$79,612 |
|
|
|
|
|
|
|
|
|
|
|
|
|
|
|
|
|
|
IRR |
-7% |
0% |
|
|
|
|
|
|
|
|
|
|
|
|
|
|
|
|
|
|
Capital Recovery Period |
14 |
+ years |
|
|
|
|
|
|
|
|
|
|
|
|
|
|
|
|
|
|
|
|
|
|
|
|
|
|
|
|
|
|
|
|
|
|
|
|
|
|
30
Meter Monopole Tower |
|||||||||||||||||||
|
|
|
|
|
|
|
|
|
|
|
|
|
|
|
|
|
|
|
|
|
|
Item |
|
|
Year |
2006 |
2007 |
2008 |
2009 |
2010 |
2011 |
2012 |
2013 |
2014 |
2015 |
2016 |
2017 |
2018 |
2019 |
2020 |
2021 |
|
|
|
|
|
0 |
1 |
2 |
3 |
4 |
5 |
6 |
7 |
8 |
9 |
10 |
11 |
12 |
13 |
14 |
15 |
|
|
|
|
|
|
|
|
|
|
|
|
|
|
|
|
|
|
|
|
|
|
a) |
Capital Cost |
|
|
$174,800 |
$0 |
$0 |
$0 |
$0 |
$0 |
$0 |
$0 |
$0 |
$0 |
$0 |
$0 |
$0 |
$0 |
$0 |
$0 |
|
|
|
|
|
|
|
|
|
|
|
|
|
|
|
|
|
|
|
|
|
|
b) |
Operating Cost |
|
|
$0 |
$6,450 |
$6,579 |
$6,711 |
$6,845 |
$6,982 |
$7,121 |
$7,264 |
$7,409 |
$7,557 |
$7,708 |
$7,863 |
$8,020 |
$8,180 |
$8,344 |
$8,511 |
|
|
|
|
|
|
|
|
|
|
|
|
|
|
|
|
|
|
|
|
|
|
c) |
Revenue |
|
|
$0 |
$22,500 |
$22,500 |
$22,500 |
$22,500 |
$22,500 |
$24,842 |
$24,842 |
$24,842 |
$24,842 |
$24,842 |
$27,427 |
$27,427 |
$27,427 |
$27,427 |
$27,427 |
|
|
|
|
|
|
|
|
|
|
|
|
|
|
|
|
|
|
|
|
|
|
d) |
Net Revenue |
|
|
$0 |
$16,050 |
$15,921 |
$15,789 |
$15,655 |
$15,518 |
$17,720 |
$17,578 |
$17,433 |
$17,285 |
$17,133 |
$19,565 |
$19,408 |
$19,247 |
$19,084 |
$18,917 |
|
|
|
|
|
|
|
|
|
|
|
|
|
|
|
|
|
|
|
|
|
|
e) |
Cumulative Net Revenue |
|
|
$0 |
$16,050 |
$31,971 |
$47,760 |
$63,416 |
$78,934 |
$96,654 |
$114,233 |
$131,665 |
$148,950 |
$166,083 |
$185,648 |
$205,056 |
$224,303 |
$243,387 |
$262,303 |
|
|
|
|
|
|
|
|
|
|
|
|
|
|
|
|
|
|
|
|
|
|
f) |
Cash Flow |
|
|
-$174,800 |
$16,050 |
$15,921 |
$15,789 |
$15,655 |
$15,518 |
$17,720 |
$17,578 |
$17,433 |
$17,285 |
$17,133 |
$19,565 |
$19,408 |
$19,247 |
$19,084 |
$18,917 |
|
|
|
|
|
|
|
|
|
|
|
|
|
|
|
|
|
|
|
|
|
|
g) |
Financial Performance |
10 years |
15 years |
|
|
|
|
|
|
|
|
|
|
|
|
|
|
|
|
|
|
NPV |
-$50,299 |
-$7,554 |
|
|
|
|
|
|
|
|
|
|
|
|
|
|
|
|
|
|
IRR |
-1% |
5% |
|
|
|
|
|
|
|
|
|
|
|
|
|
|
|
|
|
|
Capital Recovery Period |
10 |
+ years |
|
|
|
|
|
|
|
|
|
|
|
|
|
|
|
|
|
|
|
|
|
|
|
|
|
|
|
|
|
|
|
|
|
|
|
|
|
|
30
Meter Self-Support Tower |
|||||||||||||||||||
|
|
|
|
|
|
|
|
|
|
|
|
|
|
|
|
|
|
|
|
|
|
Item |
|
|
Year |
2006 |
2007 |
2008 |
2009 |
2010 |
2011 |
2012 |
2013 |
2014 |
2015 |
2016 |
2017 |
2018 |
2019 |
2020 |
2021 |
|
|
|
|
|
0 |
1 |
2 |
3 |
4 |
5 |
6 |
7 |
8 |
9 |
10 |
11 |
12 |
13 |
14 |
15 |
|
|
|
|
|
|
|
|
|
|
|
|
|
|
|
|
|
|
|
|
|
|
a) |
Capital Cost |
|
|
$157,750 |
$0 |
$0 |
$0 |
$0 |
$0 |
$0 |
$0 |
$0 |
$0 |
$0 |
$0 |
$0 |
$0 |
$0 |
$0 |
|
|
|
|
|
|
|
|
|
|
|
|
|
|
|
|
|
|
|
|
|
|
b) |
Operating Cost |
|
|
$0 |
$6,700 |
$6,834 |
$6,971 |
$7,110 |
$7,252 |
$7,397 |
$7,545 |
$7,696 |
$7,850 |
$8,007 |
$8,167 |
$8,331 |
$8,497 |
$8,667 |
$8,841 |
|
|
|
|
|
|
|
|
|
|
|
|
|
|
|
|
|
|
|
|
|
|
c) |
Revenue |
|
|
$0 |
$22,500 |
$22,500 |
$22,500 |
$22,500 |
$22,500 |
$24,842 |
$24,842 |
$24,842 |
$24,842 |
$24,842 |
$27,427 |
$27,427 |
$27,427 |
$27,427 |
$27,427 |
|
|
|
|
|
|
|
|
|
|
|
|
|
|
|
|
|
|
|
|
|
|
d) |
Net Revenue |
|
|
$0 |
$15,800 |
$15,666 |
$15,529 |
$15,390 |
$15,248 |
$17,444 |
$17,297 |
$17,146 |
$16,992 |
$16,835 |
$19,260 |
$19,097 |
$18,930 |
$18,760 |
$18,587 |
|
|
|
|
|
|
|
|
|
|
|
|
|
|
|
|
|
|
|
|
|
|
e) |
Cumulative Net Revenue |
|
|
$0 |
$15,800 |
$31,466 |
$46,995 |
$62,385 |
$77,633 |
$95,077 |
$112,374 |
$129,520 |
$146,511 |
$163,346 |
$182,606 |
$201,703 |
$220,633 |
$239,393 |
$257,980 |
|
|
|
|
|
|
|
|
|
|
|
|
|
|
|
|
|
|
|
|
|
|
f) |
Cash Flow |
|
|
-$157,750 |
$15,800 |
$15,666 |
$15,529 |
$15,390 |
$15,248 |
$17,444 |
$17,297 |
$17,146 |
$16,992 |
$16,835 |
$19,260 |
$19,097 |
$18,930 |
$18,760 |
$18,587 |
|
|
|
|
|
|
|
|
|
|
|
|
|
|
|
|
|
|
|
|
|
|
g) |
Financial Performance |
10 years |
15 years |
|
|
|
|
|
|
|
|
|
|
|
|
|
|
|
|
|
|
NPV |
-$36,097 |
$5,946 |
|
|
|
|
|
|
|
|
|
|
|
|
|
|
|
|
|
|
IRR |
1% |
7% |
|
|
|
|
|
|
|
|
|
|
|
|
|
|
|
|
|
|
Capital Recovery Period |
9 |
+ years |
|
|
|
|
|
|
|
|
|
|
|
|
|
|
|
|
|
Scenario
3: Two Tenants |
|||||||||||||||||||
|
80
Meter Guyed Tower |
|||||||||||||||||||
|
|
|
|
|
|
|
|
|
|
|
|
|
|
|
|
|
|
|
|
|
|
Item |
|
Year |
2006 |
2007 |
2008 |
2009 |
2010 |
2011 |
2012 |
2013 |
2014 |
2015 |
2016 |
2017 |
2018 |
2019 |
2020 |
2021 |
|
|
|
|
|
|
0 |
1 |
2 |
3 |
4 |
5 |
6 |
7 |
8 |
9 |
10 |
11 |
12 |
13 |
14 |
15 |
|
|
|
|
|
|
|
|
|
|
|
|
|
|
|
|
|
|
|
|
|
|
a) |
Capital Cost |
|
|
$232,000 |
$0 |
$0 |
$0 |
$0 |
$0 |
$0 |
$0 |
$0 |
$0 |
$0 |
$0 |
$0 |
$0 |
$0 |
$0 |
|
|
|
|
|
|
|
|
|
|
|
|
|
|
|
|
|
|
|
|
|
|
b) |
Operating Cost |
|
|
$0 |
$8,200 |
$8,364 |
$8,531 |
$8,702 |
$8,876 |
$9,053 |
$9,235 |
$9,419 |
$9,608 |
$9,800 |
$9,996 |
$10,196 |
$10,400 |
$10,608 |
$10,820 |
|
|
|
|
|
|
|
|
|
|
|
|
|
|
|
|
|
|
|
|
|
|
c) |
Revenue |
|
|
$0 |
$16,700 |
$16,700 |
$16,700 |
$16,700 |
$16,700 |
$18,438 |
$18,438 |
$18,438 |
$18,438 |
$18,438 |
$20,357 |
$20,357 |
$20,357 |
$20,357 |
$20,357 |
|
|
|
|
|
|
|
|
|
|
|
|
|
|
|
|
|
|
|
|
|
|
d) |
Net Revenue |
|
|
$0 |
$8,500 |
$8,336 |
$8,169 |
$7,998 |
$7,824 |
$9,385 |
$9,204 |
$9,019 |
$8,831 |
$8,638 |
$10,361 |
$10,162 |
$9,958 |
$9,750 |
$9,537 |
|
|
|
|
|
|
|
|
|
|
|
|
|
|
|
|
|
|
|
|
|
|
e) |
Cumulative Net Revenue |
|
|
$0 |
$8,500 |
$16,836 |
$25,005 |
$33,003 |
$40,827 |
$50,212 |
$59,415 |
$68,434 |
$77,265 |
$85,903 |
$96,264 |
$106,426 |
$116,384 |
$126,133 |
$135,671 |
|
|
|
|
|
|
|
|
|
|
|
|
|
|
|
|
|
|
|
|
|
|
f) |
Cash Flow |
|
|
-$232,000 |
$8,500 |
$8,336 |
$8,169 |
$7,998 |
$7,824 |
$9,385 |
$9,204 |
$9,019 |
$8,831 |
$8,638 |
$10,361 |
$10,162 |
$9,958 |
$9,750 |
$9,537 |
|
|
|
|
|
|
|
|
|
|
|
|
|
|
|
|
|
|
|
|
|
|
h) |
Financial Performance |
10 years |
15 years |
|
|
|
|
|
|
|
|
|
|
|
|
|
|
|
|
|
|
NPV |
-$159,506 |
-$137,365 |
|
|
|
|
|
|
|
|
|
|
|
|
|
|
|
|
|
|
IRR |
-15% |
-6% |
|
|
|
|
|
|
|
|
|
|
|
|
|
|
|
|
|
|
Capital Recovery Period |
15 |
+ years |
|
|
|
|
|
|
|
|
|
|
|
|
|
|
|
|
|
|
|
|
|
|
|
|
|
|
|
|
|
|
|
|
|
|
|
|
|
|
30
Meter Monopole Tower |
|||||||||||||||||||
|
|
|
|
|
|
|
|
|
|
|
|
|
|
|
|
|
|
|
|
|
|
Item |
|
|
Year |
2006 |
2007 |
2008 |
2009 |
2010 |
2011 |
2012 |
2013 |
2014 |
2015 |
2016 |
2017 |
2018 |
2019 |
2020 |
2021 |
|
|
|
|
|
0 |
1 |
2 |
3 |
4 |
5 |
6 |
7 |
8 |
9 |
10 |
11 |
12 |
13 |
14 |
15 |
|
|
|
|
|
|
|
|
|
|
|
|
|
|
|
|
|
|
|
|
|
|
a) |
Capital Cost |
|
|
$174,800 |
$0 |
$0 |
$0 |
$0 |
$0 |
$0 |
$0 |
$0 |
$0 |
$0 |
$0 |
$0 |
$0 |
$0 |
$0 |
|
|
|
|
|
|
|
|
|
|
|
|
|
|
|
|
|
|
|
|
|
|
b) |
Operating Cost |
|
|
$0 |
$6,450 |
$6,579 |
$6,711 |
$6,845 |
$6,982 |
$7,121 |
$7,264 |
$7,409 |
$7,557 |
$7,708 |
$7,863 |
$8,020 |
$8,180 |
$8,344 |
$8,511 |
|
|
|
|
|
|
|
|
|
|
|
|
|
|
|
|
|
|
|
|
|
|
c) |
Revenue |
|
|
$0 |
$16,700 |
$16,700 |
$16,700 |
$16,700 |
$16,700 |
$18,438 |
$18,438 |
$18,438 |
$18,438 |
$18,438 |
$20,357 |
$20,357 |
$20,357 |
$20,357 |
$20,357 |
|
|
|
|
|
|
|
|
|
|
|
|
|
|
|
|
|
|
|
|
|
|
d) |
Net Revenue |
|
|
$0 |
$10,250 |
$10,121 |
$9,989 |
$9,855 |
$9,718 |
$11,317 |
$11,174 |
$11,029 |
$10,881 |
$10,730 |
$12,495 |
$12,337 |
$12,177 |
$12,013 |
$11,847 |
|
|
|
|
|
|
|
|
|
|
|
|
|
|
|
|
|
|
|
|
|
|
e) |
Cumulative Net Revenue |
|
|
$0 |
$10,250 |
$20,371 |
$30,360 |
$40,216 |
$49,934 |
$61,251 |
$72,425 |
$83,454 |
$94,335 |
$105,065 |
$117,560 |
$129,897 |
$142,074 |
$154,088 |
$165,934 |
|
|
|
|
|
|
|
|
|
|
|
|
|
|
|
|
|
|
|
|
|
|
f) |
Cash Flow |
|
|
-$174,800 |
$10,250 |
$10,121 |
$9,989 |
$9,855 |
$9,718 |
$11,317 |
$11,174 |
$11,029 |
$10,881 |
$10,730 |
$12,495 |
$12,337 |
$12,177 |
$12,013 |
$11,847 |
|
|
|
|
|
|
|
|
|
|
|
|
|
|
|
|
|
|
|
|
|
|
g) |
Financial Performance |
10 years |
15 years |
|
|
|
|
|
|
|
|
|
|
|
|
|
|
|
|
|
|
NPV |
-$92,364 |
-$65,308 |
|
|
|
|
|
|
|
|
|
|
|
|
|
|
|
|
|
|
IRR |
-8% |
-1% |
|
|
|
|
|
|
|
|
|
|
|
|
|
|
|
|
|
|
Capital Recovery Period |
15 |
+ years |
|
|
|
|
|
|
|
|
|
|
|
|
|
|
|
|
|
|
|
|
|
|
|
|
|
|
|
|
|
|
|
|
|
|
|
|
|
|
30
Meter Self-Support Tower |
|||||||||||||||||||
|
|
|
|
|
|
|
|
|
|
|
|
|
|
|
|
|
|
|
|
|
|
Item |
|
|
Year |
2006 |
2007 |
2008 |
2009 |
2010 |
2011 |
2012 |
2013 |
2014 |
2015 |
2016 |
2017 |
2018 |
2019 |
2020 |
2021 |
|
|
|
|
|
0 |
1 |
2 |
3 |
4 |
5 |
6 |
7 |
8 |
9 |
10 |
11 |
12 |
13 |
14 |
15 |
|
|
|
|
|
|
|
|
|
|
|
|
|
|
|
|
|
|
|
|
|
|
a) |
Capital Cost |
|
|
$157,750 |
$0 |
$0 |
$0 |
$0 |
$0 |
$0 |
$0 |
$0 |
$0 |
$0 |
$0 |
$0 |
$0 |
$0 |
$0 |
|
|
|
|
|
|
|
|
|
|
|
|
|
|
|
|
|
|
|
|
|
|
b) |
Operating Cost |
|
|
$0 |
$6,700 |
$6,834 |
$6,971 |
$7,110 |
$7,252 |
$7,397 |
$7,545 |
$7,696 |
$7,850 |
$8,007 |
$8,167 |
$8,331 |
$8,497 |
$8,667 |
$8,841 |
|
|
|
|
|
|
|
|
|
|
|
|
|
|
|
|
|
|
|
|
|
|
c) |
Revenue |
|
|
$0 |
$16,700 |
$16,700 |
$16,700 |
$16,700 |
$16,700 |
$18,438 |
$18,438 |
$18,438 |
$18,438 |
$18,438 |
$20,357 |
$20,357 |
$20,357 |
$20,357 |
$20,357 |
|
|
|
|
|
|
|
|
|
|
|
|
|
|
|
|
|
|
|
|
|
|
d) |
Net Revenue |
|
|
$0 |
$10,000 |
$9,866 |
$9,729 |
$9,590 |
$9,448 |
$11,041 |
$10,893 |
$10,742 |
$10,588 |
$10,431 |
$12,190 |
$12,027 |
$11,860 |
$11,690 |
$11,517 |
|
|
|
|
|
|
|
|
|
|
|
|
|
|
|
|
|
|
|
|
|
|
e) |
Cumulative Net Revenue |
|
|
$0 |
$10,000 |
$19,866 |
$29,595 |
$39,185 |
$48,633 |
$59,674 |
$70,567 |
$81,309 |
$91,897 |
$102,328 |
$114,518 |
$126,544 |
$138,404 |
$150,094 |
$161,611 |
|
|
|
|
|
|
|
|
|
|
|
|
|
|
|
|
|
|
|
|
|
|
f) |
Cash Flow |
|
|
-$157,750 |
$10,000 |
$9,866 |
$9,729 |
$9,590 |
$9,448 |
$11,041 |
$10,893 |
$10,742 |
$10,588 |
$10,431 |
$12,190 |
$12,027 |
$11,860 |
$11,690 |
$11,517 |
|
|
|
|
|
|
|
|
|
|
|
|
|
|
|
|
|
|
|
|
|
|
g) |
Financial Performance |
10 years |
15 years |
|
|
|
|
|
|
|
|
|
|
|
|
|
|
|
|
|
|
NPV |
-$78,162 |
-$51,808 |
|
|
|
|
|
|
|
|
|
|
|
|
|
|
|
|
|
|
IRR |
-7% |
0% |
|
|
|
|
|
|
|
|
|
|
|
|
|
|
|
|
|
|
Capital Recovery Period |
14 |
+ years |
|
|
|
|
|
|
|
|
|
|
|
|
|
|
|
|
completing broadband coverage in rural ottawa
achèvement du réseau À large bande dans le secteur rural d’ottawa
ACS2006-PGM-ECO-0018
Mr. C. Cope, Communication Technology Consultant, provided a presentation in which he reviewed the City’s broadband strategy, discussed the current status of broadband coverage, and outlined the current proposal to complete broadband coverage in rural Ottawa. A copy of his presentation is held on file.
Responding to a series of questions from Councillor El-Chantiry, Mr. Cope confirmed that with only the tower scheme previously considered, even with the proposed towers, there still would be gaps in service areas. Although the proposal would certainly improve coverage (from the current 60% to approximately 85%), there would remain approximately 15% of the area. He indicated there currently was not a co-location agreement for service providers. He indicated it could be a provision of the RFP, that the successful vendor would have to agree to accept other vendors on its towers so that ultimately, there could be fewer towers. However, he submitted that although the City could put strong language into the RFP in that regard, at the end of the day, the approval for tower sites rested with Industry Canada. He suggested using the report prepared by Morrison Hershfield as a guideline and advised that staff would be including as many of those guidelines as possible into the RFP. He assured Committee that the City did not intend to change the way it deals with current providers, including small providers where the City does everything it can to facilitate their growth.
Chair Jellett requested clarification on the requested funding for this initiative. Mr. Cope confirmed this did not represent a budget pressure. He explained that $300,000 would come from existing rural money allocated and $700,000 would come from an existing road restoration budget.
In response to a further question from Chair Jellett, Mr. Cope indicated he hoped to have the RFP out within a few weeks of Council approving the report with vendors responding approximately 4 weeks hence. Therefore, he hoped to have a vendor identified before the end of the year.
Ms. K. Black posed questions with respect to the RFP process and the current coverage map. In response, Mr. Cope explained the intent of the RFP will be to find a private sector partner to partner with the City to contribute capital funding to provide the infrastructure for broadband coverage to all remaining rural gaps. The RFP will be prepared by City staff, with the assistance of consultants, and will be issued by the City through its procurement department. The City’s procurement process is available for viewing on the City’s website. Mr. Cope indicated he could e-mail the speaker a copy of the most up to date coverage map.
Following this brief discussion, the Committee voted on the report recommendations.
1. That the Agriculture and Rural Affairs Committee and the Corporate Services and Economic Development Committee recommend Council:
2.
3. Approve the proposed public-private partnership framework to complete broadband coverage in rural Ottawa, as outlined in this report;
4.
5. Authorize staff to initiate the procurement process to complete rural broadband coverage;
6.
7. Authorize a funding contribution of up to $1,000,000 for this initiative; and
8.
9. Receive Morrison Hershfield's report entitled "TOWER FORECAST & DEPLOYMENT PLAN" and instruct staff to incorporate the principles contained therein related to communication tower management and avoidance of tower proliferation.
CARRIED
COMPLETING BORADBAND COVERAGE IN RURAL OTTAWA
ACHÈVEMENT DU RÉSEAU À LARGE BANDE
DANS LE SECTEUR RURAL D’OTTAWA WEST
CARLETON (5), gOULBOURN (6),
gLOUCESTER SOUTHGATE (10), cUMBERLAND (19),
acs2006-pgm-eco-0018 osgoode (20), Rideau (21)
Moved by Councillor R. Jellett
That the
Corporate Services and Economic Development Committee approve the addition of
this item for consideration by the Committee at today’s meeting pursuant to
Section 81(3) of the Procedure By-law (being By-law no. 2005-431).
CARRIED
That Corporate Services and Economic
Development Committee recommend that Council:
1. Approve the proposed public-private partnership framework to
complete broadband coverage in rural Ottawa, as outlined in this report;
2. Authorize staff to initiate the procurement process to
complete rural broadband coverage;
3. Authorize a funding contribution of up to $1,000,000 for this initiative;
4. Receive Morrison Hershfield's report
entitled "TOWER FORECAST & DEPLOYMENT PLAN" and instruct staff to
incorporate the principles contained therein related to communication tower
management and avoidance of tower proliferation.
CARRIED
[1] Arryba
advised that wireless coverage varies from 3 to 7 Km; Arryba uses 900 MHz and
5.8 GHz.
[2] Storm
advised that wireless coverage varies from 4 to 8 Km; storm uses 2.4 GHz.
[3] The
fact that Telus did not provide coverage data was not of concern because, it is
believed that, Telus is merely duplicating cellular coverage of Bell and
Rogers, rather than providing new cellular coverage to areas not already served
by Bell and Rogers.
[4] Some
locations could require a tower height as high as 80 meters.
[5] It
is recognized that the website is not current and therefore Figure 3 was used
as the prime determining factor in assessing broadband coverage requirements.
[6] Rogers
Wireless declined to provide rates.
[7] Wireless
Telecom Agreements Survey (WTAS) undertaken by the City.
[8] With
one company, wind loading is also a factor (in addition to antenna size) in
determining the amount charged.
[9] Operating
expenses are assumed to increase 2% per year.
[10] Sub-Option
1 could be further expanded wherein two carriers jointly champion a tower.