1 Introduction
1.1
Background
The City of Ottawa is the proponent of an Environmental Assessment to study the proposed widening and realignment of Greenbank Road from Malvern Drive to Cambrian Road and the extension of the South-west Transitway from Strandherd Drive to Cambrian Road. The transportation analysis undertaken as part of this project reviews the planned growth for the study area in relation to existing and proposed transportation infrastructure and identifies the future demands expected to emerge as a result of the proposed development pattern. The transportation assessment undertaken as part of the project will assist in the determination of the preferred transportation infrastructure to service the needs of the area surrounding the South Nepean Town Centre as well as serving the Barrhaven South Community. Existing and future land use within the Study Area, as well as mobility objectives are driving the need to assess the transportation system within the South Nepean Town Centre, and proposed new expansions and connections in the arterial road network.
1.2
Planning Context
The current transportation strategy for the City of Ottawa has been well documented in the 1997 Regional Official Plan and more recently in the new City of Ottawa’s Official Plan (as adopted by City Council, May 2003). The fundamental transportation strategy to support the future growth of the City is a continued focus on transit. Transit priority measures together with new and expanded rapid transit service are intended to support a substantial increase in the use of public transit and a reduced reliance upon automobile travel particularly during peak travel periods. Plans call for increasing the percentage of all trips made by transit from current levels of approximately 17 percent, city-wide in the peak hour, to 30 percent of all motorized modes by 2021. This objective ensures that transit will continue to play an increasing and substantial role in meeting the growing travel needs of the population.
Despite the focus on increased transit use, there will be a need for ongoing improvements to the road infrastructure network. A supporting document to the Official Plan, the Transportation Master Plan outlines critical transportation policies, facilities and services required to meet its transit use objectives and ensure the travel needs of its residents and business community are accommodated in the context of the development pattern outlined in the Official Plan. In this respect, the plan adopted four key strategic directions as a means to manage future growth;
§ Land use planning; shaping development patterns to support transportation goals.
§ Transportation demand management (TDM); influencing why, where and how people choose to travel.
§ Transportation supply management (TSM); maximizing the efficiency of existing systems and to reduce the need for new infrastructure and services
§ New Infrastructure and services; expanding the system to support development and improve service for all modes.
1.2.1
Official Plan
The City of Ottawa’s Official Plan was completed following an extensive study process referred to as the “Ottawa 2020 Initiative”. Ottawa 2020 followed a two-year planning process to examine options in managing the growth and the changes the City will experience over the next twenty years. Ottawa 2020 provided the Official Plan with the foundation and guiding principles to establish the land use, community design, transportation and infrastructure policies necessary to direct the physical development of the City. The City’s Official Plan is based on population growth of approximately 50% by 2021, about 400,000 new residents over 2003 levels of 800,000, and an employment growth of more than 270,000 jobs over the same planning horizon which reflects an approximate 55% increase over 2003 employment levels of 480,000 jobs.
The Official Plan sets forth a strategy to direct growth to locations that will accommodate a mix of land uses and a compact form of development. This form of development will support a high-quality transit service thereby increasing overall transit use and make better use of existing roads and other infrastructure rather than expanding the existing road infrastructure and/or building new roadway facilities.
A number of policies contained in the City’s Official Plan focus on a transportation system that emphasizes transit, walking and cycling. The policies that support transit development and have a direct impact on this environmental assessment are briefly outlined below:
§
The City will
protect corridors for future development of rapid transit service to serve the
growth needs for travel. Schedule “D”
of the Official Plan protects for the extension of the SW Transitway 2.3.1 - Policy 18
§ The City’s policy for the introduction of rapid transit service is to “introduce rapid-transit service at an early stage in the development of new urban communities. As these communities mature, they will ultimately be served by the extension of full rapid-transit facilities”. Section 2.3.1 – Policy 19. Currently, development is proceeding in Nepean South and in particular south of the Jock River. Opportunities exist to influence travel behaviour through the introduction of high quality transit service and encourage and promote alternative modes of transportation and reduce the dependency of residents on private automobile use.
§
The City will
develop the road network shown on Schedules E to H to provide for the safe and
convenient movement of people and goods. Section 2.3.1 - Policy 29
§
Priority use of
lanes on a road or planned new lanes may be given exclusively to certain
classes of roadway users if it contributes to the implementation of
transportation and land-use objectives of this plan. This may result in roadway
lanes reserved for transit vehicles in identified locations supportive of
rapid-transit and transit priority network.
1.2.2
Transportation Master Plan
The City of Ottawa’s Transportation Master Plan (TMP) was completed in September 2003 and was prepared as a supporting document to the Official Plan. The TMP recognizes the growth management goals outlined in the Official Plan and strives to minimize the future need for new and widened roads while avoiding levels of congestion that would result in unacceptable implications for Ottawa’s quality of life and economy in terms of delay to persons and goods, air pollution and road safety. A key cornerstone of the TMP is its adoption of a Transportation Vision - “ In 2021, Ottawa’s Transportation system will enhance our quality of life, respect the natural environment, enhance the economy, and be managed in a responsible and responsive manner.”
The Transportation Master Plan also outlines four strategic directions that are essential to achieving this vision:
§
Focusing on
Transit
§
Influencing
travel demand for travel
§
Making efficient
use of resources
§
Forging a
community partnership
The Transportation Master Plan’s focus on transit is highlighted by its commitment to almost double the mode split for transit (the proportion of all motorized trips served by transit during peak traffic conditions) from its current level of approximately 17 percent to 30 percent by the end of the planning horizon of 2021. The City also plans to maximize the efficiency and people-moving capacity of the existing systems to reduce the need for new infrastructure and achieve the modal shift objectives while minimizing the costs associated with increased road congestion and preserving public health. The Plan also supports the addition of infrastructure and services that are required to encourage desired modal shifts, prevent unacceptable roadway congestion and delay and minimize neighbourhood traffic infiltration and air pollution. Continued support is expressed for more transit-oriented communities and expanded public transit services and facilities making the system more accessible to residents.
The transportation strategy to service future growth and development patterns is outlined in the Transportation Master Plan through its commitment to action on key initiatives and issues. Key among these are:
§
“the City will
add infrastructure and services to provide the substantial increase in transit
capacity that will be required due to population growth and transit modal split
increases”[1]
§
“the City will
add infrastructure and services to meet quality of service objectives for all
users of City roads…”1
§
“the City will
give priority to the enhancement of transit service when setting priorities for
all infrastructure projects, and particularly for those that serve developing
communities”[2]
§
“the City will
expand the transit route network to serve increasing numbers of passengers as
the City grows and as the transit modal split increases ”[3]
§
“the City will
implement road infrastructure projects in accordance with the priorities
identified in Annex A”[4]
§
“the City will
encourage alternatives to automobile travel to protect and enhance air quality”
”[5]
1.3
Study Area
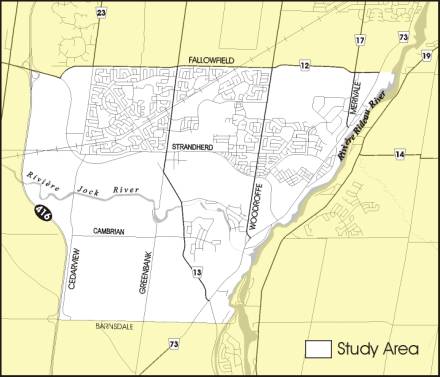
The study area for the transportation assessment is bounded by Fallowfield Road to the north, Rideau River to the east, Bankfield Road to the south and Highway 416 to the west. Study Area is shown in Exhibit 1: Study Area. The transportation analysis undertaken is also focused on key transportation corridors as defined in previous strategic transportation plans for the area and consequently references the City of Ottawa Screenlines in the immediate vicinity of South Nepean. These strategic screenlines are presented and reviewed in context with the existing travel demands as well as with the resulting future transportation demands which emerge as a result of the planned development levels and patterns identified for South Nepean.
Exhibit 1: Study Area
1.4
Traffic Analysis
This report has been prepared to document the analysis undertaken to confirm the existing and future transportation conditions, identify the transportation problems, and review the need and justification or opportunity for additional infrastructure in the Study Area
The traffic analysis for the need and justification component of this study was based on the assessment of the following:
§
Existing and
projected peak hour traffic volumes and capacity deficiencies; and;
§
Existing and
projected travel patterns in the study area.
The traffic analysis undertaken for the need and justification component was based on consideration of the following major issues:
§
Existing road and
screenline capacities within /adjacent to the Study Area;
§
Existing and
projected p.m. peak hour volumes and capacity deficiencies;
§
Future local,
regional and provincial transportation infrastructure improvements planned
within the area;
§
Future
projections for increases in transit usage (mode share) for trips travelling
within and beyond the Study Area;
§
Ability of the
existing and future planned transportation network to safely and efficiently
accommodate future vehicular demands; and
§ Future capacity requirements through the Study Area as well as on the surrounding local, regional and provincial road system.
The assessment of the transportation condition addresses the vehicle flows in and through the Study Area from a strategic level from the perspective of network performance. A strategic analysis was performed to review the study area road network performance in the context of Strategic Screenlines and area wide travel. The impact of city wide road infrastructure on existing and future traffic conditions in the Study Area was the focus of the assessment.
2 Existing Conditions
2.1
Existing Development
The study area is comprised of Nepean South and is located south of the greenbelt (Fallowfield Road). To facilitate ongoing analysis and monitor growth trends across the City, a number of zone/district zone systems have been established. Exhibit 2: South Nepean Existing Demographics presents the City of Ottawa’s 258 traffic zone system as it relates to the study area demographics for South Nepean. Current estimates as of mid 2005, indicate that South Nepean has an existing inventory of almost 20,000 units reflecting a population level of approximately 55,000 persons. Based on the most recent employment survey (2001) undertaken by the City of Ottawa South Nepean has attracted almost 7,000 jobs.
Exhibit 2: South Nepean Existing Demographics
|
Existing South
Nepean |
|||
|
Traffic Zone |
Employment(2001) |
Population (Mid-2005) |
Households (Mid-2005) |
|
136 |
2,375 |
22,550 |
7,775 |
|
137 |
350 |
2,800 |
975 |
|
222 |
0 |
25 |
0 |
|
223 |
400 |
25 |
0 |
|
224 |
275 |
2,025 |
700 |
|
225 |
450 |
14,800 |
5,350 |
|
226 |
1,625 |
11,350 |
4,175 |
|
Total |
6,850 |
54,800 |
19,350 |

Source: City of Ottawa – (values rounded to nearest 25)
2.2
Existing Network
The transportation system serving the Study Area comprises arterial roads, collector roads, and local streets. These designations reflect the hierarchy within a road network, where each road class has the following primary functions:
§
arterial roads:
regional traffic movement. Arterial roads are intended to provide for higher
traffic volumes (typically greater than 800 vehicles per hour per lane in the
peak direction);
§
collector roads:
local traffic movement and land access. Collector roads have moderate traffic
volumes (up to 800 vehicles per hour in the peak direction) and primarily serve
neighbourhood traffic; and
§ local streets: land access. Local streets have low traffic volumes (typically less than 200-300 vehicles per hour in the peak hour and serve local traffic.
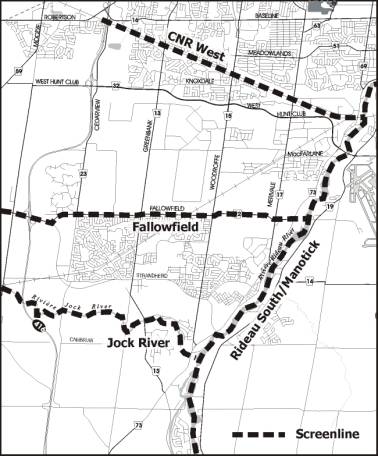
A map of the study area transportation network and the location of key screenlines reviewed in the transportation assessment is presented as Exhibit 3: Study Area Transportation Network and Key Screenlines. A brief description of the key roads in the Study Area, and their existing and planned functions are provided below:
Fallowfield Road within the Study Area is a 2-lane paved arterial roadway which widens to 4 lanes between Greenbank Road and Woodroffe Avenue. The posted speed limit is 60 km/h along the majority of the road although the section east of Woodroffe Ave has a speed limit of 80 km/h. The roadway serves as an east-west arterial road connecting Highway 416 to Prince of Wales Drive (former Highway 16).
Prince of Wales Drive within the Study Area is a 2-lane paved arterial roadway with a posted speed of 80km/h. The roadway serves as a major north-south arterial connecting Barrhaven and hamlets south of the city directly to the city centre.
Strandherd Drive within the Study Area is a 2-lane paved arterial roadway with a posted speed of 80km/h west of Greenbank Road and 60 km/h east of Greenbank Road. The roadway serves as an east-west arterial road providing access to Fallowfield Road and Highway 416 to the west and Woodroffe Avenue to the east.
Cambrian Road within the Study Area is a 2-lane paved rural arterial roadway with a posted speed of 80 km/h. The roadway serves a limited role as an east-west connection between Jockvale Road and Cedarview Road.
Greenbank Road within the Study Area is a 2-lane paved arterial roadway with a posted speed of 60 km/h. The roadway serves as a major north-south arterial connecting Barrhaven to the City of Ottawa.
Woodroffe Road within the Study Area is a 2-lane paved arterial roadway with a posted speed of 70 km/h. The roadway serves as a major north-south arterial connecting Barrhaven to the City of Ottawa.
Exhibit 3: Study Area Transportation Network and Key Screenlines
Jockvale Road within the study area is a 2-lane paved collector road north of Strandherd Drive and a 2-lane paved arterial roadway to the south and east of Greenbank Road. The roadway runs in a north-west /south-east direction and is divided by commercial development between Strandherd Dive and Greenbank Road. The posted speed limit is 70 km/h.
Cedarview Road within the Study Area is a 2-lane paved arterial roadway with a posted speed of 80 m/h. The roadway serves as a north-south arterial paralleling Highway 416. South of Fallowfield the role of the roadway is not as significant as north of Fallowfield where the road serves as a major arterial road into north Nepean.
2.3
Existing Traffic
The existing transportation conditions associated with South Nepean has been evaluated across key study area screenlines. A screenline is an imaginary or real boundary across which travel demand and supply issues may be evaluated. Typically, physical barriers (rail lines/rivers/greenbelt etc) are used as they tend to limit physical crossing opportunities and thereby also reduce tendencies for multiple crossings during peak traffic periods better reflecting the demand for transportation infrastructure. The City of Ottawa has established a number of screenlines intersecting north-south traffic patterns in South Nepean and these have been highlighted in Exhibit 3.
A review of current travel demand within each of the study area screenlines has been prepared based on a review of the most recent observed traffic count data and is presented as Table 1: Existing Travel Demand for Study Area Screenlines . The City of Ottawa’s Annual Classification and Occupancy Screenline Count program was used to establish current travel demands based on available traffic data collected in 2005 as well as in some cases the previous two years 2004 and 2003. The most recent 2005 traffic observations recorded a substantial increase in transit across the Fallowfield Rd Screenline, on Woodroffe Avenue north of Fallowfield Rd. Overall, as would be expected current travel demand is the largest across the CNR screenline and the travel demand decreases as one moved further south. Observed travel demands across the Rideau River South/Manotick Screenline are relatively balanced in both directions during the PM peak commuter hours, however the westbound direction has recorded slightly larger volumes resulting in an approximate 45:55 east/west directional split.
Table 1: Existing Travel Demand for Study Area
Screenlines
|
Screenline (PM
-Southbound)2 |
Motorized Person Trips1 |
Transit1 |
Mode Share |
Non Motorized Person Trips1 |
|
CNR
West |
15,950 |
1,800 |
11% |
150 |
|
Fallowfield |
12,750 |
1,950 |
15% |
50 |
|
Jock
River |
4,075 |
- |
- |
- |
|
(PM
-Westbound) 2 |
|
|
|
|
|
Rideau
South/Manotick |
8,550 |
450 |
5% |
75 |
|
|
|
|
|
|
Notes:
1. Source: City of Ottawa Annual
Screenline Count Program (2005, 2004 and 2003). Motorized persons trips includes observed travel by car, light
trucks and transit and other motorized vehicles as recorded by City traffic
counts. Non-motorised travel modes are predominately walking and cycling.
2.
Peak direction during PM peak hour
The Fallowfield Rd Screenline, due to its strategic location in intercepting major north-south traffic flows captures commuter travel flows into an out of the remaining urban area of the City of Ottawa and therefore provides for an opportunity to track recent traffic flows/growth associated with South Nepean. The annual observed traffic (commuter peak flow outbound-southbound direction of travel) crossing the Fallowfield Rd Screenline over the past ten year period is been presented in Exhibit 4: Growth in Travel -Fallowfield Screenline. The volume of traffic crossing the screenline during the PM commuter peak hour has grown from approximately 5,150 passenger car units (pcu’s) in 1995 to 7,800 pcu’s for the most recent count year of 2004. This hourly observed traffic demand, expressed as pcu’s includes all vehicular traffic (heavy trucks, commercial travel and buses). The use of passenger car units (pcus) allows for the explicit consideration of various vehicle types and the impact of different operating characteristics for individual vehicle types within the traffic stream both in terms of impacts on demand and supply (capacity) analysis. Exhibit 4 also presents the observed auto vehicle traffic which represents commuter traffic, auto person trips which reflects the total number of persons observed traveling within the commuter traffic and the total number of persons observed traveling by public transit.
The observed growth in pcu demand which has
been observed across the Fallowfield Rd Screenline represents an annual traffic
growth of almost 6% per year (linear, 4.7% annual compound growth). During the same timeframe the population
located south of Fallowfield Road has grown from 42,900 to 66,200 also
reflecting a similar 6 % per annum growth rate (linear, 4.9% annual compound
growth). The similar rates of growth
for traffic and population of Nepean South highlights the current live:work
relationships associated with suburban growth in southwest Ottawa over the past
ten years.
The evaluation of existing roadway traffic conditions is often expressed in terms of the level of service (LOS) provided during peak traffic loadings. For specific roadway links, the level of service (LOS) is determined on the basis of volume to capacity ratios (the volume of traffic versus the ability of the roadway to accommodate traffic flow). The v/c ratio provides a measure of traffic volume demand to the available capacity, with a capacity condition represented by a v/c ratio of 1.0 (i.e. volume equals capacity). The relationship between the levels of service and volume/capacity ratios, which are typically defined by traffic planners and relate to the level of congestion experienced on the roadways are summarized in Table 2: Level of Service Definition.
Table 2: Level of Service Definition
|
Level of service |
Volume : Capacity Ratio (v/c) |
Network
Performance |
|
LOS A |
0 to 0.2 |
Free
flow |
|
LOS B |
>0.2 to 0.4 |
Stable
flow |
|
LOS
C |
>0.4
to 0.69 |
Stable flow |
|
LOS
D |
>0.7
to 0.89 |
Approaching unstable flow |
|
LOS E |
>0.9 to 1.0 |
Unstable
flow |
|
LOS
F |
>1.0 |
Forced Flow |
During peak hours LOS D may be considered acceptable
The travel demand, expressed as passenger car units, along major screenlines which focus on South Nepean, are presented in Table 3: Existing Level of Service for Study Area Screenlines. The use of passenger car units allows for a comparison of the existing traffic demands and transportation supply in terms of roadway capacity during peak travel conditions. In Table 3, the volume of traffic expressed as passenger car units is presented and is based on the most recent observed traffic volumes for each of the roadways within each of the major study area screenlines. A review of the volume to capacity ratios for each of the screenlines indicate that the CNR Screenline is experiencing a level of congestion typically associated with LOS D during peak conditions. Further south, while the screenline volume:capacity ratios appear to be within acceptable levels, further scrutiny indicates that a number of individual roadways are operating at or above their stated capacities. For example, the volume:capacity (V/C) ratio across the length of the Fallowfield Screenline is approximately 0.66, however much of the spare capacity is located west of Cedarview Rd. Upon examination of the spare capacity west of Cedarview much of it exists on Hwy 416, but the stated V/C of 0.42 at the Fallowfield Screenline is considerably more (approximately 20% higher) at the CNR Screenline. Consequently, one needs to be cautious regarding the opportunities to access the full stated capacity of Hwy 416 across the Fallowfield Screenline without full consideration of these downstream impacts.
Table 3: Existing Level of Service for Study Area
Screenlines
|
Screenline (PM
Southbound) |
Roadway |
Peak no. of lanes |
Existing Capacity1 (pcus) |
Existing Volume (pcus) |
Volume to Capacity Ratio |
|
CNR
West |
Prince of Wales Merivale Woodroffe Greenbank Cedarview Highway 416 Total |
1 2 2 2 1 2 9 |
1,470 1,680 1,995 1,995 600 4,620 12,360 |
1,500 2,125 1,950 1,700 350 2,850 10,475 |
1.02 1.26 0.98 0.85 0.58 0.62 0.85 |
|
Fallowfield (PM peak hour Southbound Direction) |
Prince of Wales Merivale Woodroffe2 Greenbank Cedarview Highway 416 Moodie Total |
1 1 2 1 1 2 1 9 |
1,470 1,050 1,9952 1,365 600 4,620 735 11,835 |
1,625 950 1,300 1,200 450 1,950 375 7,850 |
1.11 0.90 0.65 0.88 0.75 0.42 0.51 0.66 |
|
Jock
River (PM peak hour Southbound Direction) |
Prince of Wales Jockvale Greenbank Cedarview Highway 416 Moodie Total |
1 1 1 1 2 1 7 |
1,470 900 800 600 4,000 735 8,505 |
1,125 525 150 50 1,550 225 3,625 |
0.77 0.58 0.19 0.08 0.39 0.13 0.43 |
|
(PM Westbound) |
|
|
|
|
|
|
Rideau
River South/Manotick |
Heron Bridge Hogs Back Bridge MSheflin Bridge Manotick Bridge Roger Stevens Total |
3 1 2 1 1 8 |
2,625 900 2,625 840 945 7,935 |
2,675 700 1,925 1,150 375 6,825 |
1.02 0.78 0.73 1.37 0.40 0.86 |
|
|
|
|
|
|
|
Notes: 1
Capacity in pcus based on TMP Background Report -Roadway Requirements and
Staging Plan-July 2003
2
Additional lane added to Woodroffe Ave through the greenbelt, post TMP
3. Existing Traffic Volumes based on review of Annual Screenline
Classification and Occupancy Counts
3 Future Conditions
3.1
Approach
An assessment of future travel demands was carried out through a two step approach which built on previous strategic planning studies undertaken by the City of Ottawa for South Nepean. The City of Ottawa had prepared strategic level travel demand forecasts as part of the recently approved City of Ottawa Official Plan (OP). In support of the OP, the City’s Transportation Master Plan documents the results of the long range travel demand forecasting work conducted to identify future transportation needs and services. This work was carried out through the application of a forecasting model developed by the City of Ottawa, in concert with other TRANS agencies. TRANS is a joint technical committee on transportation systems planning in the National Capital Region (NCR) and has undertaken a number of projects of common interest to member planning agencies. The TRANS model contains coded road and transit network infrastructure for both existing facilities and planned long-range improvements and was based on 258 traffic zone system (more recently updated in 2003 expanding the number of traffic zones which underlines the detailed analysis. The mathematical relationships and sub-models allow for travel demands based on shortest trip times to be determined for each origin and destination pair (traffic zones) and results in a total assignment of traffic, auto vehicle and transit persons, to the network respecting key travel elements such as congested travel times within specific corridors. The model is maintained, enhanced and updated by TRANS based on the most recent data available for use in strategic transportation planning studies (i.e. the 2003 City of Ottawa Transportation Master Plan).
Forecasts from the TRANS model were organized to reflect future travel demand across key strategic screenlines (by road link crossing the screenline) and compared with current and past observed rates of growth for existing, future planned and future alternative networks. Growth rates were calculated for the screenline, and associated links, by comparing each future year scenario to the existing model scenario.
A review of planned development levels and patterns was carried out in concert a review of TMP future travel demands. The current plans for the South Nepean Town Centre have progressed significantly and consequently a more detailed allocation of land uses has been prepared for the preferred development concept.
To complement the strategic forecasts, an assessment was also carried out of planned growth within the study area not previously identified within the study area as part of the city wide assessment of transportation demands undertaken to support the most recent Official Plan. Recent planning efforts for lands south of the Jock River have identified additional suburban growth potential for that sector of Nepean South. Consequently the purpose of the analysis undertaken has been to identify the future need for transportation infrastructure to serve South Nepean in the context of the previous TMP work and the emerging demand for additional urban growth as part of the Barrhaven South Community.
3.2
Land Use and Development Potential
The location of where people live and work
are key elements in identifying the travel demands placed on the underling
transportation networks and consequently these data are primary inputs to the
City’s long range travel demand forecasting model. The TRANS model includes assumptions for land use based on
detailed projections of employment, population and number of planned dwelling
units. Land use forecasts contained in the Official Plans are reviewed and
updated as a result of changing economic climates. The level and distribution
of growth for the City of Ottawa’s 2021 planning horizon as outlined in the
current Official Plan is highlighted in Exhibit
5: Population and Employment Projections.
![]() Exhibit 5: Population and
Employment Projections
Exhibit 5: Population and
Employment Projections
|
Area |
Population |
Employment |
|||||
|
|
2001 |
2021 |
2001 |
2021 |
|||
|
Inside Greenbelt |
517,000 |
588,000 |
403,000 |
514,000 |
|||
|
West Urban Centre |
73,000 |
186,000 |
36,000 |
90,000 |
|||
|
South Urban Centre |
42,000 |
172,000 |
8,000 |
70,000 |
|||
|
East urban Centre |
88,000 |
131,000 |
15,000 |
45,000 |
|||
|
Rural Area |
80,000 |
115,000 |
18,000 |
29,000 |
|||
|
Total |
800,000 |
1,192,000 |
480,000 |
749,000 |
|||
Source: City of Ottawa Transportation Master Plan

To facilitate the analysis of the South Nepean future transportation demands, more detailed estimates of projected growth levels and the distribution of this growth to the traffic zone system as contained in the Official Plan projections are presented in Exhibit 6: South Nepean Demographic Projections. The tabular listing of population and employment levels for each of the study area traffic zones includes the most recent estimate of development (bracketed) followed by the planned future level of development for 2021, previously identified as part of the OP planning exercise. As indicated, Traffic zones 225, 226 and 136 located within the northern section of the study area have been largely developed in terms of the proposed number of dwelling units, however significant employment growth remains to occur in traffic zone 226. In the western part of the study area, adjacent to Highway 416, considerable employment growth has been identified for traffic zone 222 (17, 550 jobs representing almost 40 % of the growth in employment for South Nepean). The remaining traffic zones 223, 224 and 137 were previously identified to accommodate approximately 80% of the proposed population growth anticipated to occur within the planning horizon of 2021.
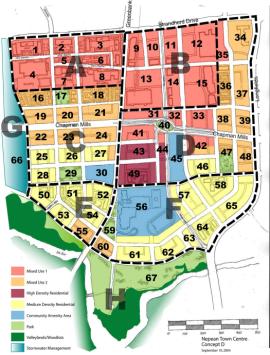
As planning studies are undertaken for specific lands within South Nepean, the pattern of development, the magnitude, and the spatial distribution of various community uses is further defined. In this respect the preliminary South Nepean Town Centre land use plan is presented as Exhibit 7: South Nepean Town Centre Land Use.
|
South Nepean |
|||
|
Traffic Zone |
Employment (2001) 2021 |
Population (2005) 2021 |
Households (2005) 2021 |
|
136 |
(2,375) 3,300 |
(22550) 20,350 |
(7,775) 7,325 |
|
137 |
(350) 6,550 |
(2800) 13,075 |
(975) 4,750 |
|
222 |
(0) 17,550 |
(25) 6,900 |
(0) 2,500 |
|
223 |
(400) 5,125 |
(25) 14,075 |
(0) 5,100 |
|
224 |
(275) 5,900 |
(2,025) 19,650 |
(700) 7,125 |
|
225 |
(450) 1,625 |
(14,800) 19,300 |
(5,350) 7,000 |
|
226 |
(1,625) 9,250 |
(11,350) 11,850 |
(4175) 4,300 |
|
Total |
(6,850) 51,000 |
(54,800) 107,225 |
(19,350) 38,825 |
Exhibit 6: South Nepean Demographic Projections
Source: City of Ottawa – Official Plan Projections – (values rounded to nearest 25)
The proposed population and employment levels for the South Nepean Town Centre for each of the development plan quadrants are also identified in Exhibit 7. Both the mid term and build out levels for each of the specific land uses identified are highlighted. A more detailed level of desegregation for these individual uses is attached to this report as Appendix A. The concept plan for the South Nepean Town Centre as currently defined respects the scale of development anticipated within the framework of the Official Plan projections as previously presented in Exhibit 4 and Exhibit 5.
|
Quadrant |
Population* |
|
|
Mid Term |
Build Out |
|
|
A |
700 |
2,075 |
|
B |
1,075 |
3,200 |
|
C |
1,175 |
3,050 |
|
D |
2,025 |
5,100 |
|
E |
875 |
1,825 |
|
F |
1,700 |
3,475 |
|
Total |
7,550 |
18,725 |
|
Quadrant |
Employment* |
|
|
Mid Term |
Build Out |
|
|
A |
2,150 |
3,575 |
|
B |
3,325 |
5,550 |
|
C |
525 |
1,050 |
|
D |
1,825 |
3,200 |
|
E |
50 |
100 |
|
F |
50 |
75 |
|
Total |
7,925 |
13,550 |
|
*Values rounded to nearest 25 |
||
![]() Exhibit 7: South Nepean Town
Centre Land Use
Exhibit 7: South Nepean Town
Centre Land Use
More recently, other planning studies undertaken for Nepean South have identified additional growth potential within the urban boundary, south of the Jock River. The Barrhaven South Community Design Plan has identified the potential for increased residential development in traffic zone 137 beyond the previous OP projections. For the lands located south of the Jock River (traffic zone 137) the City of Ottawa’s Official Plan growth projections identified approximately 4,750 dwelling units. Current planning studies of Barrhaven South have indicated an increased dwelling unit potential (within Traffic zone 137) from the current OP projection of 4,750 to approximately 10,400 units. A preferred concept plan identified as part of the Barrhaven South Community Design Plan work being undertaken is presented in Exhibit 8: Barrhaven South Community Design Plan – Preferred Concept Plan.
The transportation analysis which follows considers the impacts of recent planning studies noted above and therefore ensures the future travel demand projections are reflective of current plans for South Nepean Community.
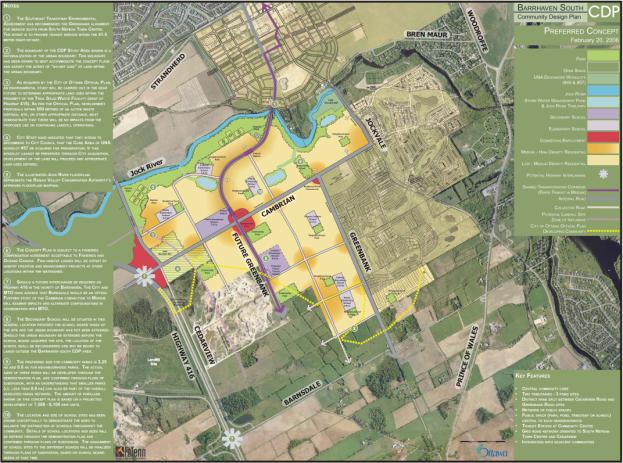
Exhibit 8: Barrhaven South Community Design Plan – Preferred Concept Plan.
3.3
Strategic Model TMP Forecasts
Background work undertaken in support of the City of Ottawa’s Transportation Master Plan (TMP) has identified and documented the level of future increases in travel demand across major travel corridors in the study area as defined by the City’s Screenlines. Both the level of development analyzed and the projected future travel demands are identified as part of the TMP and related background supporting documents. As part of the transportation review undertaken in conducting the needs assessment for this project, projected traffic and public transit ridership demands associated with the planned growth in Nepean South were provided by the City of Ottawa. These baseline travel demand projections were based on policy public transit modal split of 30% city-wide during peak travel periods.
A summary of the future travel demand across each of the four study area screenlines are presented in Table 4: Future Travel Demand for Study Area Screenlines. The Transportation Master Plan travel demand projections indicated similar levels of PCU demand across the CNR and Fallowfield Screenlines with a significant drop in PCU demand crossing the Jock River Screenline. This lower travel demand across the Jock River Screenline reflects the proportion of planned development north and south of the Jock River. The TMP had anticipated approximately 12 % of the future South Nepean housing stock to be located south of the Jock River.
Table 4: Future Travel Demand for Study Area
Screenlines
|
Screenline (PM
-Southbound)2 |
Total Person Trips1 |
Transit1 |
Mode Share |
PCU1 Demand |
|
CNR
West |
20,000 |
7,200 |
36% |
11,850 |
|
Fallowfield |
17,500 |
5,500 |
31% |
11,500 |
|
Jock
River3 |
7,450 |
1,850 |
25% |
5,200 |
|
(PM
-Westbound) 2 |
|
|
|
|
|
Rideau
South/Manotick |
18,900 |
4,700 |
25% |
13,200 |
|
|
|
|
|
|
Notes:
1. Source: City of Ottawa TMP
Projected Travel Demands and Mode Splits
2.
Peak travel direction during PM peak hour
3.
Source: Transportation Overview Report Barrhaven South Draft Community Design
Plan
The projected travel demands associated with the Fallowfield and Jock River Screenlines are of particular interest in carrying out and documenting the need for additional roadway transit facilities in the context of the Greenbank Road/Southwest Transitway Environmental Assessment. As a result, these two screenlines have been carried forward to identify and assess the need for transportation infrastructure to accommodate projected travel demands. In this respect a sensitivity analysis was also undertaken to identify a range of road and transit travel demands based on achievement of various modal split levels within the corridor of interest. Three cases were evaluated through the application of; existing transit mode split levels maintained throughout the planning period; an increase over the existing transit mode split (a midpoint between the existing observed levels and the TMP policy mode split); and the future 2021 policy mode split as documented in the TMP. Also for each of these scenarios the resulting V/C ratios were determined against the existing road capacity within each of the two screenlines.
The results of this analysis is summarized in Table 5: Screenline Travel Demand Assessment and presents both the level transit ridership to be carried across the screenline as well as the resulting roadway requirement expressed in pcus to be consistent with roadway capacity units. Under the existing roadway conditions (roadway capacity) the impact of increased travel demands to South Nepean during the PM peak hour are particularly focused on the Fallowfield Rd Screenline. The LOS are expected to fall to unacceptable levels across the length of the screenline at the Fallowfield Screenline with a V/C ratio of 0.97 with transit levels reaching the TMP target of 31%. It is also important to note that this is an aggregate screenline V/C and consequently individual facilities will experience higher levels of congestion as increased pressure is placed on existing facilities which were previously identified as currently experiencing low levels of service (Prince of Wales, Merivale, and Greenbank: see Table 3).
Table 5: Screenline Travel Demand Assessment (TMP)
|
Screenline (PM peak Southbound)2 |
Mode Share |
Transit1 (person trips) |
PCU1 Demand |
Current Capacity (pcus) |
V/C Ratio |
|
|
Fallowfield - Existing Mode Split - Midpoint Mode Split - TMP Mode
Split |
15% 23% 31% |
2,625 4,025 5,500 |
13,850 12,550 11,500 |
11,835 |
1.17 1.06 0.97 |
|
|
Jock River3 - Existing Mode
Split - Midpoint Mode
Split - TMP Mode
Split |
10%* 15% 25%3 |
750 1,125 1,8503 |
6,250 5,900 5,6003 |
8,5053 |
0.74 0.69 0.66 |
|
|
|
|
|
|
|
|
|
Notes:
1. Source: City of Ottawa TMP
Projected Travel Demands and Mode Splits
2.
Peak travel direction during PM peak hour
3.
Source: Transportation Overview Report Barrhaven South Draft Community Design
Plan
*
Base level of transit ridership assumed ( no existing transit service in
corridor)
3.4
Transportation Demands under South Nepean Buildout Scenario
As highlighted in the previous section Land Use and Development Potential, recent planning studies have identified additional development potential south of the Jock River. The Barrhaven South Draft Community Design Plan – Transportation Overview Report has identified the potential for the urban lands south of the Jock to accommodate an increased number of residential units; approximately 10,400 units by buildout compared with an estimated OP projection of 4,740 units.
The transportation impacts associated with this increased level of development were analyzed and documented in the previous noted study and considered two independent techniques in arriving at the increased travel demands for full development to 10,400 dwelling units in Barrhaven South. Consequently the transportation analysis which follows, is based on the baseline travel demands presented in the Barrhaven South Draft Community Draft Community Design Plan –Transportation Overview report and carries forward the sensitivity analysis associated with the achievement of a possible range of public transit modal splits. Each of these were discussed and reviewed in the previous section for the TMP baseline traffic projections.
The impacts on screenline travel demands as they relate to the Greenbank Road/Southwest Transitway Environmental Assessment have been summarized in Table 6: Screenline Travel Demand Assessment (South Nepean Buildout). The increases in travel demand across each of the Fallowfield and Jock River Screenlines are substantial for auto and public transit under each of the three modal share levels presented and analyzed previously. The roadway V/C ratios and transit ridership levels which emerge as a result of each of the options considered for the South Nepean Buildout scenario all indicate a requirement for additional transportation infrastructure in the corridor
Table 6: Screenline Travel Demand Assessment
(Barrhaven South Buildout)
|
Screenline (PM peak Southbound)2 |
Mode Share |
Transit1 (person trips) |
PCU Demand |
Current Capacity (pcus) |
V/C Ratio |
|
|
Fallowfield - Existing Mode Split - Midpoint Mode Split - TMP Mode
Split |
15% 23% 31%1 |
3,025 4,625 6,2501 |
15,900 14,400 12,9001 |
11,835 |
1.34 1.22 1.09 |
|
|
Jock River - Existing Mode
Split - Midpoint Mode
Split - TMP Mode
Split |
10%* 15% 25%3 |
1,625 2,450 4,0753 |
13,650 12,900 11,3753 |
8,5053 |
1.60 1.52 1.34 |
|
|
|
|
|
|
|
|
|
Notes:
1. Source: City of Ottawa TMP -
Projected Travel Demands and Mode Splits
2.
Peak travel direction during PM peak hour
3.
Source: Transportation Overview Report Barrhaven South Draft Community Design
Plan
*
Base level of transit ridership assumed (no existing transit service in
corridor)
3.5
Future Transportation Needs
The Transportation Master Plan had identified specific road and transit requirements to serve long term growth for South Nepean. The future array of TMP roadway infrastructure widening and extensions of existing infrastructure are identified in Table 7: Future Roadway Capacity and V/C Ratios (South Nepean Buildout). In addition, the impact on the resulting V/C ratios for each of the modal share levels analyzed are also presented. The future road capacity levels are based on previous work carried out in support of the City’s Transportation Master Plan (TMP) and relate to the individual road widening identified in the table. .
For the Fallowfield Screenline each of the two proposed roadway widenings (Prince of Wales and Woodroofe) had been previously identified as part of the roadway requirements to accommodate South Nepean projected travel demands. Under each of the modal split options evaluated, there is a clear need for additional roadway capacity and transit service needed to accommodate future projected travel demands.
It is important to note that the TMP did not specifically evaluate the Jock River Screenline and consequently the analysis outlined in Table 7 identifies the need for an additional arterial lane across the Jock River. To facilitate our analysis of roadway capacity the widening of Cedarview Road to four lanes has been assumed to address the capacity shortfall at the Jock River Screenline.
At the Jock River Screenline, considerable
roadway expansion is necessary to address future traffic demands and based on
achieving a modal split target of 25% at this location the roadway V/C ratio
remains at approximately 0.93 (LOS E).
The resulting levels of transit ridership anticipated with the
achievement of between 15 to 25% modal
split have been identified as 2,450 to 4,075 riders per hour respectively. The
current recorded volume of peak hour transit riders on Woodroffe north of
Fallowfield are slightly lower at approximately 1,750 riders per hour. The
extension of the Southwest Transitway within its own ROW is therefore required
to service the level of transit ridership identified in the TMP as well as the
increased need associated with full buildout of Barrhaven South.
Table 7: Future Roadway Capacity and V/C Ratios
(Barrhaven South Buildout)
|
Screenline (PM peak Southbound)2 |
Mode Share |
Transit1 (person trips) |
PCU1 Demand |
Future Roadway
Infrastructure |
Future Capacity (pcus) |
V/C Ratio |
|
|
Fallowfield - Existing Mode Split - Midpoint Mode Split - TMP Mode
Split |
15% 23% 31% |
3,025 4,625 6,250 |
15,900 14,400 12,900 |
- Prince of Wales
Widening to 4 lanes - Woodroffe
Widening to 4 lanes |
13,205 |
1.20 1.09 0.98 |
|
|
Jock River3 - Existing Mode Split - Midpoint Mode Split - TMP Mode
Split |
10%* 15% 25%3 |
1,625 2,450 4,0753 |
13,650 12,900 11,3753 |
- Prince of Wales
Widening to 4 lanes - Jockvale Rd
widening to 4 lanes - Greenbank
widening to 4 lanes - Cedarview
widening to 4 lanes |
12,2453 |
1.11 1.05 0.93 |
|
|
|
|
|
|
|
|
|
|
Notes:
1. Source: City of Ottawa TMP
Projected Travel Demands and Mode Splits
2.
Peak travel direction during PM peak hour
3.
Source: Transportation Overview Report Barrhaven South Draft Community Design
Plan
*
Base level of transit ridership assumed (no existing transit service in
corridor)
3.6
Summary of Findings
The traffic analysis undertaken as part of this report has confirmed the following:
· The South Nepean Community is anticipated to grow from a population of 55,000 persons in 2005 to some 123,000 persons by 2021 (more than double) based on TMP projections and the recently revised development potential associated with Barrhaven South Community .
o Of this 123,000 person growth, some 18,700 will develop in the South Nepean Town Centre (15% of the total growth).
o The Barrhaven South Community has a potential to accommodate approximately 10,400 dwelling units south of the Jock River, significantly larger than what was identified with the OP projections of 4,700 units. Base on average household size for South Nepean, this reflects approximately 15,600 population increase over previous OP population projections.
· The South Nepean Community is expected to grow from an employment 7,000 persons in 2001 to some 51,000 persons by 2021 (7 times). Of this 44,000 person growth in employment, some 13,500 will develop in the South Nepean Town Centre (over 30% of the total growth).
· Current volumes across key Study Area Screenlines while not exhibiting significant deficiencies across the full width of the screenline, they do indicate growing pressures along individual facilities as peak congestion levels for individual roadway facilities reach their effective carrying capacities;
· The proposed growth as outlined for South Nepean will result in significant increases in person trip making into and out of the Study Area over the Planning Horizon to 2021.
· Assuming the achievement of TMP transit shares (city-wide policy of 30% transit modal split) and the future transportation infrastructure in the Study Area, by 2021, including the widening of Greenbank Rd , the analysis of future north/south traffic service at the Jock River Screenlines indicates the the road system will be operating at or near the effective roadway capacity. Also it should be noted that the future traffic conditions experienced across the Jock River Screenline includes the widening of Cedarview Rd (to a four lane roadway) which had not previously been identified within the long range transportation infrastructure needs as part of the Transportation Master Plan.
· A higher form of transit services, such as the extension of the SW Transitway, is required to serve the planned growth in transit ridership within the corridor and will assist in ensuring public transit remains an attractive alternative to auto based travel. The growth in transit ridership within the corridor supports the extension of transitway services south along Greenbank Road to service the projected travel demands of Barrhaven South.
· Increased transit use and the achievement of a city-wide 30% transit modal split by 2021 will not eliminate the need for road improvements to address north-south capacity deficiencies at the Fallowfield Road and Jock River screenlines for the 2021 Planning Horizon.
Appendix A – South Nepean Town Centre
Development Plan Details
Draft Population and Employment
Projections - Concept F November 30, 2004