1. Background
1.1 Importance of Pedestrian & Cycling Activity
The Transportation Master Plan for the former Region of Ottawa-Carleton puts particular emphasis on encouraging alternative modes of travel and reducing dependency on motorized vehicles. Indeed, the Regional Official Plan states that Council’s objectives are: to provide an integrated transportation system and programs that promote an increase in walking, cycling and use of public transit and minimize the reliance on the private automobile (Regional Official Plan as approved by OMB, April 1999, pg. 118). There are many reasons for urban areas to promote walking and cycling as viable transportation alternatives:
· Health and Fitness – Walking and cycling are active transportation modes which can improve health and fitness among participants. A news release issued by Health Canada in April 2002 emphasizes the importance of regular physical activity:
According to
the World Health Organization (WHO), a sedentary lifestyle is one of the ten
leading causes of death and disability in the world, resulting in approximately
two million deaths every year. Compelling scientific evidence shows that
regular physical activity is fundamental to good health and quality of life. It
reduces the risk of many serious health conditions including heart disease,
obesity, diabetes, stroke, depression and cancers of the colon and the breast.
Despite this evidence, two-thirds of Canadians are not sufficiently active to
benefit their health.
· Vehicle Congestion – As urban areas continue to grow, there is increasing demand for new road infrastructure to accommodate motor vehicle traffic. The cost of this road infrastructure is substantial, both in dollar terms as well as environmental and social terms. By encouraging commuters to walk or cycle, traffic congestion is reduced, and with it, the need for road expansions.
· Air Pollution – In a report prepared for the Ontario Medical Association, DSS Management Consultants (2000) estimates that air pollution in Ottawa is responsible for the death of over 100 people each year. Medical costs from air pollution are estimated at $23 million annually, while lost productivity costs the city nearly $29 million. As more and more people choose active transportation modes, vehicle use declines, reducing vehicle emissions and improving air quality.
· Community benefits – Programs that support non-motorized travel can lead to improvements in the walking and cycling environment, benefiting the entire community. Moreover, walking and cycling provide opportunities for neighbourhood interaction, and help to enhance community awareness and participation. An increase in walking and cycling can also play an important role in alleviating community traffic concerns. A drop in vehicular travel demand ultimately translates into fewer vehicles in the community, particularly as improvements in traffic flow reduce the incentive for vehicles to cut-through residential areas. Other traffic concerns are also addressed by increasing the pedestrian and cycling modal share, in particular, concerns related to:
- Parking;
- Noise;
- Speeding (especially in school zones); and
- New road construction.
Such issues have the potential to harm the fabric of communities and impact residents’ quality of life.
Clearly, walking and cycling have an important role to play in helping cities achieve important sustainability objectives. The ability to monitor changes in walking and cycling activity is therefore essential to assess our progress towards such goals and confirm the effectiveness of related programs and policies.
1.2 Relationship Between Goal Setting and Monitoring
It is generally recognized that goal setting is an important first step in achieving desired changes in travel behaviour. To successfully bring about increases in walking and cycling, a well-thought out and rigorous process for goal setting is required. Indeed, setting goals is more than simply deciding what is the desired outcome to be achieved. It involves figuring out what needs to be done to get to the desired outcome and how long it will take to get there. Goals that take such considerations into account can be referred to as “SMART” goals. “SMART” is a handy acronym for the five characteristics of well-designed goals – goals that are Specific, Measurable, Acceptable, Realistic and Time-framed.
· Specific – Goals must be clear and unambiguous. Specific goals send a clear message of exactly what is expected, when, and to what extent. In addition, when goals are specific, our progress toward their achievement can be easily measured.
· Measurable – Goals need to be measurable. If goals are not measurable, it is impossible to gauge progress toward goal attainment. Moreover, it is difficult to stay motivated when no milestones exist against which progress is measured. In general, quantitative goals are easier to measure than qualitative goals.
· Acceptable – Goals must be acceptable and consistent with the long-term vision and values of a community. There should also be some degree of buy-in from those responsible for meeting the set goals. Therefore, what constitutes acceptable goals in one city may differ in another.
· Realistic – Goals are realistic if they are believed to be attainable. The attainability of a goal should be assessed through an analysis of the current situation (i.e., strengths and weaknesses) and likely future conditions (i.e., opportunities and challenges). Again, this suggests that what constitutes realistic goals may vary from one city to another. Goals that are set too high or too low become meaningless, and tend to be ignored in the long term. Also, goals that are not in synch with actual commitment tend to falter in the long term (e.g., Are current budgets-per-capita dedicated for this goal adequate?).
· Time-framed – Goals must have a time frame. Having a set amount of time gives goals structure and clarifies expectations. Without an end date there is no sense of urgency, no reason to take action. Having a specific time frame gives those involved the impetus to get started and facilitates effective monitoring of progress.
Once goals have been established, a monitoring program must be developed to measure progress towards achieving each goal. Such monitoring motivates actions to be undertaken in a timely manner in support of stated objectives, and provides on-going encouragement for ensuring goals are met. For this reason, care must be taken to develop a monitoring program that is consistent with stated goals; there is little value in monitoring something that does not provide relevant information on the desired outcome to be achieved.
In terms of pedestrian and cycling activity in the City of Ottawa, goals have traditionally been stated in terms of mode share objectives, as described in the following section.
1.3 Present Mode Share Targets
Mode share targets refer to the percentage of trips which are made by a particular travel mode such as walking, cycling, or transit. Mode share targets are defined in recognition of the fact that there are many desirable outcomes to be achieved by decreasing the number of vehicle trips and the associated infrastructure requirements. Such outcomes include lower vehicle emissions, pedestrian-friendly communities, improved health and fitness, and fewer environmental impacts from road construction.
To satisfy the growing travel demand needs within the City of Ottawa, a number of goals were defined in the Regional Municipality of Ottawa-Carleton’s Transportation Master Plan (TMP). Updates to these plans are currently being prepared to reflect the amalgamation of the many communities that now form the City of Ottawa.
The TMP had previously set specific afternoon peak hour modal share targets across strategic screenlines in the city, in addition to the following city-wide modal share targets:
Table 1 Transportation Master Plan Mode Share Targets
|
Transportation
Mode |
1995 Modal
Share |
2021 Target
Modal Share |
|
Walking |
9.6% |
10% |
|
Cycling |
1.7% |
3% |
|
Transit |
15.2% |
20% |
|
Automobile |
73.5% |
67% |
1.4 Long & Short Term Monitoring
The City of Ottawa currently monitors mode share trends using the results from household Origin-Destination (O-D) surveys. These surveys are generally conducted every 9 to 10 years. The last O-D survey took place in the autumn of 1995; the survey before that was conducted in 1986.
O-D surveys provide a snap-shot of travel behaviour on a “typical” day, and include information on the number of person trips by time of day and mode. Although pedestrian and cycling trips are captured in the surveys, the results correspond to autumn conditions, and are not representative of summer travel when walking and cycling trips tend to be greatest.
O-D surveys provide important information for long-term monitoring of pedestrian and cycling trends. However, such surveys are only conducted every 9 to 10 years, and are therefore of little value in monitoring trends on a short-term basis. Consequently, a need exists to develop a methodology for tracking cycling and pedestrian travel trends between O-D surveys. Such a methodology would allow the City of Ottawa to monitor the effectiveness of the policies and programs that have been put in place to encourage the use of non-motorized transportation modes.
The methodology used to monitor cycling and pedestrian activity between O-D surveys need not provide a precise indication of modal share, but should enable the City of Ottawa to track pedestrian and cycling trends on a relative basis to assess variations over time. In this way, a general indication of progress towards mode share targets can be achieved without incurring the substantial cost of conducting O-D surveys on a more frequent basis. By the same token, the methodology should be easy to apply using readily available data, allowing the City of Ottawa to respond to changes in pedestrian and cycling activity in an effective and timely manner.
Short term monitoring can be conducted on an area-wide basis or at the facility level. Facility-based monitoring often takes the form of “Before and After” studies, which are used to assess the impact of specific facility improvements. Area-wide monitoring is much rarer, but is the only effective way to determine the success of targeted programs designed to increase overall levels of walking and cycling activity in a particular area.
2. Study Goals and Objectives
The new Official Plan for the City of Ottawa will endorse sustainable development principles in support of walking and cycling. Although the Official Plan is expected to include modal share targets for pedestrian and cycling activity, no methodology currently exists for assessing the progress made towards achieving these targets on an on-going basis. While the City’s Origin-Destination survey can be used to derive walking and cycling modal shares, this survey is only conducted every 9 to 10 years, making it difficult to monitor walking and cycling trends more frequently. For this reason, a study was initiated to determine whether readily available data from the City’s annual traffic count program can be used to track pedestrian and cycling activity over time. The objectives of the study were to:
· Conduct a literature review to gain an appreciation of the different approaches currently used to monitor pedestrian and cycling activity in other cities;
· Examine the pedestrian and cycling data that is regularly collected by the City of Ottawa as part of the annual traffic count program, and assess the issues and challenges associated with using this data to monitor pedestrian and cycling trends on an area-wide basis;
· Evaluate the appropriateness of any existing techniques that have been developed to monitor cycling and pedestrian activity in the City of Ottawa;
· Refine existing monitoring approaches and/or propose new approaches in consultation with members of the Cycling Advisory Committee and Mobility Issues Advisory Committee; and
· Apply the proposed methodology(ies) to recent traffic count data to establish current pedestrian and cycling trends.
This report describes the study findings, and presents recommendations for further action to support the development of a reliable, low-cost monitoring program consistent with the pedestrian and cycling goals set out by the City of Ottawa.
3. Opportunities and Constraints
There are numerous opportunities and constraints associated with the development of a reliable, low-cost methodology for monitoring pedestrian and cycling activity. To assess these opportunities and constraints, a literature review was undertaken in conjunction with phone interviews with pedestrian and cycling co-ordinators at a number of cities deemed to have progressive pedestrian and cycling programs. In addition, the existing data collection system at the City of Ottawa was examined to identify the key issues impacting the development of a monitoring approach. This chapter presents the opportunities and constraints that were identified as part of this initial investigation.
3.1 Literature Review
A literature review was conducted to assess current practice in other urban areas and obtain guidance on some of the available options for monitoring pedestrian and cycling trends in the City of Ottawa. The following discussion highlights some of the key findings from this review, and illustrates the level of monitoring activity in other North American cities.
The FHWA’s Guidebook on Methods to Estimate Non-Motorized Travel (Schwartz et al. 1999) presents two methods to estimate pedestrian and cycling activity using traffic count data. “Before and After” studies are used to determine the impact of particular programs or facility improvements, while “Similar Condition” studies are used to compare travel levels across facilities with similar characteristics. Such studies can also be used to estimate future demand on a new facility based on the characteristics of existing facilities.
Both “Before and After” and “Similar Condition” studies are effective at analyzing usage at the individual facility level. While such studies can also be used to evaluate the success of city-wide improvement programs using the results from traffic counts and travel surveys, the Guidebook only provides examples of facility-specific applications. This is likely reflective of the predominant type of monitoring activity in North America, and may be attributed to a general lack of pedestrian and cycling data for area-wide monitoring projects.
The U.S. Bureau of Transportation Statistics recently released a document entitled Bicycle and Pedestrian Data: Sources, Needs, and Gaps. The following extract from the document provides a good summary of the current use of traffic counts to measure pedestrian and cycling activity in the United States:
Counts indicate how many people or vehicles are using the system at any
given location. Counts may be differentiated by user characteristics, time of
day, or day of week. In addition, if an appropriate sample is conducted, counts
can be summarized to provide estimates of overall facility or system usage by
time, geographic area, facility type, or user type. Counts have a variety of
uses, including:
·
Tracking trends in usage,
·
Developing exposure measures for crash analysis,
·
Evaluating level of service on a facility by comparing
volume to capacity,
·
Identifying and prioritizing improvements, and
·
Calibrating travel demand models.
Motor vehicle traffic volumes are monitored though the Highway
Performance Monitoring System (HPMS). The HPMS is a national system for tracking
motor vehicle traffic volumes by vehicle type, facility type, and geographic
area based on counts at a carefully selected sample of locations. No equivalent
to the HPMS exists for monitoring pedestrian and bicycle volumes or distance
traveled. While a few cities and metropolitan planning organizations routinely
conduct pedestrian and bicycle counts, most collect them only sporadically for
specific studies, or do not collect them at all.
Existing local count data also vary in quality. When designing a study,
consideration must be given to choosing sampling times and collecting enough
samples to account for daily, weekly, and seasonal variations, as well as for
random variations resulting from weather, special events, and other causes. If
counts are to be used to estimate traffic in a larger geographic area, a
representative sample of locations must also be sampled (U.S. DOT 2000, pg.
20).
The U.S. report notes that there is a strong need for comprehensive and systematic data on pedestrian and cycling activity. Such basic information does not exist in most areas, prompting the authors of the report to give the highest data collection priority to improving information on the number of pedestrians and cyclists by facility and geographic area. The report recommends that such data collection be structured to permit tracking of usage patterns on individual facilities, as well across an entire area (i.e. through the calculation of bicycle-miles of travel). The data should be collected on an on-going basis, such that usage patterns can be compared over time. The report further recommends that sampling methodologies for collecting pedestrian and cycling-related data be developed and disseminated to improve data quality. Such methodologies would address the ideal temporal and spatial coverage of counts necessary to develop a systematic bicycle and pedestrian traffic monitoring program. This implies that such a methodology does not currently exist, and that the work being carried out as part of the current investigation for the City of Ottawa represents a relatively new endeavor in North America.
Although no specific guidance on monitoring pedestrian and cycling activity in North America could be found, the U.K. Department of the Environment, Transport and the Regions (DETR) has published two traffic advisory leaflets entitled: Monitoring Local Cycle Use (1999) and Monitoring Walking (2000). These leaflets are intended to assist local agencies in monitoring walking and cycling targets, and provide valuable information on how to conduct traffic counts and surveys. A copy of the documents can be found in Appendix A.
In terms of pedestrian activity, the U.K. guidelines highlight the difficulty in accurately monitoring walking trends:
Accurately monitoring the overall level of pedestrian activity at the
local level can be difficult and expensive. It will usually be better to
undertake selective monitoring of key destinations and journeys, particularly
those involved in schemes to promote walking such as safer routes to schools
(U.K. DETR 2000, pg. 4).
This may explain why many urban areas have traditionally focused on monitoring cycling activity, with little emphasis on pedestrians.
As part of the literature review, a number of Cycling Plans and other documents were obtained from the internet describing current monitoring techniques in cities across North America and Europe. A number of these cities were contacted for further information; the results of the literature review and phone surveys for these specific cities are described in the following section.
3.2 Telephone Interviews
To complement the findings from the literature review, a number of cities were contacted for information regarding the process they currently use to monitor pedestrian and cycling activity. The cities were selected based on their perceived pro-activeness in encouraging pedestrian and cycling activity, findings from the literature review, and suggestions from City of Ottawa staff. The cities contacted include:
· Toronto, Ontario
· Vancouver, British Columbia
· Calgary, Alberta
· Halifax, Nova Scotia
· Windsor, Ontario
· Waterloo, Ontario
· Helsinki, Finland (contacted via e-mail)
· Portland, Oregon (no response)
Results from the interviews can be found in Appendix B. General conclusions from the interview process can be summarized as follows:
Cycling Monitoring
· No cities were discovered which use traffic count data to establish cycling trends by community / district.
· From a monitoring perspective, the European and North American experience appears to be quite similar, with monitoring techniques employed in Helsinki, Finland comparable to those used in cities such as Toronto and Vancouver. [1]
· Monitoring activity is often limited to “before and after” studies, downtown cordon counts, or counts at a few heavily used cycling corridors. Little effort is made to monitor activity outside the downtown core unless special cycling facilities have been implemented.
Pedestrian Monitoring
· Few cities have attempted to monitor pedestrian activity. Calgary recently completed a major pedestrian study in the CBD. Although the data may be used to monitor pedestrian activity, this was not the primary objective of the study.
· Vancouver recently implemented a program to monitor pedestrian activity at midblock locations in commercial areas (mostly downtown). The information from this program will be used for monitoring pedestrian trends, however, the data is only applicable to the downtown area.
· Both Calgary and Vancouver conducted pedestrian travel surveys in conjunction with traffic counts to establish origin-destination patterns and gather attitudinal information on reasons for walking and the perceived quality of the walking environment.
· In Helsinki, Finland, an innovative counting approach was employed in 1989 involving the use of helicopters and video cameras to record pedestrians in the City’s central area. In conjunction with the video recordings, manual counts were carried out at approximately 40 locations to determine hourly variations in pedestrian activity. However, Helsinki has no regular monitoring program for pedestrians.
From the results of the literature review and phone surveys, it is evident that few North American cities have relevant experience in using traffic count data to monitor pedestrian and cycling trends by geographic area. Although there is a general desire to monitor pedestrian and cycling activity, in practice, few cities do so on a consistent basis due to a lack of data.
3.3 Existing Data Collection System
Given that the cost of monitoring pedestrian and cycling activity is a major consideration in the approach to be developed and given that lack of data was identified as a major impediment to monitoring pedestrian and cycling activity in other cities, a review of the existing data collection system at the City of Ottawa was considered to be imperative.
The City of Ottawa’s current data collection program relies primarily on two types of counts:
· Classification and Occupancy (C&O) counts
· Turning Movement (TM) counts
These manual counts may be supplemented by automatic traffic recorder (ATR) counts which are typically conducted in response to specific project needs.
3.3.1 Classification and Occupancy Counts
Classification and Occupancy counts are conducted at screenline[2] stations throughout the City of Ottawa. These manual counts record the number of vehicles and vehicle occupants crossing the screenline in the inbound and outbound direction, as well as the vehicle type. Pedestrians and cyclists are also recorded, allowing mode share estimates to be developed for the screenline in question.
Although screenlines near the downtown are counted on an annual basis, most screenlines are counted less frequently. In some cases, only a portion of a screenline is counted in a given year, limiting the City’s ability to compare screenline trends over time. Appendix C contains a summary of the screenline system, including the number of count stations that make up each screenline, and the number of stations that were counted at least once every two years between 1995 and 2001.
Classification and Occupancy counts are conducted during the summer months (May to August) and are generally 8 or 12 hours in duration, encompassing the morning, afternoon, and midday peak periods. Detailed anomaly fields are provided in the C&O database, allowing analysts to assess the reliability of the traffic count data. Although the database also contains a field for recording weather information, this field is empty for the majority of counts.
Figure 1 illustrates the screenline system for the City of Ottawa where C&O counts are conducted.
Figure 1 City of Ottawa Screenline System
3.3.2 Turning Movement Counts
Turning movement counts are manual traffic counts typically conducted at signalized intersections. The traffic volumes derived from such counts are used for a variety of purposes, including:
· Signal phasing and timing
· Traffic impact studies
· Transportation planning studies
As the name suggests, turning movement counts provide information on the number of vehicles heading left, right, or straight through an intersection by direction of approach. The number of pedestrians crossing each intersection leg is also recorded, as well as the number of cyclists entering the intersection from the north, east, south, and west. Although turning movement counts can be of any duration, most counts are conducted over an 8 hour period, capturing the morning, afternoon, and midday peak periods of travel demand (7:00 a.m. to 10:00 a.m., 11:30 a.m. to 1:30 p.m., 3:00 p.m. to 6:00 p.m.). Most counts take place during the summer months (May to August), between Monday and Friday. However, Saturday counts may be conducted as well, particularly in commercial districts. Likewise, evening counts may be requested, depending on specific project needs. By the same token, counts can also be scheduled in the fall and winter.
In general, each signalized intersection in the city is counted every two years. However, counts at certain intersections may be conducted on a more or less frequent basis as evident from the traffic count database. In addition to storing volume information, the traffic count database also indicates the duration of the count, the pavement condition (wet or dry), and anomalies such as accidents or construction activity that may have impacted the reliability of the data.
3.3.3 Traffic Count Data Limitations and Challenges
The development of robust, reliable indicators of pedestrian and cycling activity based on traffic count data collected by the City of Ottawa presents several challenges, as highlighted below:
· The pedestrian and cycling targets adopted in the Official Plan for the former Region of Ottawa-Carleton are based on the concept of modal share, which is calculated as a percentage of total person trips. In contrast, traffic count data provides a snap-shot of pedestrian and cycling activity at a given intersection, and provides no indication of the number of pedestrian and cycling trips as a percentage of total trips.
· The traffic count data that is collected on an annual basis has several limitations. Traffic counts are typically collected in all types of weather, yet walking and cycling activity are known to be weather-dependent. In addition, intersection counts only provide an indication of the number of pedestrians crossing each intersection approach. As a result, pedestrians crossing multiple approaches are counted more than once. There is also uncertainty in how cyclists are recorded in the count data, since some cyclists act more as vehicles, moving with the flow of traffic, while others act more as pedestrians, dismounting at crosswalks or travelling on the sidewalk.
· Traffic counts are generally conducted between May and August. However, school trips are not captured in July and August, and travel activity at this time can be influenced by family vacations and tourist travel.
· Traffic count data is highly sensitive to location. This is particularly important if traffic count data is used to capture changes in pedestrian activity, as pedestrians near transit stops, parking lots, and other similar locations are not representative of trips made solely by the walking mode.
· Factors influencing pedestrian and cycling activity are not always recorded in the traffic count database. For example, the C&O database contains a field for weather information which is largely empty. While road closures and traffic accidents are generally noted in the database, events on adjacent streets may not be noted. If a particular road is under construction, cyclists may switch to a parallel route, a shift which may not be evident to the traffic counter.
· The traffic count database for both Turning Movement and C&O counts only goes back as far as 1995. Limited data from earlier counts is available in an electronic format, but much of the data appears to be missing. As a result, it is difficult to analyze trends prior to 1995 without resorting to paper copies of the count data.
These traffic count issues and their impact on monitoring pedestrian and cycling activity are discussed in further detail in Chapter 4 and Chapter 5.
3.3.4 Attitudinal Surveys
The City of Ottawa recently commissioned a Transportation Behaviour Survey to investigate public attitudes towards different transportation mode choice options. The survey was administered to 1009 Ottawa residents, and is considered accurate within ± 3%, at a 95% confidence level. The survey was structured to gather information on:
· Commuter travel characteristics
· The factors influencing mode choice decisions
· General attitudes and concerns
It is anticipated that the survey will be repeated every 3 to 5 years. As a result, the survey can be used to track changes in commuter travel behaviour over time, as well as changes in public attitudes towards walking and cycling. However, the sample size is likely insufficient for disaggregating the results to specific areas of the city. Moreover, the survey does not capture trips made by individuals younger than 16, and excludes trip purposes such as shopping. Thus, while the survey will provide important insight into travel behaviour in the City of Ottawa, another method is required to monitor overall levels of pedestrian and cycling activity in different regions of the city. The development and application of such monitoring techniques is presented in the following chapters.
4. Development & Application of Cycling Activity Index
Traffic count data can be used to monitor cycling activity in different ways. Before and after studies focus on specific cycling facilities. Long-term monitoring stations along heavily-used cycling corridors can also be established to monitor trends. However, such monitoring techniques do not provide an indication of cycling behaviour on a regional or community level. An increase in cycling activity on one facility may not be indicative of cycling trends in the surrounding area, particularly if the increase is caused by existing cyclists shifting to a new travel route, with no increase in the overall number of cyclists.
Given the data collection system in place at the City of Ottawa, there is opportunity to monitor cycling activity on a community-wide basis, either:
· Within an area; or
· Into and out of an area.
Both approaches rely on traffic count data collected by the City of Ottawa. While the former uses data from isolated count stations, the latter is based on observed trends at cordons and screenlines. The following sections explore both monitoring approaches further.
4.1 Cordon Approach
One method that can be used to monitor cycling trends over a larger area involves the use of screenline data. By strategically combining adjacent screenlines, a cordon can be created around different areas of the city. Classification and occupancy counts conducted at screenline stations provide information on the total number of trips crossing the cordon by direction (inbound vs. outbound), time of day, and mode. Using this information, trends in cycling activity can be monitored over time.
According to the U.K. Department of the Environment, Transport and the Regions (DETR-1999), cordon and screenline counts “are probably the most practical way … to monitor cycling trends from one year to the next” (pg. 7). The main disadvantage of this approach is that cyclists may “leak through” the cordon using minor roads or footpaths, leading to underestimates of cycling activity and uncertainty in observed trends. However, this disadvantage can be mitigated by ensuring that all cycling routes across a given screenline are included in the count program. Since cycling trips tend to be several kilometers in length[3], it is likely that many cyclists will cross at least one screenline during their cycling journey (unlike pedestrian trips which are typically much shorter).
Canadian cities such as Vancouver and Toronto have used screenline data to monitor cycling activity across central area cordons. In Ottawa, the only screenlines that are counted every two years are located in the central area. As a result, the screenline approach is insufficient for monitoring cycling trends outside the downtown. However, within the downtown, the approach can yield important information regarding cycling trends, and can be useful in assessing the reliability of alternative methods for monitoring cycling activity on a zonal level.
To assess screenline trends in the central area, a number of queries were developed to extract the relevant data from the C&O count database. The queries were structured to minimize the use of count data with anomaly records where additional count data was available for a given two-year period. Cycling activity as measured over an 8-hour period[4] was used in the analysis, to increase the reliability of the data. Although it is recognized that cycling activity can be significant at times not surveyed in the 8-hour counts, the hours that are included correspond to the peak periods of vehicular travel demand, for which increases in cycling activity are particularly relevant from a travel demand management perspective. Figures 2 and 3 present cycling trends within the downtown as measured at key screenlines and cordons. For a summary of the corresponding traffic count volumes, refer to Appendix D.
Figure 2 Cycling Volumes at Screenlines and Cordons
* Includes inbound and outbound movements as measured over an 8-hour period
Figure 3 Normalized Cycling Volumes at Screenlines and Cordons
* Includes inbound and outbound movements as measured over an 8 hour period
In the above diagrams, the screenlines shown in Figure 1 have been combined to form two cordons:
· Central Area – Comprised of screenlines 35, 36, 37, 38 (38 count stations in total)
· Inner Area – Comprised of screenlines 3, 4, 19, 27, 28, 29, 32, 33 (25 count stations in total)[5]
The Inner Area cordon can be broken down into three segments, as follows:
· Ottawa River – Screenlines 3, 4 (4 count stations)
· Rideau River – Screenlines 19, 32, 33[6] (9 count stations)
· West Central – Screenlines 27, 28, 29 (12 count stations)
As shown in Figure 2, bicycle volumes appear to be declining across the Central and Inner Area cordons. When expressed in relation to motor vehicle traffic (refer to Figure 3), cycling activity over the Central Area cordon has dropped by 16% between 1994/1995 and 2000/2001. For the Inner Area cordon, the drop is even greater with an 18% decrease in activity over the same period.
4.2 Isolated Locations Approach
According to the U.K. Department of the Environment, Transport
and the Regions (DETR-1999), there are essentially two ways to monitor cycling
activity in a particular area. The first is to set up a system of cordons or
screenlines at which traffic counts are conducted on a regular basis, as
described in the previous section. An alternative to the screenline approach is
to select a random, or stratified random, sample of roads and off-street
cycling facilities. Traffic counts at each location are used to monitor
relative changes in activity, with the counts repeated at similar times each
year.[7]
Although the isolated locations approach offers several advantages, the U.K. DETR (1999) cautions that the main drawback of the approach is that “the uncertainty of year-by-year values could be so great as to mask all but the largest changes in cycling levels” (pg. 7). Such uncertainty can be reduced by increasing the sample size, and ensuring that a representative sample of locations is included in the monitoring program.
A similar approach to that described by the U.K. DETR was developed by the former Region of Ottawa-Carleton in 1998 to assess changes in cycling activity in different areas of the city. The methodology is relatively easy to apply using data from the City’s traffic count database. In essence, a cycling activity index is generated by summing the total volume of cyclists observed at key intersections within the area of interest. Using historical traffic count data, trends in cycling activity can be assessed by considering relative changes in the index over time.
The methodology developed by the former Region of Ottawa-Carleton was primarily intended to facilitate continuous long-term monitoring of cycling activity, and can also be used to assist in planning and decision-making involving targeted program development (cycling facilities, promotion, safety training). Although the methodology represents an important first step in creating pedestrian and cycling activity indicators that can be used by the City of Ottawa, the methodology was developed as part of a pilot project, and as such, its appropriateness has not been fully tested. Moreover, the cycling indices have not been updated since 1998, and there is a need to generate new indices for the years 1999/2000 and 2000/2001 to establish current trends.
Accordingly, the methodology identified by the former Region of Ottawa-Carleton was reviewed to assess its appropriateness for monitoring cycling activity. Where warranted, improvements to the methodology are proposed to enhance its usefulness and reliability. The applicability of the cycling index was tested using two areas of the city as examples. Specific aspects of the methodology that were investigated include:
· Development of a zone system for monitoring trends
· Criteria for selecting count stations
· Sample size estimation
· Query decision rules for manipulating count data
The following sections describe the findings from the review process and outline the proposed enhancements.
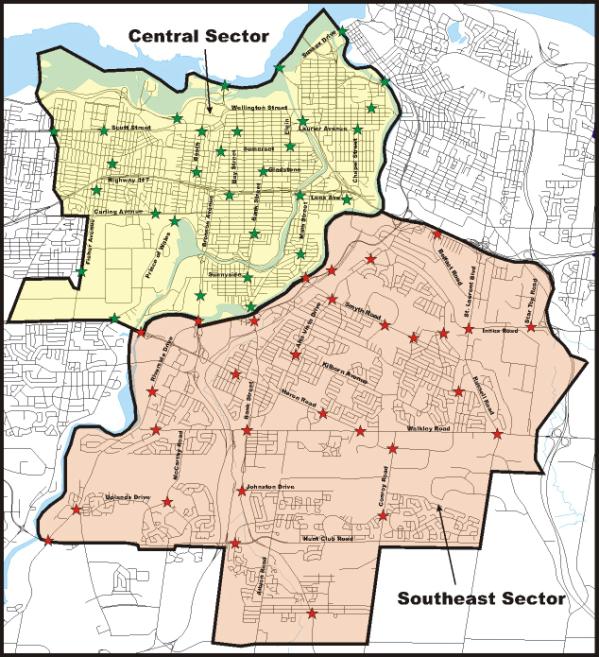
4.2.1 Investigation of 1998 Methodology
At the time it was developed, the RMOC methodology for monitoring cycling activity was applied to the Central and Southeast Sectors of Ottawa. As part of this work, 21 count locations in each sector were selected as representative sampling sites. An activity index was then calculated as the sum of the 8-hour cycling volumes at each count station. By normalizing the computed index against the sum of motorized vehicles observed during the same 8-hour period, changes in cycling activity relative to vehicle use could be determined.[8] Since turning movement counts are typically conducted at least once every two years at each signalized intersection within the city, the index was calculated using two-year increments, starting in 1990/1991.
To assess the appropriateness of the 1998 methodology, the traffic count data used to develop the cycling index was reviewed, as well as the process used to calculate the index. As part of this work, an attempt was made to update the cycling index based on the same assumptions applied in 1998. In this way, limitations and issues associated with the count data were revealed. General observations from this investigation include the following:
· The cycling activity index can be affected if traffic volumes at a particular intersection are impacted by poor weather, counting board malfunctions, road restrictions, etc. It is important to note that the impact of such anomalies can be large (i.e. at one intersection, volumes dropped from 292 to 98 in a one year period, likely due to rain. At another location, cycling volumes are consistently in the 100-200 range, then suddenly jump to nearly 800 for no apparent reason. This level of increase will significantly skew the index).
· Some intersections were not counted in either 2000 or 2001.
· The activity index for the Southeast Sector as previously developed includes at least one high volume intersection representing more than 15% of the index value. Anomalies in the count data for this intersection would significantly impact the index.
· In the 1998 analysis, 12 hr Classification and Occupancy (C&O) counts were converted to an 8-hour volume using incorrect factors. Moreover, 11 and 12 hour counts were included in the index even though the index is based on 8 hour volumes (at some intersections, an 8-hour volume was used for one time period, and a 12-hour volume was used for another).
· In many cases, an intersection is counted every year, and it is necessary to choose which count data to include in the index for a given two-year interval. It appears that in the previous work, the selection of count data was largely arbitrary. A better approach would be to eliminate any count data with anomalies, and apply an averaging technique if more than one data-set remains for the same time interval.
· Although different methods of manipulating the traffic count data were explored, the original approach of dividing the total volume of cyclists at selected intersections by the total volume of motor vehicles is believed to be the most appropriate for monitoring cycling trends.
It is understood that the City of Ottawa may have interest in developing a “grand index” that would essentially represent cycling activity across the entire city. Such aggregation is possible, but remains as a relative measure of activity over time. Since the aggregated index continues to rely on traffic count observations, it does not, and cannot, offer a means of comparison against city-wide mode share targets. Indeed, the ratio of cyclists to vehicles at a given set of intersections may be quite different from the percentage of trips made by the cycling mode, due to the location of cycling routes within the community, differences in cycling and vehicle trip lengths, and other influencing factors.
The following charts illustrate the updated cycling indices for the Central and Southeast Sectors, assuming no changes to the 1998 methodology. Although the specific trends observed are irrelevant for the purposes of evaluating the methodology, it is worth noting that cycling activity appears to be declining in the Central and Southeast Sectors, both in absolute terms and relative to motor vehicle volumes.
Figure 4 Update of 1998 Index – Absolute Activity
* Valid Intersections – excludes intersections with no count data for a particular time interval, as well as intersections representing over 15% of the total index
Figure 5 Update of 1998 Index – Normalized Values
* Valid Intersections – excludes intersections with no count data for a particular time interval, as well as intersections representing over 15% of the total index
Although the cycling activity index as developed in 1998 provides insight into cycling trends, a number of refinements are required to improve the reliability. Specific improvements that are addressed in the following sections include:
· Establishment of specific criteria for selecting zone boundaries and count locations to include in the index
· Exclusion of high volume intersections from the cycling index to ensure the index is not unduly influenced by one count location
· Querying the traffic count database directly to develop 8-hour volumes from 15-minute count intervals, so that conversion factors need not be applied
· Development of query “decision rules” to provide a consistent means of selecting count data in situations where multiple counts were conducted over a given two year period. Such rules help to minimize the use of count data that may have been impacted by poor weather, road closures, etc.
· Development of rules to handle missing data
Based on these identified improvements, new cycling indices were developed for the Central and Southeast Sectors, and are presented in Section 4.2.7.
4.2.2 Establishment of Zone Boundaries
One of the first steps in developing a system to monitor cycling activity in different areas of the city is to define the zones which will be monitored. The following principles were applied in developing the zone boundaries for monitoring cycling activity:
· Zones should loosely correspond with existing Ottawa communities to:
- Ensure the zones are readily identifiable
- Facilitate monitoring of specific community programs
· Zones should be sufficiently large to ensure an adequate sampling size for determining trends
· Zones should be made up of contiguous areas (i.e. areas that are geographically adjacent to each other)
· Zones should have similar land use intensity and travel characteristics (i.e. a downtown community should not be lumped together with an adjacent suburban community)
· May be beneficial if zone boundaries correspond with other zone systems used by the City of Ottawa (i.e. traffic zone system for modelling travel behaviour, ward system, etc.)
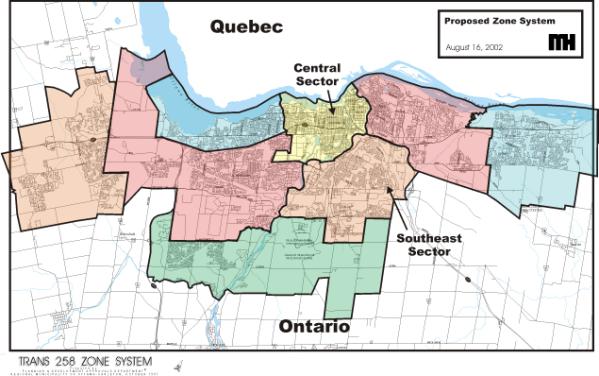
Figure 6 illustrates the zone system that was developed for monitoring cycling activity. The zone boundaries correspond to the traffic zone system for the National Capital Region which is used for modelling travel demand. As a result, employment and population estimates can be readily developed for each cycling zone, allowing cycling volumes to be normalized against population and employment growth if desired. As Figure 6 shows, 8 cycling zones are proposed, each with unique travel and land use characteristics.
For the purposes of developing the cycling methodology, two areas of the city were selected for analysis, consistent with the areas previously investigated as part of the 1998 work:
· The Southeast Sector (located south / west of Highway 417, east of the Rideau River, and north of Hunt Club Road [including the Blossom Park Community south of Hunt Club Road])
· The Central Sector (located south of the Ottawa River, north / west of the Rideau River, and east of Island Park Drive / Fisher Avenue)
4.2.3 Selection of Key Locations to be Monitored
The selection of count stations to include in the cycling activity index should take into account the unique travel and land use characteristics of the zone in question. In general, intersections should be representative of cycling conditions within the zone, and should be geographically distributed to ensure all areas with cycling activity are reflected in the index. More specifically, the following selection criteria are proposed:
· Count stations should be located on preferred cycling routes, and should exclude locations that cyclists typically avoid
· Count stations should have at least 20 cyclists over an 8-hour period, with no significant increase in cycling activity expected in the future
· Count stations should not represent more than 15% of the total cycling activity captured in the index (the cycling activity at such locations can be included in the index by selecting adjacent intersections which provide access to the cycling route in question)
· Count stations should only be selected from the same corridor if spaced sufficiently far apart that “double-counting” of cyclists is minimized
· Count stations can be shared between two zones if they fall on a zone boundary
· Count stations must be included in the City of Ottawa’s traffic count program, and be counted at least once every two years
· If a count station is not counted in a given two-year period, interpolation can be used to estimate the missing data
Ideally, some of the intersections included in the cycling index should be located inside residential communities to capture short duration trips on local and collector roads (i.e. school trips). In practice, this will be difficult to achieve given that most signalized intersections at which traffic counts are conducted are located outside residential neighbourhoods. This limitation in the cycling index should not unduly impact observed trends in cycling activity, particularly since cycling trips in the City of Ottawa have an average length of 3 km according the 1995 Origin-Destination Survey, implying that the average cycling trip extends outside the residential community where it may have originated.
4.2.4 Sample Size
The ability of short-duration counts to reliably estimate long-term cycling trends depends on many factors, as summarized by the U.K. DETR (1999):
· The accuracy of the counters;
· The length of the count period (the longer, the better);
· The size of the flows (the bigger, the better); and
· The day to day variability of the flows.
Traffic flows can vary substantially due to weather conditions, road closures, construction activity, traffic accidents, and special events. While an effort can be made to limit the use of traffic count data impacted by such anomalies, traffic volumes will always show some day to day variation due to the complexities of human behaviour. To accurately detect changes in cycling activity, a sufficient number of representative sampling sites must be incorporated in the cycling index.
The U.K. DETR provides information on the number of traffic counts required to detect a given change in cycling activity at the 90% confidence level. The information is based on national cycling count data for the United Kingdom. As Table 2 illustrates, the number of counts depends on the bicycle volume: the greater the volume, the fewer the counts required to detect a given change in activity. For example, to detect an annual change of 20% with 90% confidence, at least 29 counts must be carried out every year if the flow is less than 100 cyclists. However, for a flow exceeding 250 cyclists, only 7 counts are required.
Table 2 Number of Cycling Counts Needed to Detect Changes in Cycling Flow
|
Bicycle Volume |
Number
of Counts Required to Measure a Change of… |
|||
|
10% |
20% |
30% |
40% |
|
|
250+ |
29 |
7 |
4 |
2 |
|
100-250 |
-- |
13 |
6 |
4 |
|
10-100 |
-- |
29 |
14 |
8 |
* 90%
Confidence Level (Source: U.K. DETR 1999)
Table 2 provides information on the number of traffic counts required at a particular location to measure a given change in cycling activity. However, the cycling index that was developed as part of the present investigation is based on single traffic counts carried out at multiple locations. Although the application is not directly comparable, the data in Table 2 provides a rough indication of the number of sampling sites that are needed to develop a reliable cycling index.
For the purposes of monitoring Official Plan targets, trends are monitored over multiple years, and there is less need for statistical confidence between any two time periods, implying that the sample size can be reduced. For the Southeast Sector, the intersections that were ultimately included in the cycling index had an average 8-hour volume ranging from 140 to 180. For the Central Sector, the average volume ranged from 400 to 550. As a result, 30 count locations should be adequate for measuring a 10% change in cycling activity in the Central Sector between any two time periods. For the Southeast Sector, a larger sample size would be required due to the lower cycling volumes that are observed. However, in a relative context, the confidence level is less of an issue. This is especially true when anomalies in the index trend are “smoothed out” over time.
To further assess the required sample size, the Southeast Sector was selected as a case study. All turning movement volumes associated with intersections in the Southeast Sector were extracted from the traffic count database for 1995 to 2001. Queries were developed to summarize the data; counts undertaken in dry conditions with no road closures or other anomalies were used wherever possible. Intersections with no count data for more than one two year period were removed from the data-set, while interpolation was used to estimate missing volumes at all other intersections. The remaining data-set (comprised of 113 intersections) was used to test a number of sample size scenarios. Of interest was how different sample sizes influenced the relative change in the index over time.
Using the 113 intersections for the Southeast Sector, a set number of intersections was randomly selected and used to compute values of the cycling index between 1994/1995 and 2000/2001. This process was repeated for a number of different sample sizes, allowing a relationship to be established between the number of intersections included in the index and the reliability of the results as measured by the stability/consistency of the index trend. The results of this analysis suggest that a sample size of approximately 50 would be appropriate for the Southeast Sector, assuming a completely random selection of intersections.
Fortunately, the sample size can be reduced significantly by carefully selecting intersections that are believed to be representative of cycling conditions with the zone. As Table 3 and Figure 7 illustrate, a sample size of 30 provides a reasonably reliable estimate of cycling trends over time. With 113 sites, the ratio of cyclists to vehicles drops by 26% over the analysis timeframe. With 30 sites, the drop is 22%, a difference of only 4%. It is important to emphasize, however, that the change in cycling activity between any two time periods will be less accurate than trends obtained over a longer timeframe.
Table 3 Sample Size Determination – Southeast Sector
* TM = Turning Movement Counts, C&O =
Classification and Occupancy Counts
Figure 7 Sample Size Estimation – Southeast Sector
Based on the aforementioned, a sample size of 30 count locations is believed to be adequate for tracking cycling trends over time. For zones that do not have a sufficient sample size, there are a number of options for proceeding:
· The zones could be excluded from the monitoring program until sample size requirements are met.
· The cycling activity index could be calculated using a smaller sample size, recognizing that the reliability of the index will be affected. If zones with fewer than 30 sampling sites are included in the monitoring program, the results of the trend analysis must be interpreted with caution.
· To increase the reliability of the index in the short-term, it may be desirable to create a “temporary” index which includes all of the available count data for a particular zone. Despite the potential to “double-count” cyclists, the greater sample size will reduce day-to-day variability in traffic volumes, increasing the reliability of the index. Once a zone has developed sufficiently, a new “permanent” index should be created, with an appropriate selection of count stations.
Of course, a preferable solution would be to increase the sample size by including a number of non-signalized intersections in the City’s traffic count program. The cost implications of so-doing should be assessed against the value of obtaining reliable estimates of cycling activity in outlying communities with insufficient count stations. It is also worth noting that the zone boundaries as currently defined are somewhat flexible, and could be modified once the cycling methodology is expanded to other areas of the city should sample size concerns arise. Combining two zones might also resolve the issue.
It is expected that most zones will have at least 30 count stations that could be used for monitoring cycling activity. The risk lies in outlying suburban / rural zones that are still experiencing rapid development, such as the southern-most zone which encompasses the communities of Riverside South and Barhaven. The development of a look-up table for the traffic count database which allows intersections be queried by location would help in identifying the number of count stations per zone. This information could then be used to assess which zones may have an insufficient number of count stations for reliably monitoring cycling activity.
4.2.5 Intersections Selected for Inclusion in Cycling Index
Based on the selection criteria outlined in Section 4.2.3, 30 count locations were selected for inclusion in the cycling activity index for the Central and Southeast Sectors. As discussed in Section 4.2.4, a sample size of 30 count locations was considered to be appropriate for tracking long-term cycling trends.
In selecting the count locations, comments from the Cycling Advisory Committee were taken into account. A meeting with the Cycling Advisory Committee was held on July 8, 2002 to discuss the proposed methodology and solicit feedback.[9] Further comments and suggestions were received via e-mail. In some cases, a suggested count location could not be used due to insufficient data (e.g. the unsignalized intersection at Bay & Somerset, which is not included in the annual traffic count program). In such situations, an adjacent count station was selected with similar characteristics.
The intersections that were chosen for developing the cycling indices for the Central and Southeast Sectors are shown in Table 4 and illustrated graphically in Figure 8.
Table 4 Summary of Selected Intersections
|
Southeast Sector |
Central Sector |
|
Intersections in
Previous Index Maintained in Current Index ·
Bridle Path Drive
& Hunt Club Road ·
Hunt Club Road &
Riverside Drive · Conroy Road & Lorry Greenberg Drive ·
McCarthy Road &
Paul Anka Drive ·
Bank Street &
Johnston Drive ·
Heron Road &
Walkley Road ·
Ridgewood Avenue &
Riverside Drive ·
Clementine Boulevard
& Heron Road ·
Heron Bridge
(Screenline 20) ·
Alta Vista Drive &
Kilborn Avenue ·
Pleasant Park Road
& St. Laurent Blvd. ·
Haig Drive &
Russell Road ·
Lynda Lane & Smyth
Road ·
Star Top Road &
Innes Road ·
Alta Vista Drive &
Dorion Avenue ·
Belfast Road &
Tremblay Road ·
Dunbar Bridge (Screenline
19) ·
Smyth Bridge
(Screenline 19) New Intersections Added to Index ·
Alta Vista Drive &
Smyth Road ·
Bank Street &
Queensdale Avenue ·
Bank Street &
Riverside Drive South ·
Bank Street &
Walkley Road ·
Smyth Road &
Botsford Street ·
Conroy Road & St.
Laurent Blvd. ·
Riverside Drive &
Frobisher Lane ·
Heron Road &
Sandalwood Drive ·
Innes Road & St.
Laurent Blvd. ·
Riverside Drive &
Uplands Drive ·
Russell Road &
Walkley Road ·
Walkley Road &
Springland Drive Intersections in
Previous Index Deleted from Current Index ·
Bank Street and
Riverside Drive North1 ·
Hawthorne Road and
Stevenage Drive2 ·
Hurdman Bridge
(Screenline 32)3 |
Intersections in
Previous Index Maintained in Current Index ·
Bank Street &
Riverdale Avenue ·
Brewer Road &
Bronson Avenue ·
Fisher Avenue &
Trent Street ·
Main Street &
Riverdale Avenue ·
Bank Street &
Fifth Avenue ·
Preston Street &
Prince of Wales Drive ·
Carling Avenue &
Sherwood Drive ·
Chamberlain Avenue
& Percy Street ·
Colonel By Drive &
Hawthorne Avenue ·
Bank Street &
Gladstone Avenue ·
Gladstone Avenue &
Parkdale Avenue ·
Albert Street &
Booth Street ·
Bike Path (Screenline
29) ·
Mackenzie Bridge &
Nat’l Defense H. Q. ·
Cobourg Street &
Rideau Street ·
Island Park Drive
& Scott Street ·
Portage Bridge
(Screenline 3) ·
Alexandria Bridge
(Screenline 4) ·
St. Patrick Bridge (Screenline
33) ·
East Bytown Bridge
(Screenline 33) New Intersections Added to Index ·
Lees Avenue &
Algonquin College ·
Prince of Wales &
Baseline Road ·
Elgin Street &
Cooper Street ·
Booth Street &
Gladstone Avenue ·
Holland Avenue &
Kenilworth Street ·
Bay Street &
Laurier Avenue ·
Chapel Street &
Laurier Avenue ·
Holland Avenue &
Scott Street ·
Bronson Avenue &
Somerset Avenue ·
Bank Street &
Sunnyside Avenue Intersections in
Previous Index Deleted from Current Index ·
Hurdman Bridge
(Screenline 32)3 |
1 Cyclist volume exceeds 15% of index total
2 Cyclist volume less than 20
3 Freeway travel may not be representative of vehicle
activity within the zone
Figure 8 Proposed Count Stations to Include in Cycling Index
4.2.6 Calculating the Index
As noted in Section 4.2.1, a number of inconsistencies were discovered in the way the cycling activity index was calculated in the previous 1998 work. To ensure consistency in how the cycling index is calculated, both now and in the future, query “decision rules” were established. These rules will assist in automating the calculation process and provide a means to ensure the index is updated in a similar manner each time. Table 5 provides a summary of the key rules that were applied in extracting the count data from the database and developing the cycling indices. The various queries used in the analysis can be found in Appendix E.[10]
Table 5 Query “Decision Rules”
|
Data Availability |
Decision Rule |
|
No traffic count data is available for a given two-year period |
Use interpolation to fill in the missing data, based on traffic counts from other years |
|
Only one traffic count is available for a given two-year period |
Use the data with no adjustment |
|
Two or more traffic counts are available for a given two-year period |
· If all traffic counts take place in dry weather and have no road closures or anomaly records _ Use the average 8-hour volume · If some traffic counts take place in dry weather and have no road closures or anomaly records, while others take place in rainy weather, and/or involve road closures _ Use the average 8-hour volume from counts undertaken in dry weather, with no road closures / anomaly records · If all traffic counts take place in rainy weather, and/or involve road closures or other anomalies _ Use the average 8-hour volume |
These “decision rules” minimize the impact of traffic counts that may be impacted by wet weather, road closures, etc., recognizing that it is not necessary (or possible) to perfectly correct for all anomalies. Since we are only interested in trends over an extended period of time, and count anomalies generally “self-correct” over time (i.e. by using trendlines to smooth the data), no further adjustments are believed to be warranted.
In situations where a zone is experiencing rapid new development, it should be possible to add new intersections to the index as they are added to the traffic count program, if the intersections are considered important from a cycling perspective.
· The cycling index tracks changes in cycling activity over time. As new development occurs, we would expect cycling activity in the zone to increase, and our index should reflect this.
· Initial cycling volumes at a newly signalized intersection are likely to be low, and will have a gradual impact on the index over time as the intersection grows in importance.
· The addition of a newly signalized intersection to the activity index will likely cause the absolute number of cyclists to increase by a small amount. At the same time, the normalized index may decrease, since, in relation to vehicle activity, the level of cycling activity at a newly signalized intersection is expected to be lower than that of the surrounding area where development has stabilized.
4.2.7 Index Trends
The following charts illustrate the proposed cycling activity index for the Central and Southeast Sectors. Appendix D contains a summary of the corresponding traffic count data.
Figure 9 Cycling Activity Index – Absolute Cycling Volumes
Figure 10 Cycling Activity Index – Normalized Cycling Volumes
As the above figures show, cycling activity appears to be declining in both the Central and Southeast Sectors. In relation to motor vehicle traffic (refer to Figure 10), cycling activity in the Southeast Sector has declined by approximately 22% between 1994/1995 and 2000/2001. In the Central Sector, a 25% drop in activity has been experienced over the same period.
4.3 Comparison of “Cordon” and “Isolated Locations” Approaches
The cycling activity index based on isolated count locations and the cordon approach are both valid means of monitoring cycling activity. Each approach has unique advantages and disadvantages which influence their usefulness for monitoring applications. The key differences between the two approaches are presented in Table 6.
Table 6 Differences Between the Cordon Approach and Cycling Activity Index
|
Cordon
Approach |
Cycling Activity Index |
|
· Screenline counts capture cycling trips into and out of an area, but do not capture trips made entirely within the area · Since vehicle occupancy data is collected during screenline counts, mode share estimates across the screenline can be calculated, if desired · Screenlines outside the Inner Area are not necessarily counted every two years, limiting the applicability of the cordon approach to the downtown · Screenline location cannot be altered to better capture cycling activity |
· By strategically selecting count locations, the cycling activity index captures cycling trips into and out of an area, as well as trips made entirely with the area · Based on count stations that are counted at least once every two years · Can be applied to any area of the city · Can potentially create a city-wide cycling activity index by combining data from individual zones · Monitoring zones can be modified with no change to the traffic count program (flexible) |
As noted previously, the cordon approach can only be applied in the central area of Ottawa due to limitations with the frequency of data collection at count stations outside the downtown. A comparison of cycling trends in the central area using the cordon approach (Figure 3) versus the cycling activity index (Figure 10) reveals the following:
· Both approaches show a general trend towards decreasing cycling activity.
· In terms of the ratio of cyclists to vehicles, the Central and Inner Area cordons show a 16% and 18% respective drop in cycling activity between 1994/1995 and 2000/2001. In contrast, the cycling activity index for the Central Sector shows a 25% drop over the same time period.
The observed drop in cycling activity may be attributed to many factors. Although it is beyond the scope of the present investigation to identify such factors, a relevant discussion is presented in Section 6.3 regarding some of the key physical and non-physical features of the cycling environment that should be considered when investigating changes in modal share.
While both the cordon approach and the isolated locations approach show a drop in cycling activity in central Ottawa, the two approaches differ in their estimate of the magnitude of the observed drop. The difference in cycling trends between the two analytical techniques may be a reflection of:
· The reliability of one approach in relation to the other
· The nature of the cyclists captured with each approach
With regards to the former, the sample size for the Central and Inner Area cordons is 38 and 25 respectively, while the cycling activity index is based on a sample size of 30. Consequently, the results from both approaches are believed to be reasonably reliable. The difference in observed trends may instead be a reflection of the different cycling trips captured with the two approaches. Unlike the cycling activity index associated with the isolated locations approach, the Central and Inner Area cordons only capture trips with either an origin or destination outside the downtown area defined by the cordon. In contrast, the cycling activity index captures all trips passing through a given location, regardless of the point of origin or destination. Therefore, to the extent that trips occurring entirely within the cordon boundary differ from those crossing the boundary, the observed results will be different.
It is worth noting that an effort was made to investigate the implications of revising the zone boundary for the Central Sector to more closely correspond with the Inner Area cordon. This was accomplished by shifting the Island Park Drive / Fisher Avenue boundary eastward to line up with the CP rail corridor that defines part of the Inner Area cordon. The net effect of this shift on the cycling activity index was minor: Instead of a 25% drop in cycling activity between 1994/1995 and 2000/2001, the revised zone boundary results in a drop of 23%.[11] As a result, no change in the zone boundary for the Central Sector is believed to be warranted. However, should the City of Ottawa find value in modifying the boundary to more closely correspond to the Inner Area cordon, such a modification could be easily undertaken without impacting the integrity of the index (as long as a sample size of 30 count locations was maintained).
For the Central Sector, both the cordon approach and the cycling activity index provide valuable information on cycling trends. Since both approaches can be readily applied using available traffic count data, it is recommended that cycling trends in the Central Sector be monitored using both the screenline approach, as well as the cycling activity index. Cycling activity is typically higher in the downtown than other areas of the city, and there is considerable merit in ensuring all available data is used to monitor trends.
4.4 Implications and Recommendations
A number of recommendations can be made regarding the development of a methodology to monitor cycling activity in the City of Ottawa on an area-wide basis. These recommendations can be divided into the following two categories:
· Data collection & coding
· Recommended monitoring approach
4.4.1 Data Collection & Coding
The City of Ottawa’s traffic
count program was originally designed to provide information on motor vehicle
travel for use in determining traffic signal timing and roadway capacity
requirements. However, there is no reason to believe that cyclist counts
undertaken at the same time are unreliable, or do not capture cycling activity
at a given intersection. The bicycle count data that is currently collected as
part of the City’s annual traffic count program is believed to be appropriate
for monitoring cycling trends on an area-wide basis. Given the costs and
limited extent of benefits associated with further expansion of the bicycle
count program, such expansion is deemed to have little merit at the present
time.
Notwithstanding the above, two recommendations are believed to be particularly relevant in terms of enhancing data collection and coding efforts:
· The weather field should be consistently filled in when downloading the results from C&O counts.
· A “look-up” table should be developed for the turning movement database which provides information on the area of the city where each count station is located. A look-up table is a table that can be used by the database to “look up” information about a particular database entity. This information can then be used to develop queries and link tables together.
Currently, each intersection in the turning movement database is given a unique identifier, but the identifier provides no information on the geographic location of the intersection. As a result, it is impossible to develop queries which analyze intersections within a given area. It is likewise impossible to establish trends on a zone-by-zone basis without manually selecting intersections, a time-consuming process. A look-up table would solve this problem, allowing intersections to be analyzed according to location.
In the look-up table, the intersection location could be defined by ward, traffic zone, census zone, or some other zone system that is expected to be relevant in the future. The zone system that is ultimately selected should support the wide range of applications for which the count data may be used. For this reason, it is not recommended that the intersections be tagged according the cycling zone in which they are located, since these zones may not be appropriate for other applications. Instead, a more general zone system should be selected. It would then be a relatively simple matter to create a second look-up table which relates the general zone system with the zones used to monitor cycling activity.
It is also recommended that all intersections selected for inclusion in the cycling activity index be placed on a “priority list” to ensure the intersections are counted at least once every two years. Ideally, intersections included in the cycling index would be counted in May or June instead of July or August to ensure school trips are captured in the index and to reduce the influence of family vacations and tourist travel. However, doing so may impact the index trend in the short-term, as the index self-adjusts to reflect travel only in May and June. If a decision is made in favour of the above suggestion and there is a move towards counting “priority” intersections before the start of summer holidays, the query decision rules in Section 4.2.6 should be updated accordingly, such that May/June counts are given priority in situations where multiple counts are available for the same two-year period.[12] The only exception to this rule would occur if the May/June count was impacted by poor weather or road construction, and the July/August count was not, in which case the July/August count should be used in formulating the index.
4.4.2 Recommended Monitoring Approach
From our investigation, the cycling activity index is believed to be a reliable method for monitoring cycling activity in the City of Ottawa on a zone-by-zone basis. The index was calculated for the Central and Southeast Sectors of Ottawa, and should be expanded to other monitoring zones (as defined in Section 4.2.2) according to the following process:
1. Select approximately 30 count stations within the monitoring zone in question using the selection criteria in Section 4.2.3.
2. For each two-year interval, compute the total volume of cyclists observed over an 8-hour period (7:00 a.m. to 10:00 a.m., 11:30 a.m. to 1:30 p.m., 3:00 p.m. to 6:00 p.m.) at each intersection using the query decision rules outlined in Section 4.2.6. Sum the results to determine the absolute change in cycling activity.
3. Likewise, compute the total volume of motor vehicles observed over the same time interval. Sum the results.
4. Divide the total volume of cyclists by the total volume of vehicles and multiply by 100 to determine the number of cyclists per 100 vehicles (normalized index).
Given the current frequency of data collection, it is recommended that the index be computed using two-year intervals. It is also important to normalize the index to assess changes in cycling activity relative to motor vehicle activity. Once the index has been developed for a particular zone, it is important that it be updated on a regular basis to ensure cycling policies and programs are bringing about the desired changes in travel behaviour.
For the Central Sector, it is further recommended that cycling activity be monitored using the cordon approach in addition to the cycling activity index. Both approaches yield important insight into cycling trends in the downtown and can be readily calculated using traffic count data that is regularly collected.
While the cordon approach could be expanded to other zones by recommending that screenline counts outside the Central Sector be conducted more frequently, this is not believed to be warranted. The cycling activity index will provide a reliable indication of cycling trends in these areas, and it is not necessary to incur the expense of collecting additional data. Moreover, the screenlines and cordons outside the Central Sector are less well situated for monitoring cycling activity on a zonal basis, limiting their ability to provide insight into cycling trends.
5. Development & Application of Pedestrian Activity Index
5.1 Differences Between Bicycle and Pedestrian Travel
Although walking and cycling are both non-motorized modes of travel, there are significant differences between the two modes. The U.S. Federal Highway Administration’s Guidebook on Methods to Estimate Non-Motorized Travel (Schwartz et al. 1999) summarizes these differences as follows:
· Pedestrian trips are generally shorter than bicycle trips. As a result, the most appropriate analysis method for cycling trips may not be appropriate for walking trips due to the spatial scale of activity. For example, an analysis of pedestrian conditions may consider every block in a small area, while an analysis of bicycle conditions may focus on through bicycle routes. A relatively small number of monitoring stations may capture the majority of cycling trips within an area; the same is not true for pedestrian trips.
· A large percentage of pedestrian trips are actually trips to access other modes, including the automobile or transit. Bicycle trips, in contrast, are primarily stand-alone trips (although bicycle access to transit is an important type of non-motorized travel).
· The decision to ride a bicycle involves a greater conceptual leap than the decision to walk. Everyone is a pedestrian, but not everyone is a cyclist. Public health and social marketing research suggests that the decision to even consider riding a bicycle is a multi-staged process involving a variety of interacting personal, social, and environmental factors. The choice to bicycle for a particular trip depends not only on the specific characteristics of that trip but on the individual’s attitude toward and willingness to bicycle.
The U.K. Department of the Environment, Transport and the Regions (DETR-2000) also notes that since most pedestrian trips are for utility reasons, the number of such trips remains relatively constant throughout the year, unlike cycling trips which show more seasonal variation. Likewise, daily pedestrian flows are affected by weather to a greater extent than motor vehicles, but to a lesser extent than cyclists. Care must be taken when transferring such observations to Ottawa however, given the climatic differences between the United Kingdom and Canada.
5.2 Methods to Monitor Pedestrian Activity
The U.K. DETR (2000) presents a number of options for monitoring pedestrian trips, as illustrated in Table 7.
Table 7 Methods to Monitor Pedestrian Activity
|
Basic Method |
Techniques |
Survey
Location |
|
Interviews / Questionnaires |
Origin-Destination Interview |
Destination Cordon / Screenline Principal Routes Random Points |
|
Household Survey |
Home |
|
|
Travel Diary |
Home / School / Workplace |
|
|
Traffic Counts |
Manual |
Destination Cordon / Screenline Principal Routes Random Points |
|
Semi-automatic |
||
|
Fully Automatic |
Modified from U.K. DETR
(2000, pg. 2-3)
According to the U.K. DETR, origin-destination surveys at key destinations may be the most cost-effective and useful monitoring method. Surveys at town centres, workplaces, schools, hospitals, and shops can provide valuable information on walking, and can be used to undertake long-term monitoring of walking activity by comparing survey results to baseline conditions. As part of this monitoring technique, schools and employers could be requested to administer simple surveys on travel behaviour and report the results to the City of Ottawa. This approach is likely to be most successful at employers participating in travel demand management (TDM) programs to reduce vehicular travel.
In terms of using traffic count data to monitor pedestrian trends, the U.K. DETR recommends that counts be conducted at sites with high level of walking activity. Such sites tend to offer consistent results which can be used to establish walking trends. Since walk trips tend to be short, the level of walking activity can vary considerably from one street to the next. As a result, the appropriate choice of survey sites is important. In this respect, cordon and screenline counts offer particular advantage: not only do such counts provides estimates of modal split, but the aggregate count across a cordon or screenline is more reliable than individual counts. However, the location of cordons and screenlines may need to be modified to be adequately capture pedestrian activity.
5.3 Limitations of Observed Pedestrian Counts
The City of Ottawa currently collects pedestrian data as part of their traffic count program. Consequently, there is a desire to develop a methodology to monitor pedestrian activity using the traffic count data that is already available. As alluded to above, there are numerous issues associated with monitoring pedestrian activity based on observed pedestrian counts:
· It is impossible to distinguish between “primary” and “secondary” walking trips (i.e. trips where walking is the primary mode versus trips where walking is used to access a second transportation mode such as public transit).
· Pedestrian counts are highly sensitive to the location of transit stops, parking areas, etc.
· A pedestrian crossing multiple legs of an intersection will be counted more than once in the turning movement count.
· Pedestrian counts vary according to season. In general, pedestrian data from May and June is preferable to data from July and August, since summer counts typically exclude school trips and travel by vacationing families, and can be impacted by tourism activity. Since turning movement counts are conducted between May and August, the pedestrian volumes at an intersection can change from one year to the next simply due to changes in the count date.
According to the U.K. DETR (2000), pedestrian counts also suffer from significant day to day variability:
Pedestrian flows at any one location are likely to show more variety
from day to day than flows of motor vehicles. One-day counts may provide a
useful impression, but are unlikely to form a statistically reliable basis for
regular monitoring (pg. 5).
The primary purpose of developing a pedestrian activity index is to assess the City of Ottawa’s progress towards achieving pedestrian mode share targets. The development of a methodology to monitor pedestrian activity must therefore reflect this goal; while there may be some insight to be gained from monitoring changes in the overall level of walking activity, such information provides no indication of whether the City has been effective in increasing the number of primary pedestrian trips in accordance with mode share objectives.
As a result, traffic count data used to establish pedestrian trends should be “uncontaminated” with pedestrian trips to transit stops or vehicle parking lots, and should instead reflect only those trips made solely by the walking mode. A number of options for monitoring pedestrian activity using traffic count data were explored. These options, presented in the Table below, each suffer from the fundamental issues outlined above.
Table 8 Options Explored Related to Traffic Counts
|
Options |
Issues |
|
1. Use the same approach as that applied in the cycling index |
· Fundamental issues described above limit the applicability of this option. Such issues include the difficulty in distinguishing between primary and secondary pedestrian trips, as well as the sensitivity of pedestrian data to the count location and time of year · Appropriateness of zone boundaries and intersection locations |
|
2. Monitor signalized intersections with high pedestrian volumes |
· Fundamental issues described above limit the applicability of this option |
|
3. Monitor signalized intersections near major generators |
· Fundamental issues described above limit the applicability of this option · Which generators to include? Current thinking suggests that schools and community malls might be good targets · Effect of changes in bus stops, off-street parking, and land use can be significant over time |
|
4. Measure volumes at pedestrian generators |
· Fundamental issues described above limit the applicability of this option · Data may not exist and could therefore present a cost to the City for data collection · Which generators to include? Current thinking suggests that schools and community malls might be good targets |
As regards Option 1, an attempt was made to analyze pedestrian activity in the Southeast Sector using an approach similar to the cycling methodology. However, it is important to emphasize that the results of this analysis suffer from the fundamental issues described above, and as such, offer little value in terms of monitoring progress towards Official Plan mode share targets. Thus, while the data in Figure 11 suggests that pedestrian activity in the Southeast Sector may be increasing, it is impossible to conclude whether this increase can be attributed to more trips made solely by the walking mode, greater transit usage, or greater vehicle usage (with a corresponding increase in pedestrian trips once the vehicle is parked).
Figure 11 Attempt to Monitor Pedestrian Trends Using Traffic Count Data
* Median volume in 1994/1995
= 175 pedestrians
* Volume based on sum of pedestrian crosswalk volumes
5.4 Approach for the Central Sector
Screenline and cordon counts have the potential to address some of the fundamental issues impacting pedestrian traffic count data. Screenlines and cordons are comprised of a number of count stations, increasing the reliability of the results. More importantly, however, it is less likely that walking trips across a screenline represent trips made to access transit or vehicle parking. For this reason, it is possible to use screenline data to monitor pedestrian activity in the Central Sector. Unfortunately, screenline data is less appropriate for monitoring other areas of the city, since screenlines outside the downtown are not consistently counted every two years. Moreover, screenlines in outlying areas are generally not well-situated for capturing pedestrian trends. As the U.K. DETR notes (2000):
Because pedestrian journeys are usually very short, the choice of any
screenline or cordon is more critical than it would be for surveys of motor
vehicles. The cordons used to monitor vehicles may be inappropriate for
surveying pedestrians (pg. 5).
This is certainly true in Ottawa, particularly for those screenlines which capture travel activity across the greenbelt. Fortunately, the location of the Central and Inner Area cordons is well-suited for monitoring pedestrian travel into and out of the downtown. Figures 12 and 13 present the results of the cordon analysis. Appendix D contains a summary of the corresponding traffic count data.
An examination of Figure 12 reveals the significant degree of pedestrian activity associated with the Central Area cordon. In contrast, the Inner Area cordon has much lower pedestrian volumes, a trend which is inconsistent with observed cycling trends. In terms of absolute cycling activity, the Inner Area cordon has slightly higher cycling volumes, although the Central Area cordon has more cyclists on a per vehicle basis.
In Figure 13, normalized pedestrian and cycling volumes have been presented for comparison purposes. Note that pedestrian volumes across the Central Area cordon are expressed in units of pedestrians per 10 vehicles so that all data could be presented on the same scale. In general, both cordons show a decrease in cycling activity between 1994/1995 and 2000/2001. In terms of cyclists per vehicle, this decrease ranges from 16% at the Central Area cordon to 18% at the Inner Area cordon. Over the same time interval, pedestrian activity remained relatively constant, decreasing by 4% across the Inner Area cordon, and increasing by 3% across the Central Area cordon (measured relative to motor vehicle traffic).
Figure 12 Pedestrian Volumes At Central and Inner Area Cordons
Figure 13 Pedestrians and Cyclists Relative to Vehicle Traffic
Although pedestrian activity in the central area is likely to be high due to the nature of the surrounding development, it is certain that many of the walking trips observed are secondary trips associated with another primary mode of transportation. Transit service in the downtown is such that many employees and shoppers may cross the Central Area cordon twice during the same trip as both transit riders and pedestrians. The same is true for people who travel downtown by private vehicle, then park and walk to their destination. As a result, the Central Area cordon cannot be said to monitor pedestrian trips made solely by the walking mode. However, the cordon data does provide useful information on overall pedestrian levels in the central business district, which may be of some value in assessing the quality of the walking environment in the downtown in terms of encouraging people to take public transit or walk (assuming automobile volumes remain relatively constant).
5.5 Options for Outlying Areas
While screenline and cordon data can be used to monitor pedestrian activity into and out of the downtown, this approach is not suitable for monitoring other areas of the city as discussed in Section 5.4 above. Fortunately, there are other ways to monitor pedestrian activity at relatively low cost. For example, a questionnaire administered to parents at the beginning of the school year could provide important insight into the mode share of school-related trips, trips which represent a high proportion of the total number of trips made daily in an urban area. Along a similar vein, the Region of Waterloo is developing a school curriculum to teach children about the importance of walking and cycling. As part of the curriculum, students will be required to conduct a school travel survey, the results of which can be used to track activity levels over time. Other options worthy of further consideration include:
· Annual employee surveys (especially at large employers with commitments to reduce employee vehicular travel)
· Focused origin-destination surveys conducted at key pedestrian destinations (i.e. schools, community shopping centres, hospitals, etc.)
· Perception and attitudinal surveys
There is also the potential to use surrogate measures to estimate pedestrian activity, For example, a change in the number of collisions involving pedestrians may be indicative of a change in pedestrian activity. However, such changes may also be due to an improvement in safety, limiting the ability of collision data to accurately reflect pedestrian activity in areas where safety measures have been implemented.
Another alternative is to select special “uncontaminated” pedestrian monitoring stations which are not unduly influenced by secondary pedestrian trips. Such stations may correspond with existing count locations[13], but are more likely to be new count stations away from transit stops and vehicle parking. Although the number of suitable stations may be small, reliable results could be achieved by conducting multiple counts at the same location. Currently, the City of Ottawa is developing level of service standards for sidewalk and pathway maintenance. The pedestrian and cycling networks that are defined as part of this work may prove useful in determining the location of appropriate monitoring sites.
Each of the monitoring methods discussed above address the limitations of the pedestrian traffic count data that is currently collected. However, none of the methods are currently used by the City of Ottawa, and could therefore represent an additional cost to implement depending on the monitoring approach selected and the potential to undertake the work in conjunction with other programs.
5.6 Implications & Recommendations
Based on the considerations outlined above, the following recommendations are made concerning the development of a methodology for monitoring pedestrian activity:
· For the Central Sector, it is recommended that the Inner Area cordon be used to monitor changes in pedestrian activity into and out of the downtown. Since this cordon is counted on a regular basis, there is no requirement for additional data collection. While the cordon surrounding the Central Area cannot be said to monitor changes in the number of trips made solely by the walking mode, the cordon may provide useful information on the quality of the walking experience in the downtown as reflected by increased pedestrian activity.
· For areas outside the downtown, existing traffic count data cannot be used to monitor pedestrian activity in a meaningful way. It is therefore recommended that a number of alternative measures be explored to assess their feasibility in terms of monitoring pedestrian trends at key destinations. Perhaps the most promising of these monitoring techniques involves conducting surveys at schools, workplaces, and commercial areas. In conjunction with such surveys, it may be possible to select a number of long-term pedestrian monitoring stations throughout the city which are not unduly influenced by transit activity or vehicle parking. Unlike the cycling methodology, these monitoring approaches could have cost implications in terms of additional data collection and manipulation.
6. Additional Considerations
6.1 Future Changes in Defined Goals/Targets
The proposed methodology for monitoring pedestrian and cycling activity as described in this report will allow the City of Ottawa to monitor progress towards realizing the goals defined in the Transportation Master Plan. However, this methodology is not intended to be the sole monitoring technique used by the City of Ottawa. Rather, the methodology should be an integral component of a more comprehensive pedestrian and cycling monitoring program, a program which might also include attitude surveys, “before and after” studies of specific facilities, etc.
The City of Ottawa has recently embarked on the process of updating its Transportation Master Plan. As part of this work, new goals will be established with regards to pedestrian and cycling activity. These goals will set the foundation for the programs and policies that must be implemented to bring about desired changes in travel behaviour. More importantly, the newly defined goals will have a direct bearing on what needs to be monitored, and how the monitoring should take place.
The pedestrian and cycling goals that are put forward as part of the new Transportation Master Plan should be structured to facilitate the monitoring process. In this regard, the goals should be specific, quantifiable, and relatively easy to measure using available data. With the development of new pedestrian and cycling goals, refinements to the City’s monitoring program may be required. However, regardless of how the goals are defined, the proposed methodology for monitoring pedestrian and cycling activity will provide valuable information on pedestrian and cycling trends in the City of Ottawa.
6.2 Changes in the Data Collection System
Just as goals and targets change over time, the process of data collection may also change in response to shifting priorities and budget considerations. The most appropriate method of monitoring trends in pedestrian and cycling activity in the City of Ottawa will vary depending on the data collection system that is in place. Changes in the frequency or type of data collection may thus necessitate changes in the monitoring approach. For example, if a decision is made to increase the frequency of large-scale origin-destination surveys, there may be little value in using traffic counts to track activity levels. By the same token, if budget cuts reduce the frequency of traffic counts, other monitoring techniques may need to be developed. At the other end of the spectrum, an increase in the frequency of data collection might permit cycling and pedestrian indicators to be updated on an annual basis, instead of tracking trends using two-year intervals.
While the proposed methodology for monitoring pedestrian and cycling activity is believed to be the most appropriate at the present time given the City’s current data collection process, it should be recognized that changes may be required in the future as data collection activities are modified and refined.
6.3 Monitoring of Influencing Factors
To fully appreciate observed changes in travel behaviour, it is important to monitor the factors that influence behaviour. Without such monitoring, it is impossible to attribute an increase or decrease in activity to specific actions by the City of Ottawa. For example, an increase in cycling may reflect a societal trend towards better health and fitness, and may not be a reflection of the City’s commitment to cycling. Likewise, a change in the value of travel time may decrease the number of cycling trips despite specific programs to encourage cycling activity. Indeed, travel decisions can be impacted by development patterns, economic factors, and social values. By monitoring specific features of the physical and non-physical pedestrian and cycling environment, a greater understanding of observed trends is revealed.
The monitoring techniques described in this report will enable the City of Ottawa to examine changes in pedestrian and cycling activity over time. However, to arrive at meaningful conclusions upon which future activities and programs can be based, it is necessary to develop an understanding of the influencing factors within and beyond the City’s control. Although it is beyond the scope of the present investigation to identify such factors, the following discussion provides insight into the types of factors that should be monitored.
As alluded to above, mode choice decisions are directly related to public perceptions and social values. Considerations such as cost, convenience, and safety all play an important role in the decision to walk or cycle. Attitudinal surveys conducted at regular intervals can provide important insight into some of the underlying factors which may be contributing to changes in modal share. Such surveys are generally structured to provide information on people's attitudes and usage of alternative transportation modes, and can also be used to identify factors that deter people from walking or cycling. Using the results from such surveys, specific measures to encourage pedestrian and cycling activity can be developed.
While many factors influencing travel behaviour are outside the City’s control and difficult to monitor, other factors are a direct reflection of the City’s policies and programs. Clearly, it is important to monitor the City’s expenditures and commitment towards encouraging non-motorized travel in order to gain a fuller appreciation of observed behaviour. From a cycling perspective, indicators of such commitment might include:
· Per capita budget for cycling programs and new facilities
· Maintenance budget for addressing specific cycling concerns
· Length of on-street cycling network–bike lanes, wide curb lanes, paved shoulders
· Length of off-road cycling network
Likewise, from a pedestrian perspective, it may be valuable to monitor indicators such as:
· Per capita budget for pedestrian facilities and maintenance
· Percentage of collector roads with sidewalks on one/both sides
· Percentage of roads with acceptable illumination
By monitoring these inputs to the cycling and pedestrian environment, changes in travel behaviour can be more fully understood.
7. Conclusions & Recommendations
The City of Ottawa currently collects pedestrian and cycling data as part of their annual traffic count program. The purpose of this investigation was to assess the usefulness of this data in terms of monitoring the City’s progress towards achieving the mode share objectives set out in the Official Plan. Although pedestrian and cycling modal shares can be derived from the city-wide Origin-Destination survey that is conducted every ten years, there is a need to monitor trends on a more frequent basis to allow the City to respond effectively to observed changes. From our investigation of the City’s traffic count database, it has become apparent that:
· The traffic counts that are currently conducted provide sufficient information for monitoring cycling trends on a bi-annual basis.
· Limitations in the pedestrian traffic count data preclude the use of such data in monitoring trips made solely by the walking mode. The only exception to this is in the central area, where traffic counts at the Central and Inner Area cordons can be used to monitor pedestrian trips into and out of the downtown.
Based on these findings, the following recommendations are made regarding the data collection process and the development of methodologies to monitor pedestrian and cycling trends.
In terms of cycling activity:
· It is recommended that the cycling activity index as described in this report be used to monitor cycling trends in the City of Ottawa on a zone-by-zone basis.
· For the Central Sector, it is further recommended that cycling activity be monitored using the cordon approach as well as the cycling activity index. Both approaches yield important insight into cycling trends in the downtown and can be readily calculated using traffic count data that is regularly collected.
·
When the next
origin-destination survey is completed, mode share trends from the survey data
should be compared with long-term trends in the cycling activity index to
ensure that the two data sources are producing consistent results. Any
discrepancies that do arise should be fully investigated so that appropriate
adjustments can be made to the data collection system.
In terms of pedestrian activity:
· It is recommended that the Central and Inner Area cordons be used to monitor changes in pedestrian activity into and out of the downtown. Since these cordons are counted on a regular basis, there is no requirement for additional data collection.
· For areas outside the downtown, existing pedestrian traffic count data cannot be used to monitor pedestrian activity in a meaningful way. It is therefore recommended that a number of alternative measures be explored to assess their feasibility in terms of monitoring pedestrian trends at key destinations. Perhaps the most promising of these techniques involves conducting surveys at schools, workplaces, and commercial areas. In conjunction with such surveys, it may be possible to select a number of long-term pedestrian monitoring stations throughout the city which are not unduly influenced by transit activity or vehicle parking. Unlike the cycling methodology, these monitoring approaches could have cost implications stemming from the need for additional data collection and manipulation.
In terms of data collection and analysis:
·
The existing data
collection program at the City of Ottawa is believed to be adequate for
monitoring cycling trends on an area-wide basis. Although the study team does
not feel that there is merit in expanding the existing traffic count program at
the present time, it is recognized that there may be zone-specific instances
when there may be merit in adding a new location to the traffic count program
to enhance the reliability and representativeness of the cycling index.
· Improvements to the City’s traffic count database should be pursued to improve data quality. For example, the weather field should be consistently filled in when working with Classification and Occupancy counts. In addition, a look-up table should be developed for the turning movement database which provides information on the traffic zone where each count station is located.
· All intersections selected for inclusion in the cycling activity index should be placed on a “priority list” to ensure the intersections are counted at least once every two years. To adequately capture school trips in the count data, these priority intersections should be counted in May or June wherever possible, recognizing that observed cycling trends may be unreliable in the short-term as the index self-adjusts to May/June conditions. If a move is made to ensure that all priority intersections are counted before the start of summer holidays, the query decision rules in Section 4.2.6 should be updated accordingly.
· To fully appreciate observed changes in pedestrian and cycling activity, it is recommended that the City of Ottawa’s commitment to encouraging non-motorized travel be monitored in terms of inputs and changes to the transportation system.
These recommendations provide a basis for establishing a methodology for monitoring pedestrian and cycling trends. By monitoring these trends on a regular basis, policies and programs can be implemented and refined in support of sustainable transportation objectives.
Next Steps
In moving forward, it is recommended that consideration be given to undertaking further work to extend the application of the cycling index methodology to the remaining cycling zones. It is also recommended that consideration be given to designing and applying a data collection process for monitoring pedestrian activity outside the urban core. It is envisioned that the latter would include:
· Identification of “uncontaminated” long-term pedestrian monitoring stations, once the City’s pedestrian network has been defined; and
· Development and application of a pilot survey for school students and employers, potentially to be conducted in the Fall of 2003.
Given the time-dependency of the pedestrian-monitoring activities, it is recommended that current priority be given to extending the cycling methodology. This work can essentially be broken down into three key tasks, as follows:
1. Development of a user-friendly process for updating the cycling index on a bi-annual basis.
2. Selecting appropriate count locations in each remaining cycling zone for monitoring trends, with due consideration to sample size requirements. [It should be noted that the level of effort required to undertake this task will vary depending on whether a look-up table has been developed indicating the location of each count station, as recommended above].
3. Applying the process developed in task 1 to the traffic count database to establish cycling trends between 1994/1995 and 2000/2001 for each zone of interest.
It is recognized that it may not be possible / desirable to fully automate the index calculation process due to potential changes in the format of the City’s database and the difficulty in working with a copy of the database rather than the database itself. However, a combination of partial automation and easy-to-follow instructions should allow City staff to update the cycling index with relative ease.
It is important to note that the activities described above represent a variation from what was initially proposed under phase 2 of this project as outlined in our proposal to the City dated June 7, 2002. This deviation from our original thinking reflects new information and insight gained during the present study, information and insight that will ultimately contribute to an enhanced way of monitoring pedestrian and cycling activity in the City of Ottawa.
8. Key References
DSS Management Consultants. 2000. Illness Costs of Air Pollution. Prepared for the Ontario Medical Association. http://www.oma.org/phealth/smogmain.htm
Health Canada. 2002. World Health Day Recognizes the Importance of Physical Activity to Good Health. News Release. April 5, 2002. http://www.hc-sc.gc.ca
Regional Municipality of Ottawa-Carleton (RMOC). 1997. Transportation Master Plan. Ottawa, Ontario: Regional Municipality of Ottawa-Carleton.
Schwartz, W.L., C.D. Porter, G.C. Payne, J.H. Suhrbier, P.C. Moe, and W.L. Wilkinson. 1999. Guidebook on Methods to Estimate Non-Motorized Travel. Prepared by Cambridge Systematics, Inc. and the Bicycle Federation of America for the Federal Highway Administration, U.S. Department of Transportation. http://safety.fhwa.dot.gov/fourthlevel/pdf/guidebook1.pdf
U.K. Department of the Environment, Transport and the Regions (DETR). 1999. Monitoring Local Cycle Use. Traffic Advisory Leaflets. London, England: U.K. Department of the Environment, Transport and the Regions. http://www.roads.dft.gov.uk/roadnetwork/ditm/tal/cycle/01_99/index.htm#9
U.K. Department of the Environment, Transport and the Regions (DETR). 2000. Monitoring Walking. Traffic Advisory Leaflets. London, England: U.K. Department of the Environment, Transport and the Regions. http://www.roads.dft.gov.uk/roadnetwork/ditm/tal/walking/06_00/pdf/06_00.pdf
U.S. Department of Transportation (DOT), Bureau of Transportation Statistics. 2000. Bicycle and Pedestrian Data: Sources, Needs, & Gaps. Washington, DC: U.S. Department of Transportation. http://www.bts.gov/programs/transtu/bikeped/report.pdf